Understanding the STOCHRSI indicator
Author: The Little Dream, Created: 2016-08-24 19:25:22, Updated: 2017-10-11 11:07:31Understanding the STOCHRSI indicator
- Recently, I helped a friend solve a problem about an indicator called STOCHRSI. It's a simple book. But as long as you study a little, you will get a little, share your experience below, you need to use this as a friend can learn.
I found some calculation formulas for this indicator online.
/*
LC := REF(CLOSE,1); //REF(C,1) 上一周期的收盘价
RSI:=SMA(MAX(CLOSE-LC,0),N,1)/SMA(ABS(CLOSE-LC),N,1) *100;
%K:     MA(RSI-LLV(RSI,M),P1)/MA(HHV(RSI,M)-LLV(RSI,M),P1)*100;  LLV(l,60)表示:检索60天内的最低价,可适应于检索任何股票
%D:MA(%K,P2);

LC := REF(CLOSE,1);
RSI:=SMA(MAX(CLOSE-LC,0),N,1)/SMA(ABS(CLOSE-LC),N,1) *100;
STOCHRSI:MA(RSI-LLV(RSI,M),P1)/MA(HHV(RSI,M)-LLV(RSI,M),P1)*100;
*/
My God, I've had enough patience to watch it. This description is a general formula. But even with a little programming experience, I can only guess!
- 1. The information found on the Internet says that there are about three different forms of this indicator. The formula above is two of them.
- 2. Look and compare chart trends on different platforms. Find different descriptions of this indicator. The parameter description of the indicator function STOCHRSI in the talib index library on the platform is not fully understood.
- 3. Enter parameters 14,14,3,3 using the talib indicator library. This set of parameters, compared to the data obtained from other platforms, found a large difference.
- 4.有点想动手撸这个指标…(有点怕怕,弄不好就被代码虐了)。
After a painful struggle... Summary:
- 1, the RSI indicator is the underlying data of the indicator regardless of the form it takes. It compares the other platforms described and the above formula.
- 2, also found different descriptions of this indicator, some descriptions are that the indicator output is %K, %D two lines. Some descriptions are that the output is STOCHRSI, MA ((3) (the parameters of this description are 14, 14, 3, 3) The formula for calculating the two lines (data) is the same, although it is in two different forms: %K === STOCHRSI, %D === MA(3). Determine that 3 of MA(3) is a parameter. The remaining two parameters, which are M and P1 in the formula above, are already tried. 14 and 3 are both tried. Finally, the leaked indicator data is found, finally the data on other platforms is correct.
Green is fastline %K, orange is %D.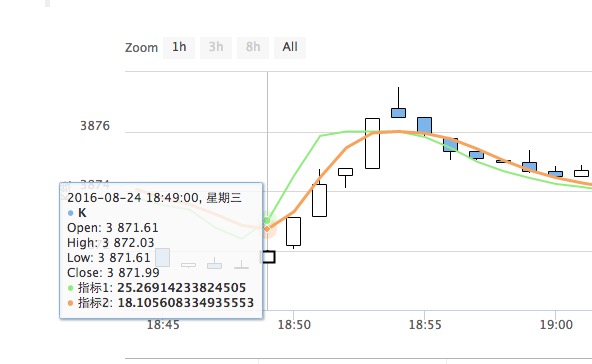
- The indicator is written by myself and can be compared to OKCoin below.
function LLV(array,period){
    if(!array || array.length - period < 0){
        throw "error:" + array;
    }
    var min = array[array.length - period];
    for(var i = array.length - period; i < array.length; i++){
        if( array[i] < min ){
            min = array[i];
        }
    }
    return min;
}

function HHV(array,period){
    if(!array || array.length - period < 0){
        throw "error:" + array;
    }
    var max = array[array.length - period];
    for(var i = array.length - period; i < array.length; i++){
        if( array[i] > max){
            max = array[i];
        }
    }
    return max;
}

function DeleteNullEle(initArr){
    var dealArr = [];
    var initArrLen = initArr.length;
    for(var i = 0,j = 0 ; i < initArrLen ; i++,j++){
        if(initArr[i] === null || isNaN(initArr[i]) ){
            j--;
            continue;
        }
        dealArr[j] = initArr[i];
    }
    return dealArr;
}

/*
LC := REF(CLOSE,1); //REF(C,1) 上一周期的收盘价
RSI:=SMA(MAX(CLOSE-LC,0),N,1)/SMA(ABS(CLOSE-LC),N,1) *100;
%K:     MA(RSI-LLV(RSI,M),P1)/MA(HHV(RSI,M)-LLV(RSI,M),P1)*100;  LLV(l,60)表示:检索60天内的最低价,可适应于检索任何股票
%D:MA(%K,P2);

LC := REF(CLOSE,1);
RSI:=SMA(MAX(CLOSE-LC,0),N,1)/SMA(ABS(CLOSE-LC),N,1) *100;
STOCHRSI:MA(RSI-LLV(RSI,M),P1)/MA(HHV(RSI,M)-LLV(RSI,M),P1)*100;
*/
function FstochRSI(records,n,m,p1,p2){
    var len = records.length;
    //var LC = records[len-2];//上一周期收盘价
    //var rsi = TA.RSI(records,n);// RSI 数组   ,talib
    var rsi = talib.RSI(records,n);
    rsi = DeleteNullEle(rsi);//ceshi

    var arr1 = [];
    var arr2 = [];
    var arr3 = [];
    var arr4 = [];
    var rsi_a = [];
    var rsi_b = [];
    var k = [];
    var d = null;

    /*不包含当前柱
    for(var a = 0 ;a < rsi.length ; a++ ){//改造 不用 LLV
        for(var aa = 0 ; aa <= a; aa++ ){
            rsi_a.push(rsi[aa]);
        }
        arr1.push(rsi[a] - TA.Lowest(rsi_a,m));
    }
    for(var b = 0 ;b < rsi.length ; b++ ){//改造 不用 HHV
        for(var bb = 0 ; bb <= b; bb++ ){
            rsi_b.push(rsi[bb]);
        }
        arr2.push(TA.Highest(rsi_b,m) - TA.Lowest(rsi_b,m));
    }
    */
    for(var a = 0 ;a < rsi.length ; a++ ){//改造 不用 LLV
        if(a < m){
            continue;
        }
        for(var aa = 0 ; aa <= a; aa++ ){
            rsi_a.push(rsi[aa]);
        }
        arr1.push(rsi[a] - LLV(rsi_a,m));
    }
    for(var b = 0 ;b < rsi.length ; b++ ){//改造 不用 HHV
        if(b < m){
            continue;
        }
        for(var bb = 0 ; bb <= b; bb++ ){
            rsi_b.push(rsi[bb]);
        }
        arr2.push(HHV(rsi_b,m) - LLV(rsi_b,m));
    }

    arr1 = DeleteNullEle(arr1);
    arr2 = DeleteNullEle(arr2);
    //Log("arr1:",arr1.length,"-",arr1);//ceshi
    //Log("arr2:",arr2.length,"-",arr2);//ceshi

    arr3 = talib.MA(arr1,p1);
    arr4 = talib.MA(arr2,p1);

    arr3 = DeleteNullEle(arr3);
    arr4 = DeleteNullEle(arr4);

    //Log("ceshi");//ceshi
    var c = 0;
    var diff = 0;
    if(arr3.length !== arr4.length){//实测 长度不相等
        throw "error: !=" + arr3.length + "----" + arr4.length;
        diff = arr4.length - arr3.length; //example   diff  =   10  -   6
    }else{
        //throw "error:" + arr3.length + "----" + arr4.length;
    }

    for( ;c < arr3.length ; c++ ){
        k.push(arr3[c] / arr4[c + diff] * 100);
    }

    d = talib.MA(k,p2);

    return [k,d,rsi];
}
- Quantified TA library by open source inventors, learn to use (includes Javascript/Python/C++ version)
- Butterfly Suits
- Psychological qualities, ability to innovate, financial management, strategy
- A simple strategy framework (which can be modified and extended on your own)
- The process and thinking of developing a quantitative strategy
- The causes of over-conformity in procedural transactions
- To be a smart gambler, you have to understand these things first.
- The 10 biggest pitfalls of quantitative trading
- Q: Can you explain to me what ETFs are?
- The Bronze Age: The Delusion of the Shinto
- Statistical interest
- How can we replicate the success of hedge funds?
- Deep Learning Tutorial
- Digital currencies - API-KEY applications, configurations, etc. for various exchanges
- X-minutes to Go
- X-minute to JavaScript
- Summary of issues such as CTP Commodity Futures Real Estate Exchange configuration, strategy launch
- The graph template is upgraded!
- 2.8 Switching to a market data update mode (explanation)
- How to get the current BOLL up-line, mid-line, down-line?
JWhen retested, this function was found to be very slow and to be improved.
JI don't know what to do with the data from talib.STOCHRSI))) to correct the data from Bitcoinwisdom?
The Little Dreamtalib is an indicator library open source. It is used in BotVS, e.g. to search for even-line talib.MA ((records, 10); // records to search for even-line cycles of K-line data. It is calculated as the median of the records K line of 10 bars.
The Little DreamFstochRSI ((records, n, m, p1, p2) corresponding to OKCoin parameters are the same, except that the first records is K-line data, which is the data source for the calculation of the indicator, and I compared the data calculated in the OK graph to the same data, which is that the algorithm is a bit slower.
The Little DreamMaybe the algorithm or the code needs optimization.
JVery good, now it's normal. Thank you!
The Little DreamThe code is already written in the post, you can compare it below.
JSo we're going to use the STOCH function first, and we're going to get the same effect.
The Little DreamTalib's disagreement, internal calculations, are a bit different. I wrote STOCHRSI myself, and posted it later.