Timeline data analysis with Tick data retrieval
Author: Goodness, Created: 2019-08-08 10:05:45, Updated: 2023-10-20 20:11:54
Time series data
Time series refers to a sequence of data obtained at consecutive equal intervals of time. In quantitative investing, these data mainly represent the movement of prices and data points tracked by the investment indicator. For example, the price of a stock, the time series data recorded periodically over a specified period of time can be seen in the following diagram, which gives the reader a clearer understanding:
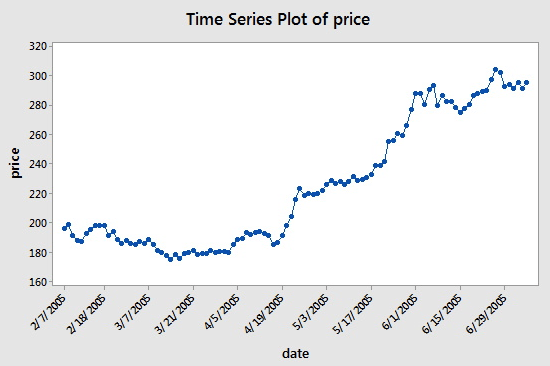
As you can see, the date is on the x-axis and the price is on the y-axis. In this case, the consecutive time interval of the x-axis is 14 days apart: note the difference between March 7, 2005 and the next point, March 31, 2005, April 5, 2005 and April 19, 2005.
However, when you use time series data, you will often see more than just this data that contains only two columns of dates and prices. In most cases, you will use data that contains five columns: data cycle, opening price, highest price, lowest price, and closing price. This means that if your data cycle is set to a daylight level, then the high, open, low, and closing price changes of the day will be reflected in the data in this time series.
What is Tick Data?
Tick data is the most comprehensive transaction data structure on an exchange. It is also an extended form of the time series data mentioned above, including: opening price, highest price, lowest price, latest price, volume, volume. If the transaction data is analogous to a river, Tick data is the data of the river in a cross section.
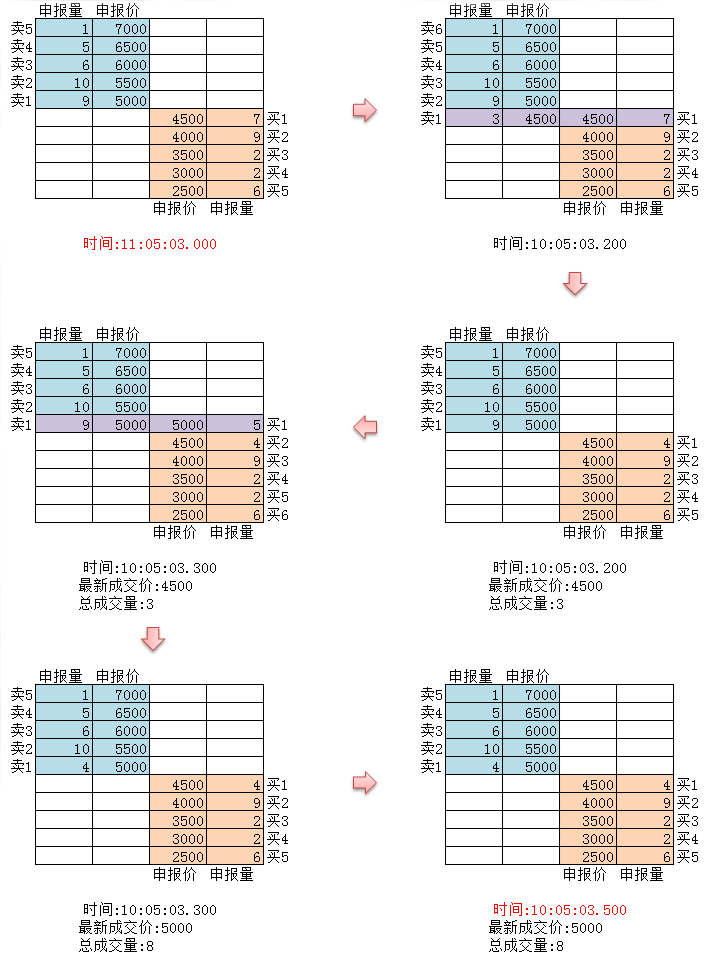
As shown above, each move in the national exchange is pushed to the market in real time; while the domestic exchange, which checks twice per second, generates a snapshot and pushes out if there is a move within that time frame. By comparison, the amount of data pushed can only be counted as OnTime, not called OnTick.
All the code and time series data for this tutorial is obtained on the inventor's quantification platform.
Tick data quantified by the inventor
Although the domestic Tick data is not a true Tick, it can be used for retesting, at least infinitely close to reducing reality. Each Tick shows the main parameters of the commodity in the market at the time, and in the real world our code, which follows the theory of Tick 2 times per second, is being calculated.
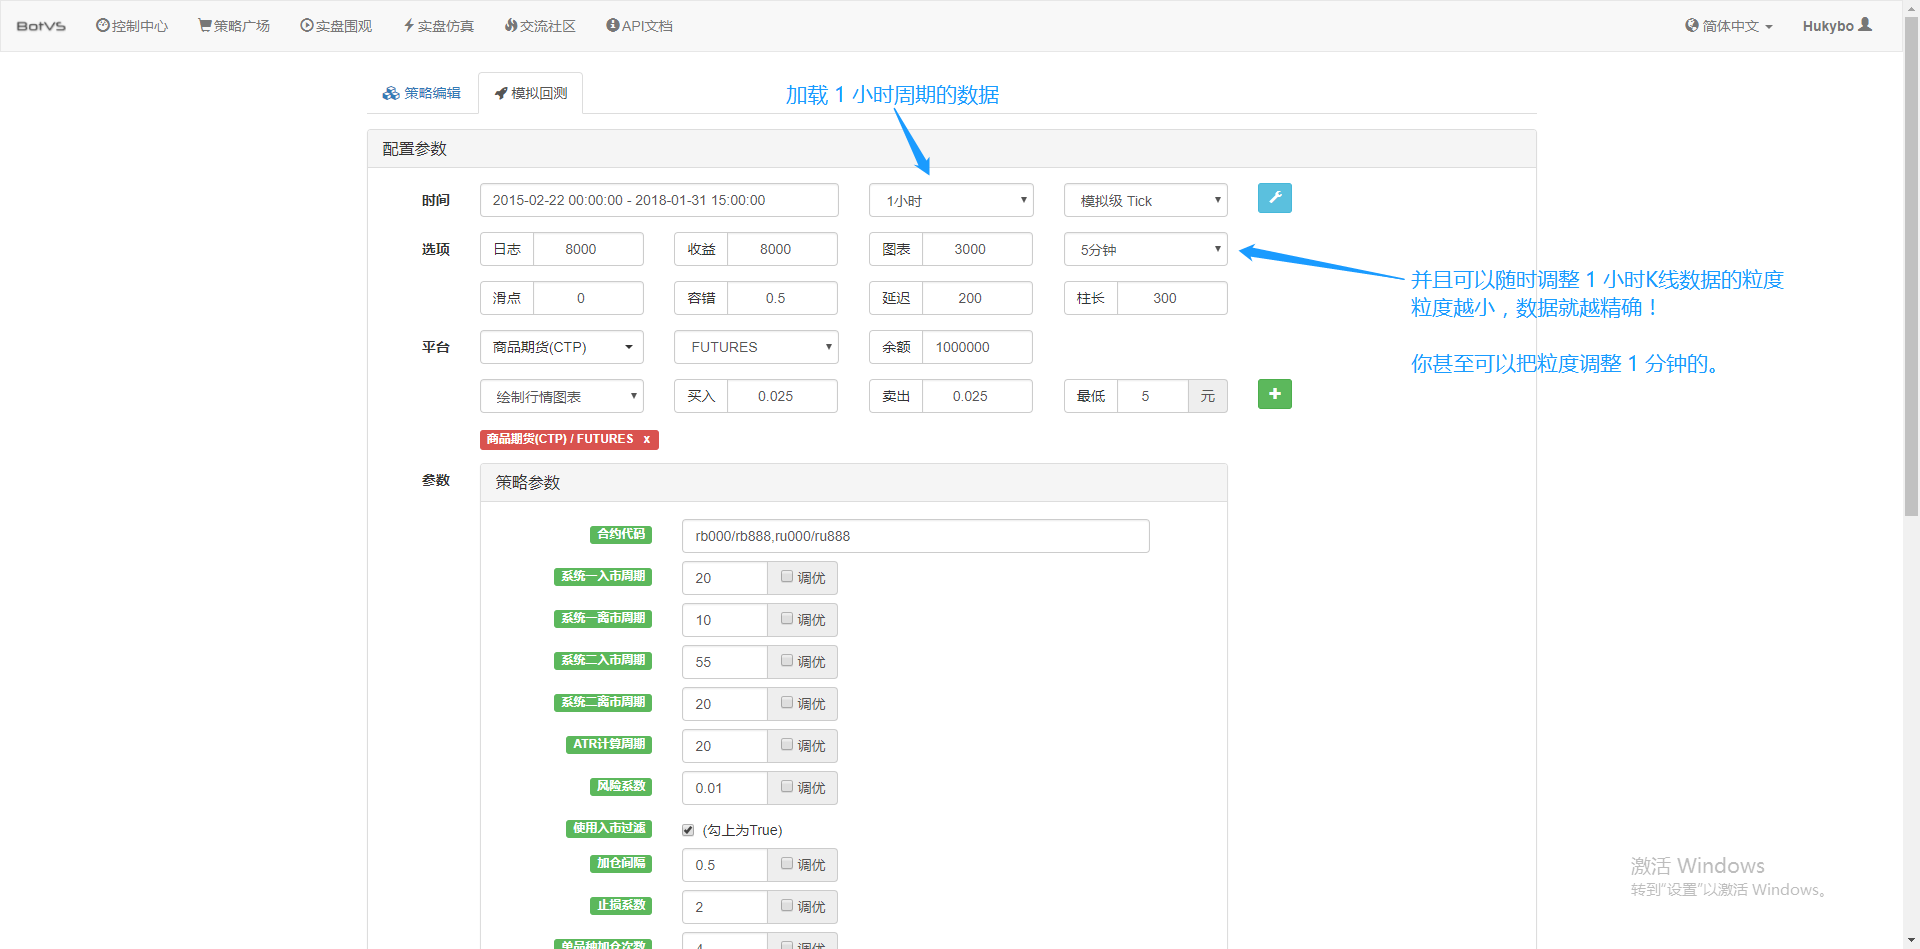
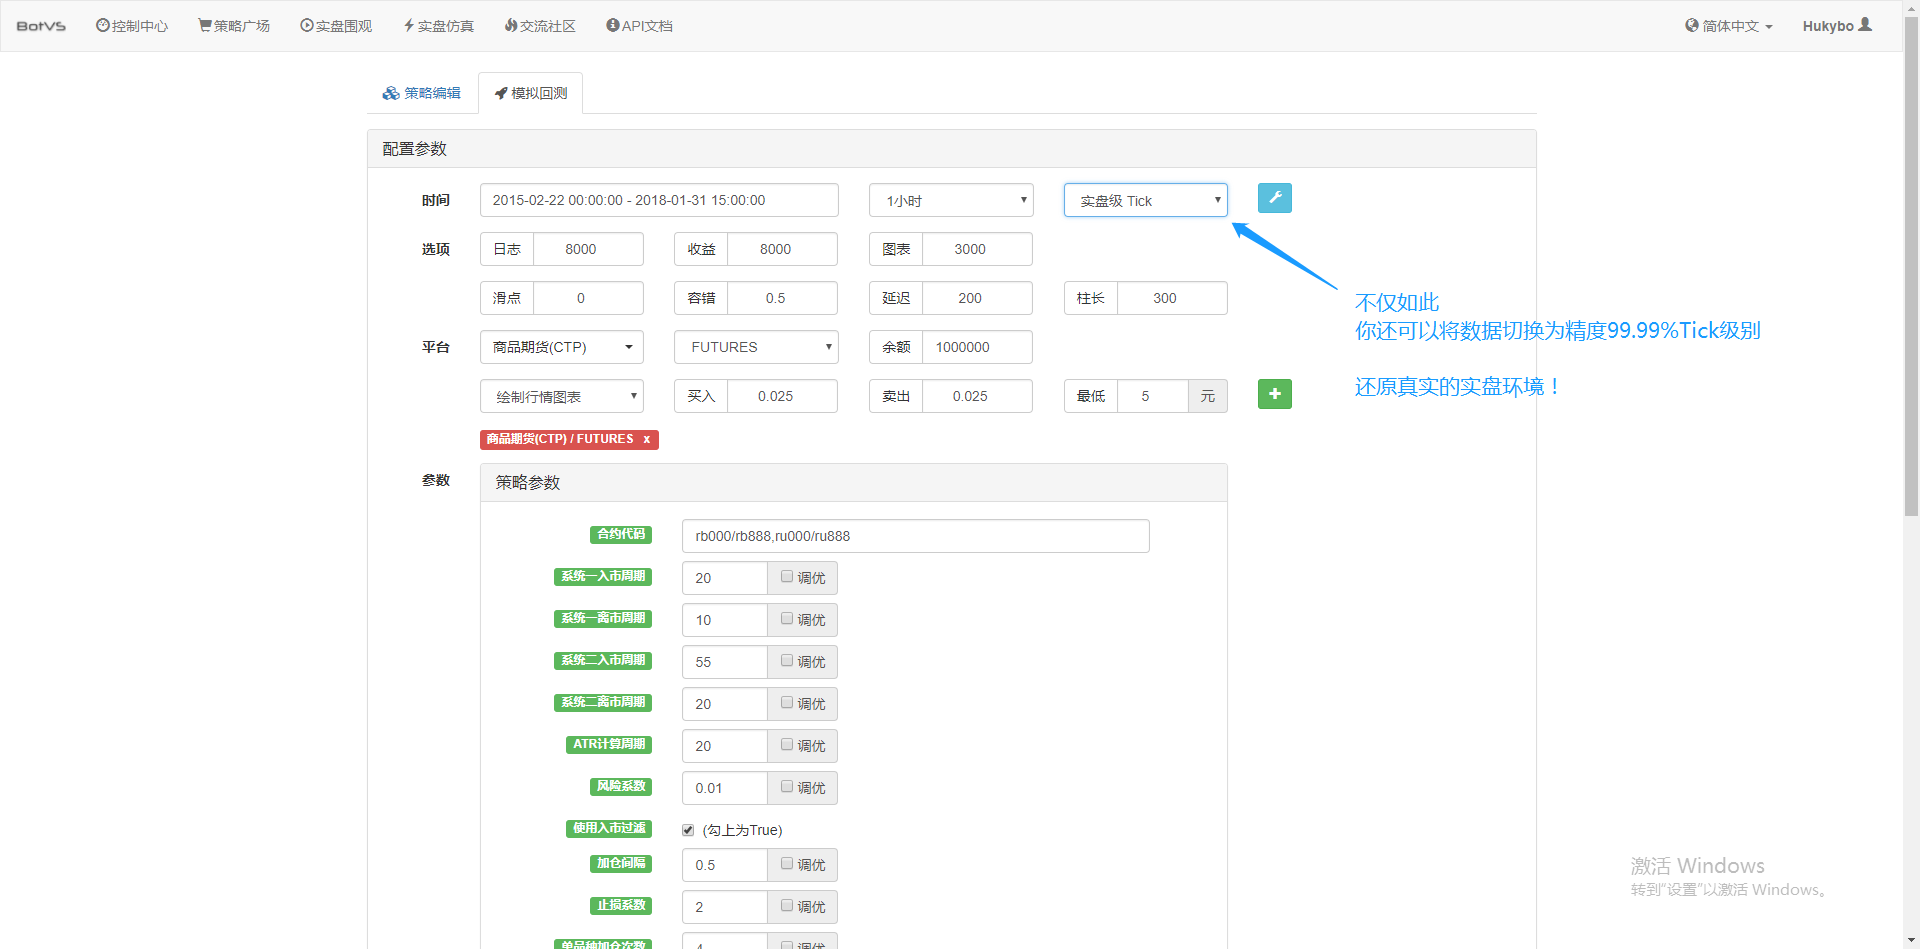
Not only that, in the inventor's quantification, even if the data is loaded with a one-hour cycle, the data grain can still be adjusted, such as adjusting the data grain to 1 minute. At this point, the 1 hour K-line is composed of 1 minute of data. Of course, the smaller the grain, the higher the precision. Even more powerful, if the data is switched to a real-disc Tick, it can seamlessly restore the real-disc environment.
Now, you've learned the basic concepts you need to understand to complete this tutorial. These concepts will be back soon, and you'll learn more about them later in this tutorial.
For more information on this section, please contact:https://www.fmz.com/bbs-topic/1651See more information
Setting up a work environment
The first thing we need to do is to deploy a custodian before the inventor quantifies the platform. The concept of a custodian, for those of you who have any programming experience, can be thought of as an officially packaged Docker system, which already contains the public API interfaces of the mainstream exchanges and the technical details of the end of the branches for writing and retesting strategies. The initial intention of this system is to prevent the various traders from using the inventor quantification platform to focus on writing and designing strategies, which are presented in the form of detailed packages to the strategy authors to save them a lot of time and effort.
- Deployment of the inventor's host system for the quantified platform
There are two ways to deploy a host.
Method A: The user rents or buys the server himself and deploys it on various cloud platforms such as AWS, Ali Cloud, Digital Ocean and Google Cloud. The advantage is that both strategic security and system security are guaranteed.
Readers can refer to this section:https://www.fmz.com/bbs-topic/2848
Method B: Public server deployment using the inventor's quantified platform, the platform provides three locations deployment in Hong Kong, London and Hangzhou, users can deploy according to the location of the exchange you want to trade, according to the principle of proximity deployment. The advantages in this regard are simple, easy, one-click completion, especially suitable for beginner users, without having to understand many things when buying a Linux server, also save the time and effort to learn Linux commands, the price is also relatively cheap, for users with a small amount of funds, the platform recommends using this deployment method.
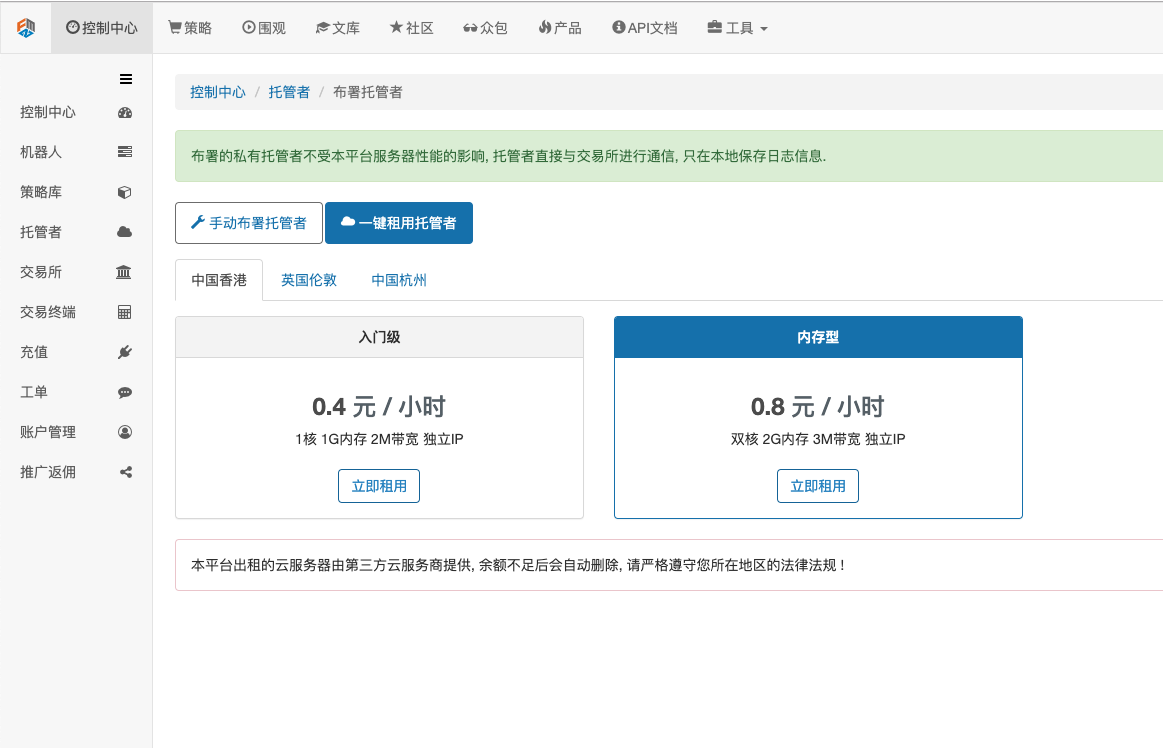
For beginners' understanding, this article will use method B.
Specifically:登陆FMZ.COMClick on Control Center, Administrator, and on the Administrator page, click on Rental Administrator.
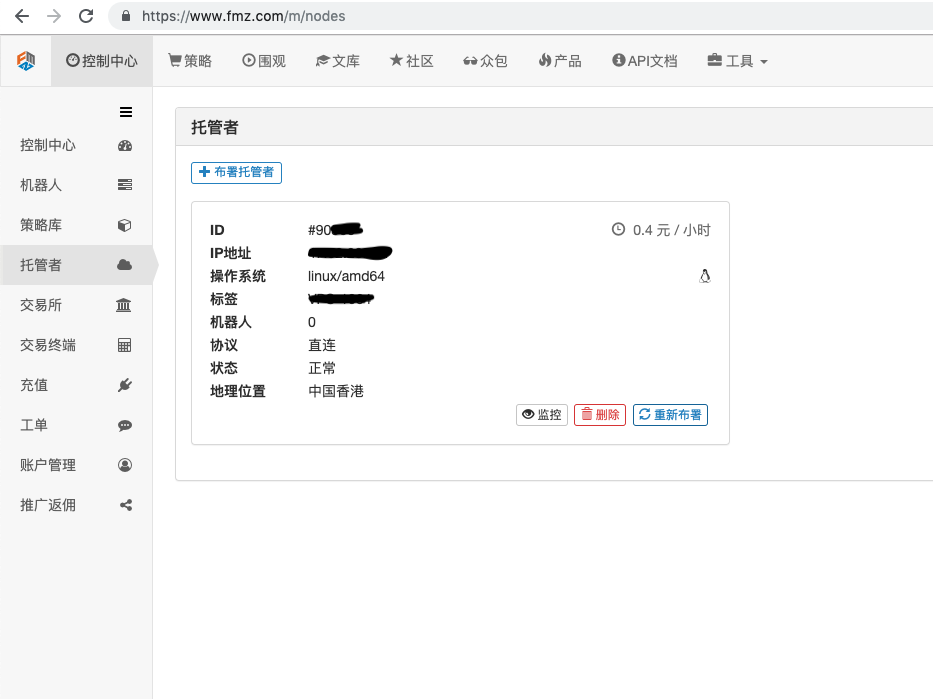
After entering the password, the deployment was successful, as shown in the following diagram:
- The concept of a robotic system and the relationship between the trustee
As mentioned above, a host is like a docker system, a docker system is like a set of standards, and we deploy the standard, and then we need to generate a nested instance nest for that standard, which is a robot.
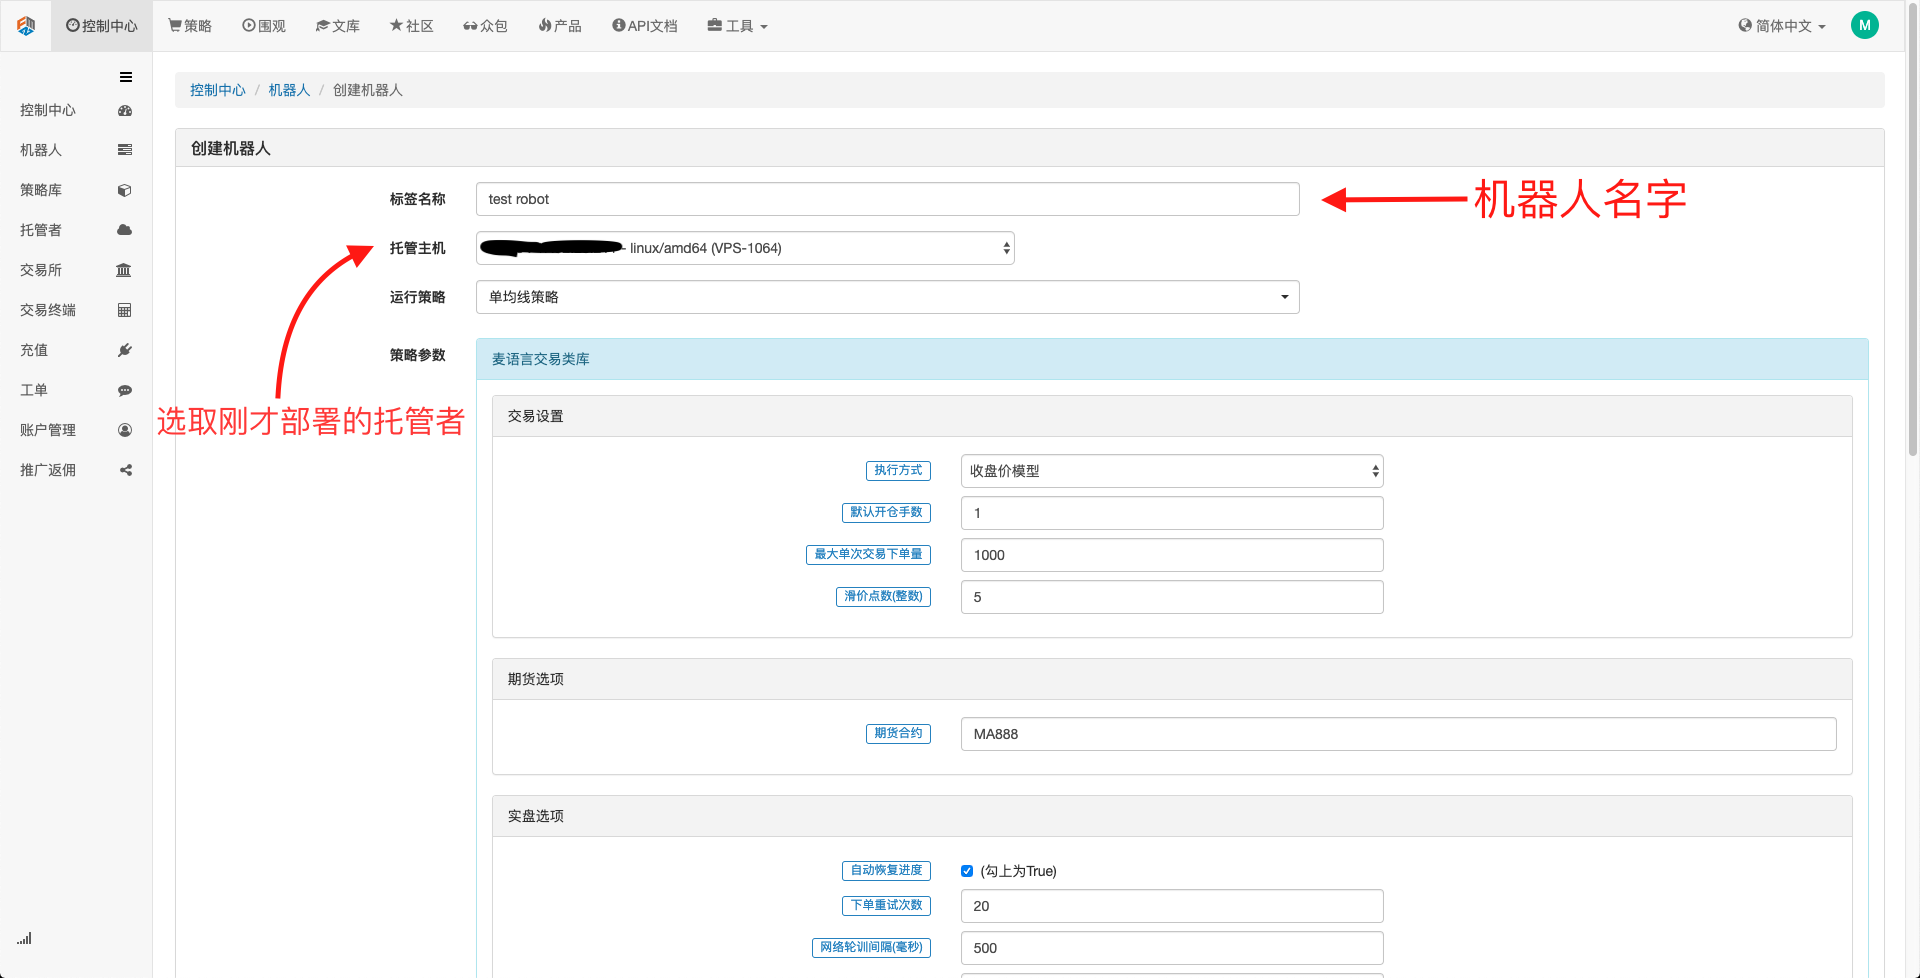
Creating a bot is very simple, after deploying a good host, click on the bot tab on the left, click Create a bot, fill in a name in the name of the tag, choose the host from which you have just deployed a good host. The parameter selection in the dialog box at the bottom and the K-line cycle can be selected according to the specific situation, mainly in conjunction with the trading strategy selection.
So far, our working environment has been built, as you can see, very simple and efficient, each function has its own function.
Use Python to implement a simple linear strategy
Above we mentioned the concepts of time series data and Tick data, and then we link the two concepts with a simple equilateral strategy.
- The basic principles of the equine strategy
By passing through a slow periodic equator, such as a 7-day equator, and a fast periodic equator, such as a 3-day equator. Apply them to the same K line diagram, and when the fast periodic equator crosses the slow periodic equator, we call it a golden fork; when the slow periodic equator crosses the fast periodic equator below the fast periodic line, we call it a dead fork.
The basis of opening a stock is that the gold fork opens more than one, the dead fork opens empty list, and the same is true for a flat stock.
让我们打开FMZ.COMIn the upper left corner, select Python. Below is the code for this strategy, with very detailed annotations on each line, so readers will slowly realize. This strategy is not a real-world strategy, never experiment with real money, mainly to let you write another rough concept and learning template for the strategy.
import types # 导入Types模块库,这是为了应对代码中将要用到的各种数据类型

def main(): # 主函数,策略逻辑从这里开始
    STATE_IDLE = -1 # 标记持仓状态变量
    state = STATE_IDLE # 标记当前持仓状态
    initAccount = ext.GetAccount() #这里用到了现货数字货币交易类库(python版),编写策略时记得勾选上,作用是获得账户初始信息
    while True: # 进入循环
        if state == STATE_IDLE : # 这里开始开仓逻辑
            n = ext.Cross(FastPeriod,SlowPeriod) # 这里用到了指标交叉函数,详情请查看https://www.fmz.com/strategy/21104
            if abs(n) >= EnterPeriod : # 如果n大于等于入市观察期,这里的入市观察期是为了防止一开盘就胡乱开仓。
                opAmount = _N(initAccount.Stocks * PositionRatio,3) # 开仓量,关于_N的用法,请查看官方API文档
                Dict = ext.Buy(opAmount) if n > 0 else ext.Sell(opAmount) # 建立一个变量,用于存储开仓状态,并执行开仓操作
                if Dict :  # 查看dict变量的情况,为下面的日志输出做准备
                    opAmount = Dict['amount']
                    state = PD_LONG if n > 0 else PD_SHORT # PD_LONG和PD_SHORT均为全局常量,分别用来表示多头和空头仓位。
                    Log("开仓详情",Dict,"交叉周期",n) # 日志信息
        else: # 这里开始平仓逻辑
            n = ext.Cross(ExitFastPeriod,ExitSlowPeriod) # 指标交叉函数,
            if abs(n) >= ExitPeriod and ((state == PD_LONG and n < 0) or (state == PD_SHORT and n > 0)) : # 如果经过了离市观察期且当前账户状态为持仓状态,进而判断金叉或者死叉
                nowAccount = ext.GetAccount() # 再次刷新和获取账户信息
                Dict2 = ext.Sell(nowAccount.Stocks - initAccount.Stocks) if state == PD_LONG else ext.Buy(initAccount.Stocks - nowAccount.Stocks) # 平仓逻辑,是多头就平多头,是空头就平空头。
                state = STATE_IDLE # 标记平仓后持仓状态。
                nowAccount = ext.GetAccount() # 再次刷新和获取账户信息
                LogProfit(nowAccount.Balance - initAccount.Balance,'钱:',nowAccount.Balance,'币:',nowAccount.Stocks,'平仓详情:',Dict2,'交叉周期:',n) # 日志信息
        Sleep(Interval * 1000) # 循环暂停一秒,防止API访问频率过快导致账户被限制。
- Reassessment of the Uniform Strategy
On the strategy editing page, we have completed the writing of the strategy, and next we will review the strategy to see how it performs in the historical industry. The review plays an important role in the development of any quantitative strategy, but at the same time it can only serve as an important reference, the review does not guarantee profits, because the market is constantly changing.
Clicking on the analogue check, you can see that there are many parameters that can be adjusted, which can be modified directly inside, for later policies that are more complex, more and more parameters, this way of modification can help users avoid the hassle of having to change the code one at a time, convenient, fast, and clear.
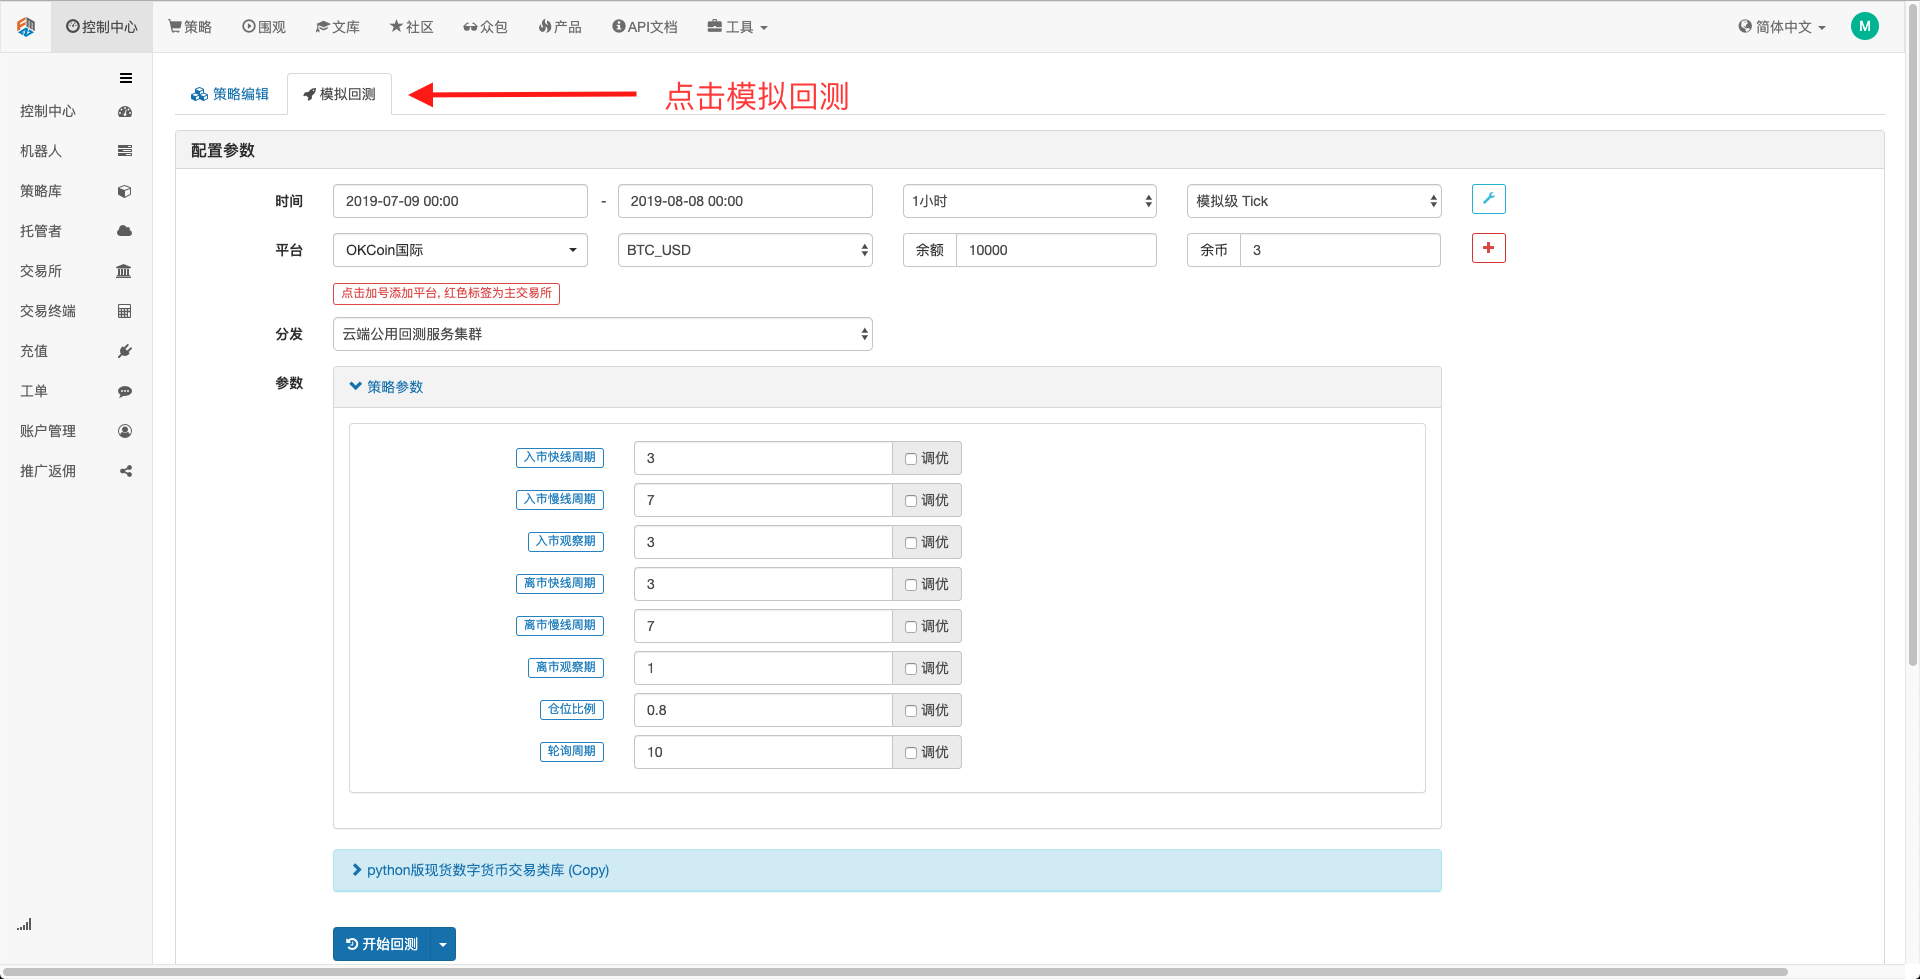
The optimization options at the back automatically optimize the parameters set, and the system tries various optimal parameters to help the policy developer find the best option.
From the above examples, we can see that the basis of quantitative trading is the analysis of time-series data through time-series data, and the interaction of tick data with tick data, and complex logic, both of these two basic elements are inseparable. The difference is only a difference in dimension, such as high-frequency trading, requires more detailed data intersection, more rich time-series data.
- Quantifying Fundamental Analysis in the Cryptocurrency Market: Let Data Speak for Itself!
- Quantified research on the basics of coin circles - stop believing in all kinds of crazy professors, data is objective!
- The inventor of the Quantitative Data Exploration Module, an essential tool in the field of quantitative trading.
- Mastering Everything - Introduction to FMZ New Version of Trading Terminal (with TRB Arbitrage Source Code)
- Get all the details about the new FMZ trading terminal (with the TRB suite source code)
- FMZ Quant: An Analysis of Common Requirements Design Examples in the Cryptocurrency Market (II)
- How to Exploit Brainless Selling Bots with a High-Frequency Strategy in 80 Lines of Code
- FMZ quantification: common demands on the cryptocurrency market design example analysis (II)
- How to exploit brainless robots for sale with high-frequency strategies of 80 lines of code
- FMZ Quant: An Analysis of Common Requirements Design Examples in the Cryptocurrency Market (I)
- FMZ quantification: common demands of the cryptocurrency market design instance analysis (1)