SuperTrend V.1 - Supertrend line system
Author: homily, Created: 2020-04-20 22:10:36, Updated: 2023-10-08 19:57:57
One, where the story comes from.
My good friend Vago has been observing this indicator for a long time and recommended it to me before New Year's Eve to discuss whether it can be converted into quantification. Unfortunately, the procrastinator has been guilty of delaying until now to help him fulfill this wish, and in fact, the understanding of the algorithm has recently exploded. I'm hoping to write a translator for a pine someday. Everything is in python. So let's not talk nonsense, but let's talk about the super trend line in this legend.
Second, an introduction to the system
CMC Markets is the next generation of smart trading systems.This is an article about the system.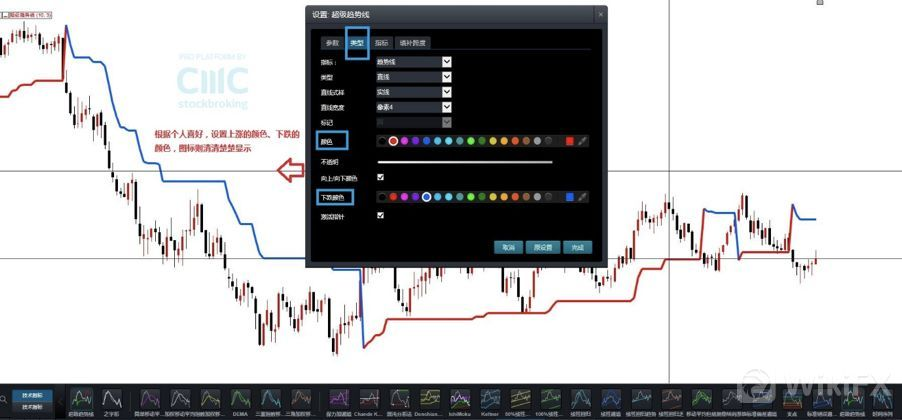
In the new generation of smart trading systems in CMC Markets, it is possible to select the "super trend line" in the technical indicator and use the "super trend line" tuning. As shown in the figure, the upward and downward signals can be adjusted according to their preferences. Before understanding the formula of the hypertrend indicator, it is necessary to understand the ATR, because the hypertrend uses the ATR value to calculate the indicator value.
The main algorithms are shown in the diagram below.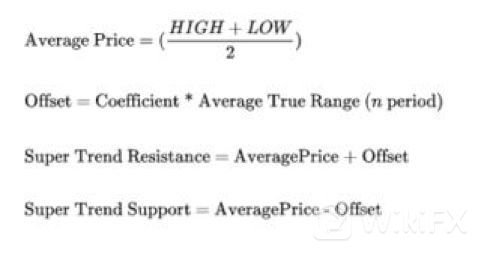
In general, the main description is HL2 (k-line average price) times n times ATR; the channel is a trend break.
But the article is relatively simple. There are no detailed algorithms. Then I thought of the coolest community, Tradingview.
It's not surprising.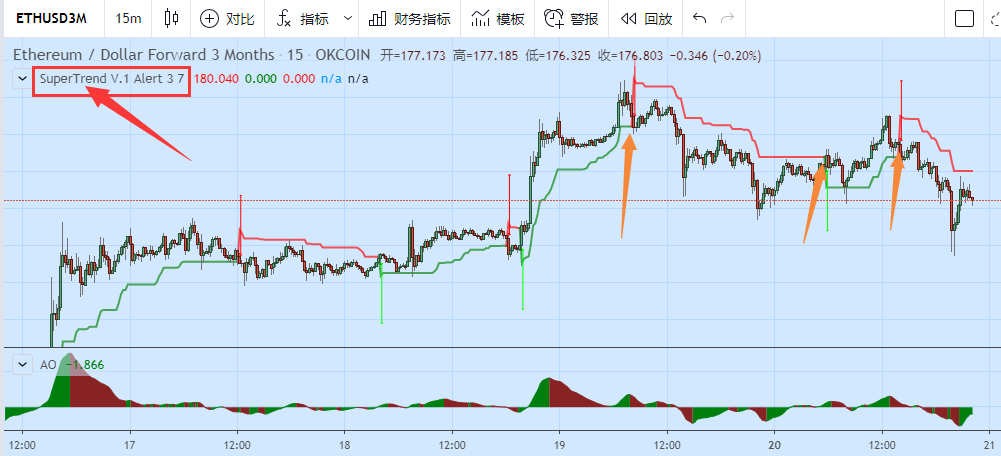
It looks like it's more in line with the trend. Unfortunately, it's just an Alert warning signal.
Third, learn the source code.
If the code isn't too long, let's try translating it.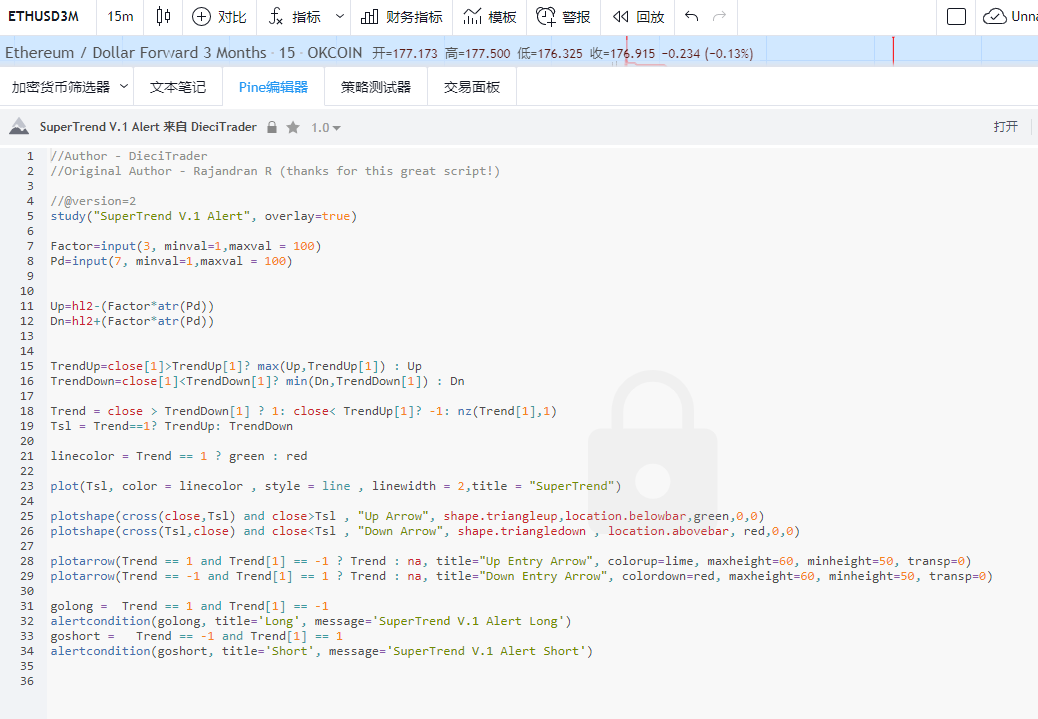 The full pine code is shown above.
Four, code conversion
Here at FMZ, we've created a new strategy called SuperTrade.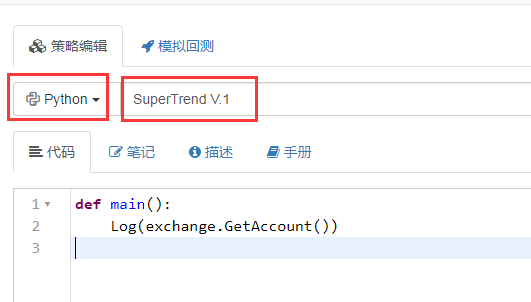
And then we're going to set two parameters, factor, pd.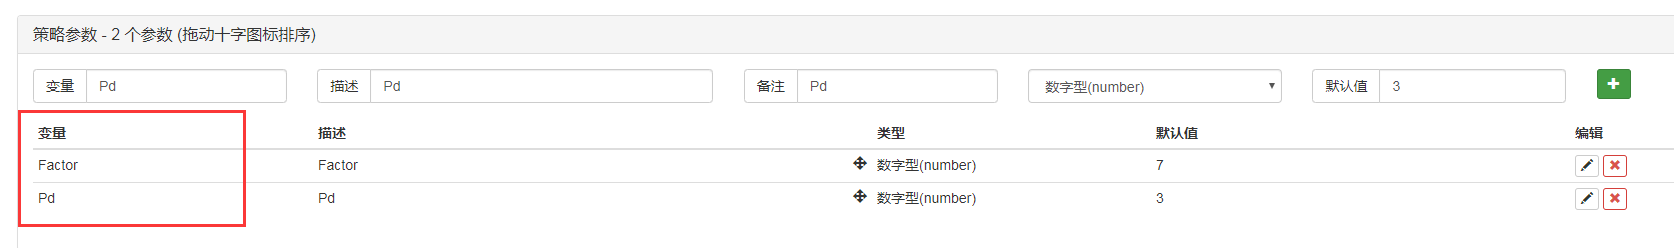
In order to make the code easier to understand and easier to use, we use Python's Advanced Data Extension Pack.pandas
At lunchtime I asked the teacher if FMZ supports this library. The dream teacher is really cool.
1.我们要导入pandas库time库 2.在main函数当中设置使用季度合约(主要跑okex) 3. Set a cycle of doTicker for 15 minutes to detect 1 time.Run the code in 15-minute cycles. Then we write the main strategy in doTicker ().
import pandas as pd
import time

def main():
    exchange.SetContractType("quarter")
    preTime = 0
    Log(exchange.GetAccount())
    while True:
        records = exchange.GetRecords(PERIOD_M15)
        if records and records[-2].Time > preTime:
            preTime = records[-2].Time
            doTicker(records[:-1])
        Sleep(1000 *60)
We're going to take the OHCLV of the k-line, so we're going to use GetRecords.
5. We're going to import the data that we retrieved into pandas M15 = pd.DataFrame (records)
6. We want to change the head tag of the table. M15.columns = [
def doTicker(records):
    M15 = pd.DataFrame(records)
    M15.columns = ['time','open','high','low','close','volume','OpenInterest']
7. Add a row to the data set, hl2 hl2= ((high+low) /2)
#HL2
M15['hl2']=(M15['high']+M15['low'])/2
8.接着我们来计算ATRSince ATR calculates to import a variable length, it takes the value Pd
The next step in the algorithm is to look at the manual of the language and find the mean of the true ATR oscillations: TR: MAX ((MAX (((HIGH-LOW), ABS ((REF ((CLOSE, 1) -HIGH)), ABS ((REF ((CLOSE, 1) -LOW)), and also known as ABS ((REF)) ATR: RMA (TR,N)
The TR value is the largest of the three deviations below. 1, the range between the highest and lowest prices of the current trading day HIGH-LOW 2⁄ The range between the closing price of the previous trading day and the highest price of the day REF ((CLOSE, 1) -HIGH) 3⁄4, the range between the closing price of the previous trading day and the lowest price of the same trading day REF ((CLOSE, 1) -LOW) So TR: MAX ((MAX ((HIGH-LOW), ABS ((REF ((CLOSE, 1) -HIGH)), and ABS ((REF ((CLOSE, 1) -LOW));
In Python computing
M15['prev_close']=M15['close'].shift(1)
To set up a prev_close to get close on the previous row of data, move close to the right of 1 to create a new parameter.
ranges= [M15['high'] - M15['low'],M15['high']-M15['prev_close'],M15['low']-M15['prev_close']]
Then define an intermediate variable that records the array of 3 contrast values of TR.
M15['tr'] = pd.DataFrame(ranges).T.abs().max(axis=1)
We define a new column named TR in the data set, the value of TR is the largest absolute value of the intermediate variable, using the functions abs (()) and max (()).
    alpha = (1.0 / length) if length > 0 else 0.5
    M15['atr']=M15['tr'].ewm(alpha=alpha, min_periods=length).mean()
Finally, we need to calculate the value of ATR, ATR: RMA ((TR,N), which is an EMA algorithm with a fixed value variant. N is the variable we imported, where ATR's default parameter is 14. Here we imported the factor of alpha = length.
===
Then we use the EVM algorithm to calculate the ema.The full ATR calculation process is as follows:
    #ATR(PD)
    length=Pd
    M15['prev_close']=M15['close'].shift(1)
    ranges= [M15['high'] - M15['low'],M15['high']-M15['prev_close'],M15['low']-M15['prev_close']]
    M15['tr'] = pd.DataFrame(ranges).T.abs().max(axis=1)
    alpha = (1.0 / length) if length > 0 else 0.5
    M15['atr']=M15['tr'].ewm(alpha=alpha, min_periods=length).mean()
9 Start calculating Up and Dn
    M15['Up']=M15['hl2']-(Factor*M15['atr'])
    M15['Dn']=M15['hl2']+(Factor*M15['atr'])
Up=hl2 - ((Factor * atr)) Dn = hl2 + ((factor * atr)) I'm not sure it's that simple.
Below is the core code section of the TV, from 15 to 21 lines.
TrendUp=close[1]>TrendUp[1]? max(Up,TrendUp[1]) : Up
TrendDown=close[1]<TrendDown[1]? min(Dn,TrendDown[1]) : Dn

Trend = close > TrendDown[1] ? 1: close< TrendUp[1]? -1: nz(Trend[1],1)
Tsl = Trend==1? TrendUp: TrendDown

linecolor = Trend == 1 ? green : red
The main point of this paragraph is to express that the people of the country are not alone. If you are in the bullish phase, (bottom line) TrendUp = max (Up, TrendUp[1]) If it is in the downtrend phase, (upper line) TrendDown=min (Dn, TrendDown[1])In other words, in a trend, the ATR value has been using a technique similar to the robbery strategy of Brin. The other side of the tunnel is constantly narrowing.
This is where TrendUp and TrendDown need to self-repeat each time. The first step is to calculate the next step for yourself. So we have to do a looping over the data set.
Here, you need to create new fields for the data set TrendUp, TrendDown, Trend, linecolor and give them an initial value. Then use the fillna ((0) syntax to fill in the data with the empty value from the previously calculated result to 0.
    M15['TrendUp']=0.0
    M15['TrendDown']=0.0
    M15['Trend']=1
    M15['Tsl']=0.0
    M15['linecolor']='Homily'
    M15 = M15.fillna(0)
Enable a for loop Use Python third-party operations in the loop
for x in range(len(M15)):
Calculating the TrendUpTrendUp = MAX ((Up,TrendUp[-1]) if close[-1]>TrendUp[-1] else Up Roughly speaking, if the last close> last TrendUp, set the largest value of the takeUp and the last TrendUp, the takeUp value is not set and is passed to the current TrendUp.
M15['TrendUp'].values[x] = max(M15['Up'].values[x],M15['TrendUp'].values[x-1]) if (M15['close'].values[x-1]>M15['TrendUp'].values[x-1]) else M15['Up'].values[x]
So the same thing happens when you calculate the trenddown.TrendDown=min ((Dn, TrendDown[-1]) if close[-1]
M15['TrendDown'].values[x] = min(M15['Dn'].values[x],M15['TrendDown'].values[x-1]) if (M15['close'].values[x-1]<M15['TrendDown'].values[x-1]) else M15['Dn'].values[x]
Below is the flag for calculating the direction of control, and I simplified the pseudo code. Trend= 1 if (close > TrendDown[-1]) else (x) x = -1 if (close< TrendUp[-1]) else Trend[-1]
This means that if the closing price > the last TrendDown, take 1 (read more) not take x. If the closing price is < the last TrendUp, take −1 (blank) not set, take a Trend (meaning unchanged) Translating into visual language is breaking up the track conversion flag read more, breaking down the track conversion flag look away, the rest of the time does not change.
M15['Tsl'].values[x] = M15['TrendUp'].values[x] if (M15['Trend'].values[x]==1) else M15['TrendDown'].values[x]
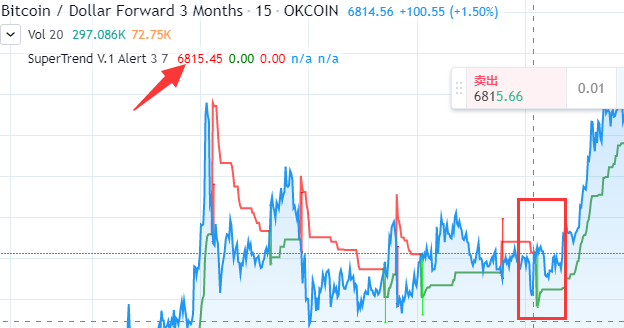
Calculate Tsl and LinecolorTsl = rendUp if (Trend==1) else TrendDown
Tsl is used to represent the value of SuperTrend on an image. It means that the chart is marked down when viewed more, and up when viewed less.
linecolor=
        M15['Tsl'].values[x] = M15['TrendUp'].values[x] if  (M15['Trend'].values[x]==1) else M15['TrendDown'].values[x]
        M15['linecolor'].values[x]= 'green' if ( M15['Trend'].values[x]==1) else  'red'
The next 23-30 lines of code are mainly plot drawings.
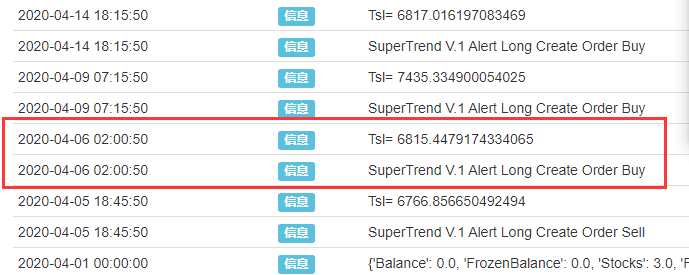
Finally, there are two lines of code for buying and selling signal control.In Tradingview, his meaning is to give a signal after reversing the flag. Convert conditional statements to python. If the last trend flag went from -1 to 1, it means breaking through the upper resistance. If the last trend flag goes from 1 to -1, it represents a breakout.
    if(M15['Trend'].values[-1] == 1 and M15['Trend'].values[-2] == -1):
        Log('SuperTrend V.1 Alert Long',"Create Order Buy)
    if(M15['Trend'].values[-1] == -1 and M15['Trend'].values[-2] == 1):
        Log('SuperTrend V.1 Alert Long',"Create Order Sell)
The full code for this section is as follows:
    M15['TrendUp']=0.0
    M15['TrendDown']=0.0
    M15['Trend']=1
    M15['Tsl']=0.0
    M15['linecolor']='Homily'
    M15 = M15.fillna(0)

    for x in range(len(M15)):
        M15['TrendUp'].values[x] = max(M15['Up'].values[x],M15['TrendUp'].values[x-1]) if (M15['close'].values[x-1]>M15['TrendUp'].values[x-1]) else M15['Up'].values[x]
        M15['TrendDown'].values[x] = min(M15['Dn'].values[x],M15['TrendDown'].values[x-1]) if (M15['close'].values[x-1]<M15['TrendDown'].values[x-1]) else M15['Dn'].values[x]
        M15['Trend'].values[x] = 1 if (M15['close'].values[x] > M15['TrendDown'].values[x-1]) else ( -1 if (M15['close'].values[x]< M15['TrendUp'].values[x-1])else M15['Trend'].values[x-1] )
        M15['Tsl'].values[x] = M15['TrendUp'].values[x] if  (M15['Trend'].values[x]==1) else M15['TrendDown'].values[x]
        M15['linecolor'].values[x]= 'green' if ( M15['Trend'].values[x]==1) else  'red'

    if(M15['Trend'].values[-1] == 1 and M15['Trend'].values[-2] == -1):
        Log('SuperTrend V.1 Alert Long',"Create Order Buy)
        Log('Tsl=',Tsl)
    if(M15['Trend'].values[-1] == -1 and M15['Trend'].values[-2] == 1):
        Log('SuperTrend V.1 Alert Long',"Create Order Sell)
        Log('Tsl=',Tsl)
Five, all the code
I've adjusted the overall code structure. In addition, it will incorporate more job-related sub-orders into the strategy. Below is the full code.
'''backtest
start: 2019-05-01 00:00:00
end: 2020-04-21 00:00:00
period: 15m
exchanges: [{"eid":"Futures_OKCoin","currency":"BTC_USD"}]
'''

import pandas as pd
import time

def main():
    exchange.SetContractType("quarter")
    preTime = 0
    Log(exchange.GetAccount())
    while True:
        records = exchange.GetRecords(PERIOD_M15)
        if records and records[-2].Time > preTime:
            preTime = records[-2].Time
            doTicker(records[:-1])
        Sleep(1000 *60)


def doTicker(records):
    #Log('onTick',exchange.GetTicker())
    M15 = pd.DataFrame(records)

    #Factor=3
    #Pd=7

    M15.columns = ['time','open','high','low','close','volume','OpenInterest']

    #HL2
    M15['hl2']=(M15['high']+M15['low'])/2

    #ATR(PD)
    length=Pd
    M15['prev_close']=M15['close'].shift(1)
    ranges= [M15['high'] - M15['low'],M15['high']-M15['prev_close'],M15['low']-M15['prev_close']]
    M15['tr'] = pd.DataFrame(ranges).T.abs().max(axis=1)
    alpha = (1.0 / length) if length > 0 else 0.5
    M15['atr']=M15['tr'].ewm(alpha=alpha, min_periods=length).mean()


    M15['Up']=M15['hl2']-(Factor*M15['atr'])
    M15['Dn']=M15['hl2']+(Factor*M15['atr'])

    M15['TrendUp']=0.0
    M15['TrendDown']=0.0
    M15['Trend']=1
    M15['Tsl']=0.0
    M15['linecolor']='Homily'
    M15 = M15.fillna(0)

    for x in range(len(M15)):
        M15['TrendUp'].values[x] = max(M15['Up'].values[x],M15['TrendUp'].values[x-1]) if (M15['close'].values[x-1]>M15['TrendUp'].values[x-1]) else M15['Up'].values[x]
        M15['TrendDown'].values[x] = min(M15['Dn'].values[x],M15['TrendDown'].values[x-1]) if (M15['close'].values[x-1]<M15['TrendDown'].values[x-1]) else M15['Dn'].values[x]
        M15['Trend'].values[x] = 1 if (M15['close'].values[x] > M15['TrendDown'].values[x-1]) else ( -1 if (M15['close'].values[x]< M15['TrendUp'].values[x-1])else M15['Trend'].values[x-1] )
        M15['Tsl'].values[x] = M15['TrendUp'].values[x] if  (M15['Trend'].values[x]==1) else M15['TrendDown'].values[x]
        M15['linecolor'].values[x]= 'Long' if ( M15['Trend'].values[x]==1) else  'Short'


    linecolor=M15['linecolor'].values[-2]
    close=M15['close'].values[-2]
    Tsl=M15['Tsl'].values[-2]


    if(M15['Trend'].values[-1] == 1 and M15['Trend'].values[-2] == -1):

        Log('SuperTrend V.1 Alert Long','Create Order Buy')
        Log('Tsl=',Tsl)
        position = exchange.GetPosition()
        if len(position) > 0:
            Amount=position[0]["Amount"]
            exchange.SetDirection("closesell")
            exchange.Buy(_C(exchange.GetTicker).Sell*1.01, Amount);

        exchange.SetDirection("buy")
        exchange.Buy(_C(exchange.GetTicker).Sell*1.01, vol);

    if(M15['Trend'].values[-1] == -1 and M15['Trend'].values[-2] == 1):
        Log('SuperTrend V.1 Alert Long','Create Order Sell')
        Log('Tsl=',Tsl)
        position = exchange.GetPosition()
        if len(position) > 0:
            Amount=position[0]["Amount"]
            exchange.SetDirection("closebuy")
            exchange.Sell(_C(exchange.GetTicker).Buy*0.99,Amount);
        exchange.SetDirection("sell")
        exchange.Sell(_C(exchange.GetTicker).Buy*0.99, vol*2);
The public policy link https://www.fmz.com/strategy/200625
Six, review and summary
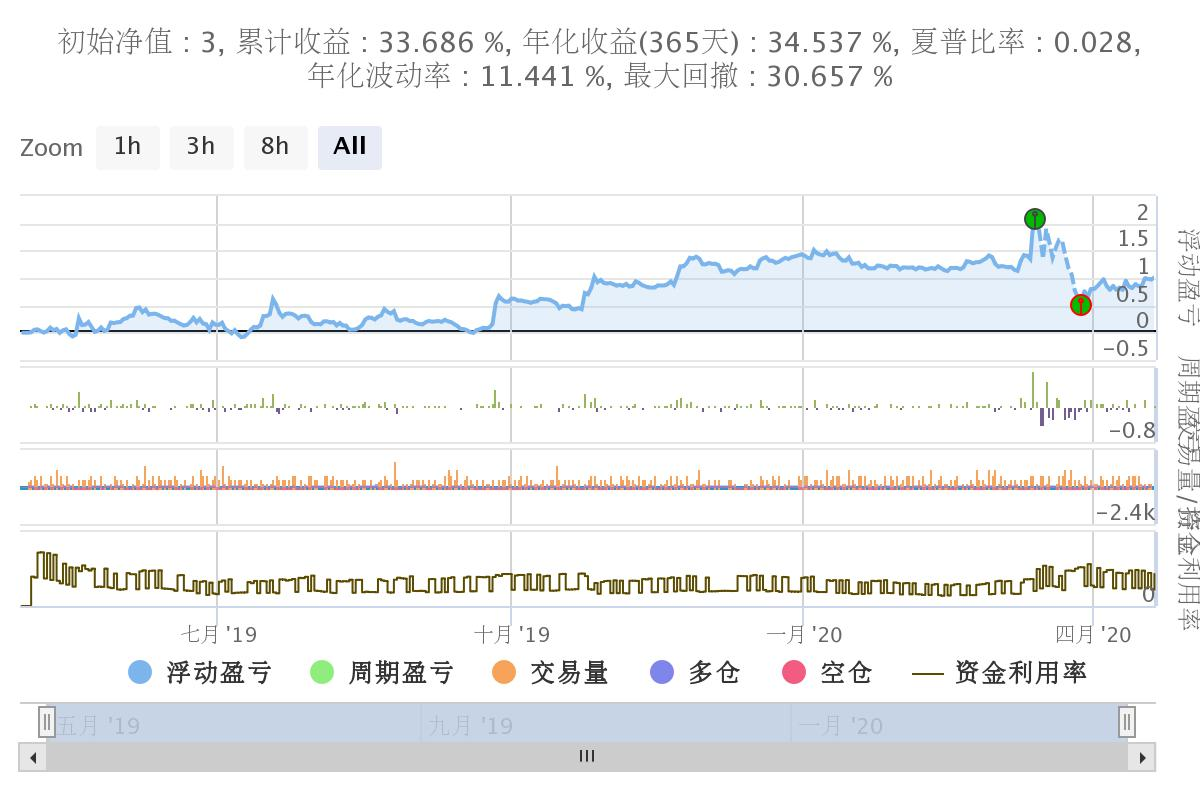
We selected data from almost a year ago for a retest. Use the okx quarterly contract for a 15-minute cycle. The parameters set are: The factor is 3. Pd is equal to 45. Vol = 100 (one hundred copies ordered at a time) The annual income is about 33%. In general, the withdrawal is not very big. The biggest shock to the system was the 312 crash, which caused a huge amount of damage to the system. If 312 is not there, the earnings should be better.
Six, written at the end.
SuperTrend is a very good trading system.
The main principle of the SuperTrend system is the use of the ATR channel breakout strategy (similar to the Kent channel) But the change is mainly due to the use of the narrowing strategy of the robber brine, or the inverse Dongjian principle. In addition, the number of people in the city has been increasing. To achieve a channel break turn operation.
I've plotted up dn TrendUp TrendDn separately in TradingView.
This makes it easier to understand the strategy.It's clear.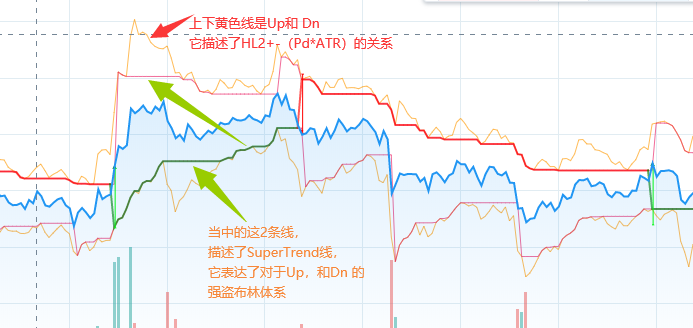
There's also a version of js on github. I don't know much about js, but there seems to be a bit of a problem from the if statement. The address ishttps://github.com/Dodo33/gekko-supertrend-strategy/blob/master/Supertrend.js
Finally I went to look up the original text. It was published on 29.05.2013. Written by Rajandran R C++ code published on Mt4 forumhttps://www.mql5.com/en/code/viewcode/10851/128437/Non_Repainting_SuperTrend.mq4I've got a rough understanding of C++ and a chance to rewrite one more.
I hope you all can learn from the essence of it. It's not easy.
- Quantifying Fundamental Analysis in the Cryptocurrency Market: Let Data Speak for Itself!
- Quantified research on the basics of coin circles - stop believing in all kinds of crazy professors, data is objective!
- The inventor of the Quantitative Data Exploration Module, an essential tool in the field of quantitative trading.
- Mastering Everything - Introduction to FMZ New Version of Trading Terminal (with TRB Arbitrage Source Code)
- Get all the details about the new FMZ trading terminal (with the TRB suite source code)
- FMZ Quant: An Analysis of Common Requirements Design Examples in the Cryptocurrency Market (II)
- How to Exploit Brainless Selling Bots with a High-Frequency Strategy in 80 Lines of Code
- FMZ quantification: common demands on the cryptocurrency market design example analysis (II)
- How to exploit brainless robots for sale with high-frequency strategies of 80 lines of code
- FMZ Quant: An Analysis of Common Requirements Design Examples in the Cryptocurrency Market (I)
- FMZ quantification: common demands of the cryptocurrency market design instance analysis (1)
zdg4484 YYDS!
lglydz2010If you use this strategy directly on the OK exchange, how do you need to connect to the exchange, little white one will not be Python, it looks confusing.
bamsmenThere is a lot of room for adjustment here if the 312 wave is not eating the market, because the supertrend is mainly to grab the trend list, 312 is not to be missed.
Chang is unyielding.Unfortunately, all the cycles and parameters are not very good, and I don't know how others can optimize.
Wood is fat.Yes, I did, thank you for your contribution.
Wood is fat.If you can't use it, show this:Traceback (most recent call last): File "
xunfeng91The translator of pine, waiting
tiemuerThe only thing the culture can say is "Bullshit!"
frank131419I guess I'll write a translator for a pine someday. Everything works in python.
KmeansI want to implement a replay and then use svm to find the best parameters.
dsaidasiThis system seems to have been a top ten futures strategy in terms of yields.
Light cloudsHello, please, PD is the length of ATR, right?
The Little DreamThank you.
ovelsPine really doesn't understand much, and there are few tutorials.
homilyThis means that the panda package is missing, so your system may need to install panda on pip.
Ant_SkyHow did you handle this? Thank you very much.
homilyHa ha, thank you boss.
The Little DreamA moment, open up.
lonelymanPlease, please, please, please!
homilyI'm not going to go into detail.
Light cloudsGood, thank you! I've also removed mq4, thank you very much.
homilyYes, that's exactly right.
homilyGlory be to Him!
The Little DreamI happen to have written a JS version too.
homilyThank you, Drumdrum teacher.