GARCH-QR nonlinear regression (GQNR) trading model
Author: 🏆Benson, Created: 2021-04-21 00:30:43, Updated: 2022-09-06 20:27:27Copyright statement: If you wish to copy the code of this article, please indicate the source, if for commercial use, please write a private letter or contact the author at 940648114@gmail.comqq.com
First, the preface
The advantages of quantitative trading
Quantitative trading refers to subjective judgments that are replaced by advanced mathematical models, using computer technology to develop strategies for multiple highly probable events that can yield excessive returns from a large amount of historical data, greatly reducing the impact of investor sentiment fluctuations and avoiding irrational investment decisions in extreme market frenzy or pessimism. Due to the continuity of the 24-hour 24/7 trading market, and the fact that quantitative trading can achieve the effect of high-frequency trading, starting from the digital currency market is obviously a good starting point for quantification. Currently, the digital currency market is still immature. The platform trading system has its hiccups, k-line plugs still occasionally appear, which is also a risk for quantitative trading.
The GQNR model is introduced
This model is based on the Garch model of predicting volatility, using the VaR value of the predicted volatility by regression to the decimal point and then using nonlinear regression, such as GA to fit to predict the upper limit VaR and lower limit VaR in the next cycle in the future.
1.Garch模块
This section will detail the derivation of the core of the strategy Garch, which has a certain universality in the financial markets and can achieve certain predictive effects on digital currencies.
1.1 Garch defined
The essence of the ARCH model is to use the q-step movable plane to fit the current differential function value of the residual square sequence. Since the moving average model has a q-step termination of the independent coefficients, the ARCH model is actually only applicable to the short independent coefficients of the independent coefficients. In practice, however, some residual sequences have long-term eigenvalues, and the use of ARCH models to fit the differential will result in high moving average scales, increasing the difficulty of parameter estimation and ultimately affecting the fit accuracy of the ARCH model. In order to correct the problem, a generalized regression condition differential model, abbreviated as GARCH ((p,q), was proposed. The GARCH model is actually based on the ARCH model, which is formed by increasing the regression of the p-step of the differential function, which can be effectively integrated with long-term memorable differential functions. The ARCH model is a special case of the GARCH model, the GARCH ((p,q)) model of p = 0.
1.2 ARCH process
Definition σn is the estimate of the volatility of the asset in the nth trading cycle for the n-1 trading cycle, mu is the daily rate of return, then the unbiased estimate can be made based on the rate of return for the most recent m trading cycles: $$ What is it?n^2= \frac{1}{m-1} \sum\limits{i=1}^m {({ \mu_{n-i}- \overline{\mu} }) ^2}, which is a linear combination of $$ The following changes 1 convert μn-i to a percentage yield; 2 convert m-1 to m; 3 assume μ=0, and these changes have little effect on the result, and the volatility can be simplified to: $$ What is it?n^2= \frac{1}{m} \sum\limitsSo we have {i=1}^m { \mu_{n-i}^2}, $$ That is, the square of the rate of fluctuation for each cycle has an equal weight of 1/m. Since it is estimated that the current rate of fluctuation should be given a higher weight, the above formula can be changed to: $$ What is it?n^2= \sum\limitsAnd then we have the same number of digits. $$ αi is the coefficient of the yield squared of the first trading cycle i, the positive value and the smaller the i value, the greater the weighted sum is 1; further generalized, assuming a long-term differential VL, with a corresponding weight of γ, according to the above formula can be obtained:
$$ \begin{cases}\sigma n^2= \gamma V{L}+\sum\limits_{i=1}^m { \alpha_i\mu_{n-i} ^2}\ &\ \gamma+\sum\limits_{i=1}^m{\alpha_i\mu_{n-i}^2}=1 & \end{cases}, which is the sum of the following: $$ The formula ((15) can be written as: $$ What is it?n^2= \omega+\sum\limitsAnd then we have the same number of digits. $$ Based on the above formula we can get the common ARCH ((1) process $$ What is it?n^2= \omega+{ \alpha\mu{n-1} ^2}, $$
1.3 The GARCH process
The GARCH ((p,q) model is a combination of the ARCH§ and EWMA ((q)) models, meaning that the volatility is related not only to the earnings of the previous p-period, but also to the previous q-period itself, expressed as: $$ What is it?n^2= \omega+\sum\limits{i=1}^m { \alpha_i\mu_{n-i} ^2}+\sum\limits_{i=1}^m { \beta_i\sigma_{n-i} ^2}, which is the limit of the sum of the $$ Based on the above formula we can get the common GARCH ((1,1)): $$ It's the first time I've seen this.n^2= \omega+{ \alpha\mu{n-1} ^2+\beta\sigma_{n-1}^2}\&\ \qquad\alpha+\beta+\gamma=1 & \end{cases} , $$
2 QR modules
This section will discuss the basic regression of fractions and describe the importance of strategic fractions.
2.1 QR definitions
The regression of regression is a modeling method for estimating the linear relationship between a set of regression variables X and the regression of the interpreted variable Y. The previous regression model was actually a conditional expectation for the study of the interpreted variable. It was first proposed by Koenker and Bassett (1978). The calculation of the OLS regression estimate is based on the minimization of residual squares. The calculation of the regression estimate is also based on an asymmetrical form of absolute residual minimization.
2.2 From OLS to QR
The general method of regression is the minimum binomial, i.e. the sum of the squares of the minimum errors: $$ So, we're going to do this as follows:So let's say that we have $$ The objective of the fraction is to minimize the absolute value of the weighted error based on the above formula and: $$ \mathop{\arg\min} is the\beta}\ \ \sum{[{\tau(y_i-X_i\beta)^++(1-\tau)(X_i\beta-y_i) ^+ }]} $$
2.2 QR visualization
And you can see that all the samples are divided into different spaces by the regression line, and this regression line becomes the segmentation line.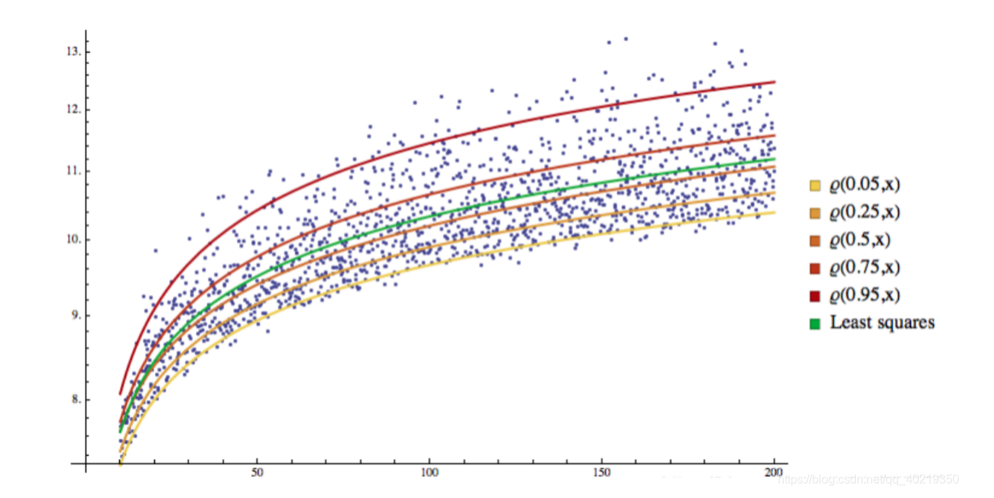
3.GARCH-QR is back
We naturally wondered if it was possible to use the unknown market volatility sigma and the fractional Q or VaR to predict the volatility threshold in the case of future probabilities.
3.1 Select the regression form of the volatility and VaR
Since the core of the strategy is involved here, I'll briefly use a form to illustrate the idea. $$ VaR=\epsilon+W^TE\E=(\zeta,\zeta^2,\zeta^3,\zeta^4) \W=(W_1,W_2,W_3,W_4) and the other two are $$
3.2 Determine the target function
Based on the above information, we can combine and get the final target function to be optimized: $$ \widehat{W}=\mathop{\arg\min_W}\ \sum{[{\alpha ((VaR_t-W^TE_t) ^++(1-\alpha) ((W^TE_t-VaR_t) ^+ }]} $$
3.3 Optimization of target functions using machine learning
This step is more selective, the traditional gradient decreases, and the algorithm can be inherited, allowing readers to experiment with their own creativity.There's something about GA addresses.
Third, how to use GQNR in quantification
1.思路的确定
The core of GQNR is the volatility of the market at the current time point in each period, which can be predicted by GARCH for the next period, and on the other hand, the upper boundary and lower boundary of the volatility threshold can be obtained by regression of the fractional fraction of the volatility predicted by the past data. These two boundaries are the core of the whole. Once the upper boundary is triggered, we can assume a short-term pullback trend under the high probability, and once the lower boundary is triggered, we can assume a short-term pullback trend under the high probability.
2.运用的难点
- Take the form of a return
- Choosing an adaptive algorithm
- The right parameters for machine learning
- The uncertainty of the market
3.解决方案
- Shortening the time cycle of strategic learning
- Reduce the long-term risk of single-deposit collateral
- Increased double-equilibrium trend co-validation and secondary threshold confirmation
- How can you use a drawing line library in your strategy?
- Please teach: Dial ((() long connection parameters, how to write the syntax?
- Is there any online training?
- Bitcoin's ept leverage product why subscription failed
- The platform is also reminding us about some of the discs.
- Binance exchanges always add password errors
- Tradingview's strategy is to alert the inventor to the robot's connection
- The number of exchanges is 1 to start (starting robot error tip)
- Binance, Bitcoin, and Token: What is the deal?
- Exchange.IO doesn't know what the problem is?
- Is it possible to debug a breakpoint when developing a strategy?
- How long does it take to learn to quantify?
- Full-time position: High frequency quantified trader HFT Quant Trader Basic salary 600,000 to 1.2 million, to be precise
- How to create a Bitcoin futures trading API
- What is the trading pair of the binary perpetual contract xrp
- Why is it that GetTicker and GetDepth get a different buy and sell price?
- Binance is going from low to close to 2s, slippage is serious, is there a way to make it work?
- How much capital does a marketing strategy need?
- My friends, who are exhausted and don't like to program, who like to study digital currencies, came to me and gave me free code and proofreading.
- The MACD deviates from the algorithm of sharing
Quantification of district classesI don't feel the need to join GARCH, but if this strategy works, then it's possible to do regression with the fractional fraction of the current volatility, so why predict the next one?
🏆BensonIf you take the current oscillation rate at a data point, what is the regression, if you take the historical data point together, it can only do OLS, it can't do decimal regression.