Inventors introduce quantitative trading - from the basics to the real world.
Author: Goodness, Created: 2019-06-25 15:48:58, Updated: 2023-10-31 21:01:08The meaning of human speech. After a long time of meditation and self-learning, we have learned to speak unconsciously and also understand the meaning of other children's speech. There are many languages, including Chinese, English, French, etc. Chinese: Hello world English: Hello World French: Bonjour tout le monde
If you use a programming language to display "Hello World" on a computer screen, it looks like this: C language: puts (hello world, hello world); In the Java language: System.out.println ((Hi world, hello world); Python language: print ((Hi world and hello to you)) You can see that computer languages have their own specific rules, and there are many more languages, and these language rules are the categories of programming languages that we need to explain to you today, in each category we only need to remember the most basic common rules to be able to use these programming languages and computer communication, so that the computer runs according to our instructions.
Classification of programming languages
To make it easier for you to compare and choose the right programming language for your quantitative transaction, we'll make a classification of the six most commonly used programming languages: Python, Matlab/R, C++, Java/C#, EasyLanguage, and Visualization (see figure below).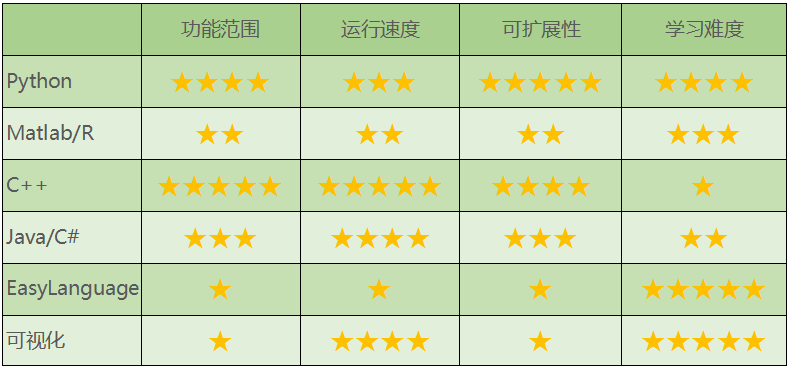 Figure 3-1 Evaluation of the programming language
We rate them according to their range of functionality, speed, scalability, and learning difficulty. Scores between 1 and 5, such as a score of 5 in the range of functionality, mean powerful functionality, and 1 point means fewer functionality. Visual languages and EasyLanguage are easy to learn and very suitable for beginners.
But for each programming language, the evaluation is mainly for applications in the field of quantitative trading, and has individual subjective components. You are welcome to applaud in the comments section afterwards, or to present your point of view.
Visualized language
Visual programming has been around for a long time and is not a new thing. The idea of visualization is that it is a simple programming idea that contains a variety of control modules that can be used to construct code logic, complete transaction strategy design, and the process is very similar to building blocks.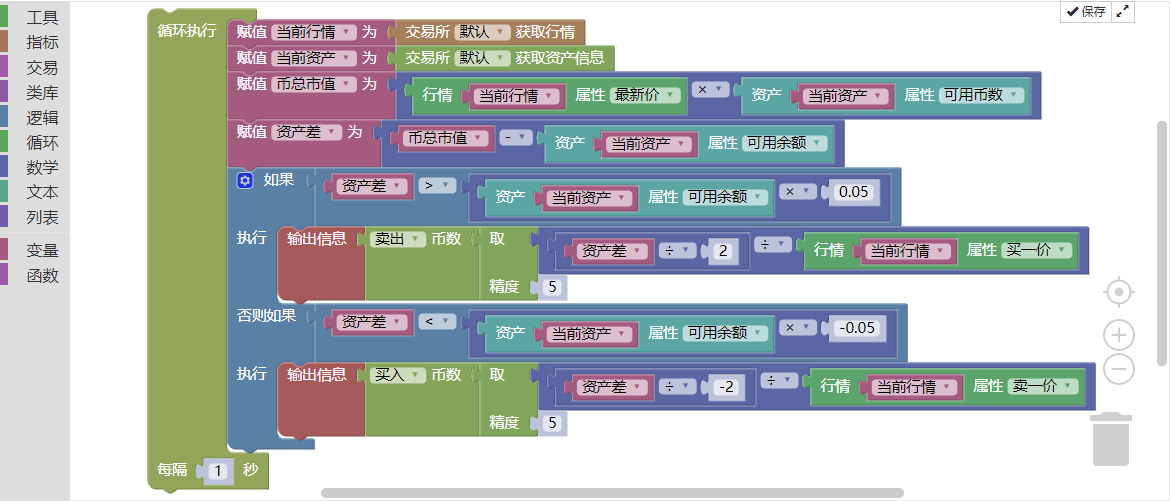 Figure 3-2 Visualized programming language interface
As shown above, the same procedure, in the inventor's quantitative trading platform visualization programming, requires only a few lines of code. This greatly reduces the programming threshold, especially for traders who do not understand programming at all, which is a great operating experience.
Since the underlying implementation policy of this visualization language is translated to C++, it has little impact on the speed of the program; however, the functionality and scalability are weak and it is not possible to develop too complex, too detailed trading strategies.
Easy Language
The so-called EasyLanguage language refers to a programming language that is unique to some commercial quantitative trading software. Although these languages also have some object-oriented features, they are mainly used in scripting applications. On the syntax, it is also very close to our natural language, and for quantitative trading beginners, using EasyLanguage as an introduction is a better option.
The scripting language has no problems with doing policy retrieval and disk in its specific software, but is often limited in terms of scalability, such as policy developers cannot call external APIs. And in terms of running speed, the scripting language runs on its own virtual machine, performance optimization is less than Java/C#, and the speed is slower.
Python
On Stackoverflow, the number of mainstream programming languages has not changed much in recent years, with only Python showing an upward trend. Python is used for website development, machine learning, deep learning, data analysis, etc. It has become the most common language due to its flexibility and openness.
The list of basic data structures and dictionaries in Python are very powerful and can basically meet the needs of data representation. If you need a faster, more functional and comprehensive data structure, it is recommended to use NumPy and SciPy, which are basically the standard libraries for Python scientific computation.
For financial engineering, a more targeted library is Pandas, which has two data structures, Series and DataFrame, and is well suited to processing time sequences.
In terms of speed, Python is in the middle of the spectrum, slightly slower than C++ and faster than EasyLanguage, mainly because Python is a dynamic language and is generally faster when running in pure Python.
Python is the first language in terms of scalability, not only because of its extensive interfacing with other languages, but also because of its easy-to-use API design. In terms of learning difficulty, Python's grammar is simple, code readability is high, and it is easy to get started.
Matlab/R
Matlab and R, which are primarily geared toward data analysis, are syntactically designed for scientific computation and are characterized by their native support for quantitative transactional operations. However, their applications are relatively limited and are generally used for data analysis and strategy feedback.
Additionally, they are relatively slow to run and scalable because Matlab and R run on their own language virtual machines. In terms of performance, their virtual machines are much worse than Java and C#. However, they are relatively easy to learn because their syntax is closer to mathematical expressions.
C++
C++ is a general-purpose programming language that supports multiple programming patterns, such as procedural programming, data abstraction, object-oriented programming, generic programming, and design patterns. C++ can perform all the functions you want, but the biggest disadvantage of such a powerful language is that it is very difficult to learn, such as templates, pointers, memory leaks, etc.
Currently, C++ remains the preferred programming language for high-capacity, high-frequency transactions, for a simple reason: the features of the C++ language are closer to the bottom of the computer and are the most effective tools for developing high-performance feedback and execution systems that handle large amounts of data.
Java/C#
Java/C# are both static languages that run on a virtual machine, with no array crossings, no coredumps, throwing out exceptionally accurate positions to erroneous code, automatic garbage retrieval mechanisms, no worry about memory leaks, etc. Compared to C++, Java/C# is a static language. So they are also easier to learn than C++ in terms of grammatical difficulty.
However, in terms of functionality, it is not possible to optimize the underlying transactional system like C++. In terms of performance, it is somewhat weaker than C++, because they need to be extended through the C bridge, and the two languages themselves run on a virtual machine, so it takes more to cross a wall when extending a function module.
Summary
However, in return, the quantified programming language is not important, the important thing is the idea. The inventor of the quantified Macs language and visualization language as a knock on the door of quantitative introduction is absolutely no problem, the improvement after the introduction is the need to constantly combine different market conditions to try and explore, it can be said that the thought determines the way out, the eyes determine the boundary.
You design your strategy, you trade your ideas. From this point of view, the core of quantitative trading is still trading ideas. As a quantitative trader, you need to master not only the basic grammar and functions of the strategy writing platform, but also to realize the trading concept in real life.
After-school homework
1.What are the advantages of Python as a quantitative transaction? 2) Try to write a few common APIs in the inventor's Mac language?
The next section
Believing that with the above introduction to programming languages, you must know how to choose, then in the next few chapters, we will develop targeted learning quantitative trading strategies according to the classification of programming languages.
3.2 Quick introduction to the Ma language
Summary
What is the Macrolanguage? The Macrolanguage is a set of programmed functions that extend from the early stock technical indicators. It encapsulates the algorithm into a single function, requiring the user to call a single line of functions like a puzzle brick puzzle, to implement strategic logic.
It uses a "small syntax, big function" construction pattern, which greatly improves writing efficiency, the strategy of more than 100 words in other languages, which can usually be written in 10 sentences in Ma. It also supports partially complex transactional logic.
The full strategy
To help you quickly understand the main points of this section, before introducing the inventors of the Quantified Mean Language, let's have a preliminary understanding of the notion of nouns in this section. We also use the long 50-day average and the short 10-day average as basic cases.
Multi-headed: If there is no position at the time, and the closing price is higher than the short-term average, and the closing price is higher than the long-term average, and the short-term average is higher than the long-term average, and the long-term average is higher.
Opening the bargain: If there is no position at the time, and the closing price is below the short-term average, and the closing price is below the long-term average, and the short-term average is below the long-term average, and the long-term average is downwards.
Multiple heads: If there are multiple orders currently held and the closing price is below the long-term average, or the short-term average is below the long-term average, or the long-term average is down.
Standing on empty: If there is a current hold on an empty order and the closing price is higher than the long-term average, or the short-term average is higher than the long-term average, or the long-term average is higher.
If it is written in Malayalam code, it looks like this: Figure 3-3 Complete example of the Ma language
To write a complete quantitative trading strategy, several steps are usually required: data acquisition, data computation, logic computation, buy-sell sub-order. As shown above, throughout the code, only one API is used to acquire the underlying data, the CLOSE tab in the first and second lines; then the data computation portion of lines 1 to 9; and finally the logical computation and sub-order portion of lines 11 to 14.
Note that the code in purple is a variable; in the first to ninth lines, the green bar: = bar is an attribute, the data on the right of the attribute is assigned to the variable on the left of the attribute after the calculation is completed; the orange code is the API, for example, in the first line, calling MA ((symmetric) requires the transmission of two parameters, the input parameters can be understood as settings, that is, the type of MA needs to be set when calling MA; the red bar is the AND bar, the OR bar is the logic operator, mainly used to connect multiple logical calculations, etc.
Basic data
The basic data (opening price, highest price, lowest price, closing price, volume) is an integral part of the quantification of transactions, and the latest basic data can be obtained in the strategy by simply calling the API of the inventor's quantification tool. If you want to obtain historical basic data, you can use the REF key, for example: REF (close, 1) is to obtain yesterday's closing price.
Variable
Variables are variable numbers, variable names can be understood as codes, and their naming supports the naming of Chinese characters, letters, numbers, and dashes, but the length needs to be controlled within 31 characters. Variable names cannot be duplicated, cannot be repeated with parameter names, cannot be repeated with function names (API), and each sentence should end in a decimal point.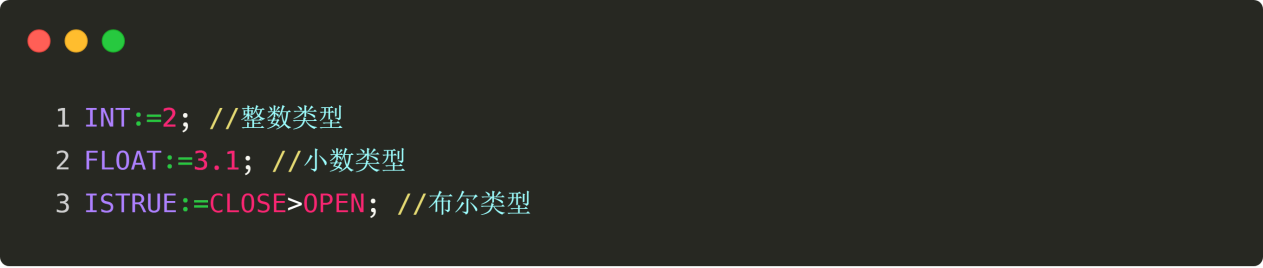 Figure 3-4 Mac language data types
Variable assignment
Variable assignment is the assignment of a value from the right to the left of a variable. There are four types of assignment, which control whether the value is displayed on the graph, as well as the location of the display. The green font in the figure below is the assigned value, respectively:  Figure 3-5 The assignment of variables in Ma
Type of data
There are many types of data types in the Malay language, the most common of which are numeric types, string types, boolean types. The numeric types are numbers, including integers, decimals, positive negative numbers, etc., such as: 1, 2, 3, 1.1234, 2.23456...; string types can be understood as letters, Chinese, English numerals.
Relational operators
Relational operators, as the name implies, are operators used to compare the relationship between two values. They are equal to, greater than, less than, greater than, less than, equal to, or not equal to, as shown below: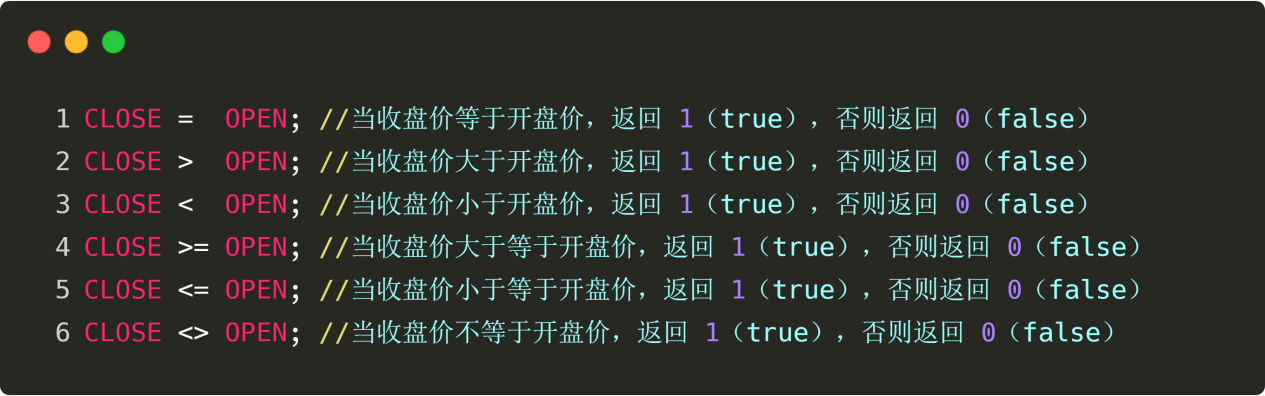 Figure 3-6. Mac language operators
Logical operators
Logical operations can connect separate Boolean statements into a whole, most commonly using 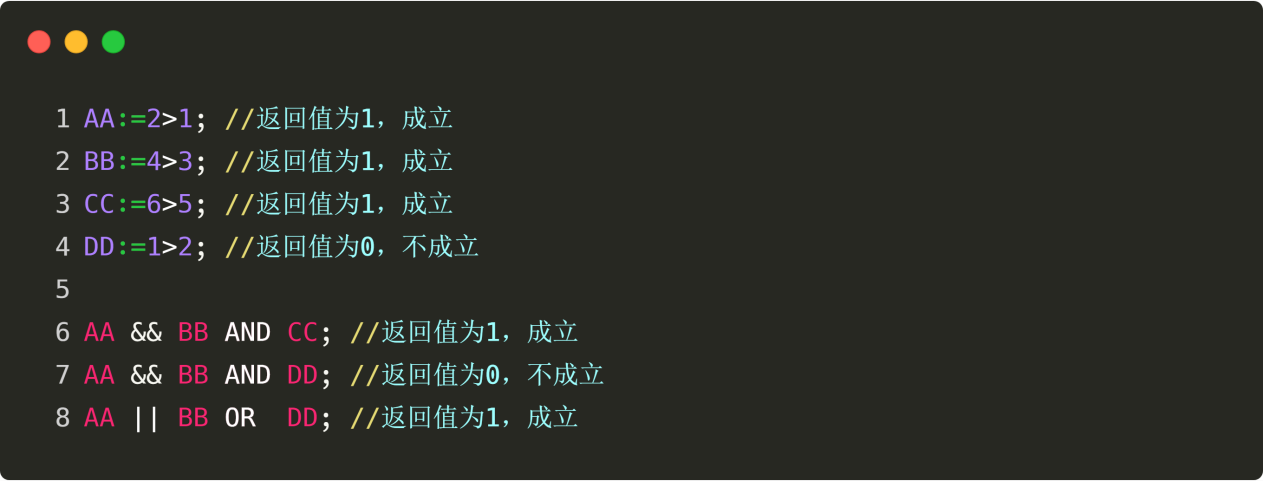 Figure 3-7 Logical operations in the Mac language
Please note:
The final condition is that all the conditions are positive, and the final condition is positive.
If any one of the conditions is true, then the final condition is true.
Arithmetic operator
There is no difference between the commonly used arithmetic operators (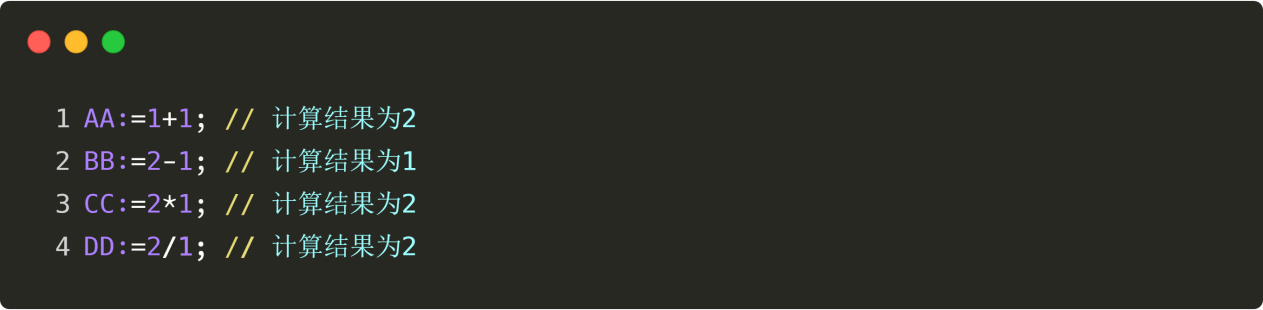 Figures 3-8 Macro-language arithmetic operations
Priorities
If there is an expression 100* ((10-1) / ((10+5)), which step of the program is the first to be computed? Secondary mathematics tells us: (1) If it is the same level of operation, it is usually done in left-to-right order. (2) If there is both addition and subtraction and multiplication, multiply first. (3) If there are parentheses, the parentheses are in parentheses. (4) If the operation law is met, the operation law can be used to reduce.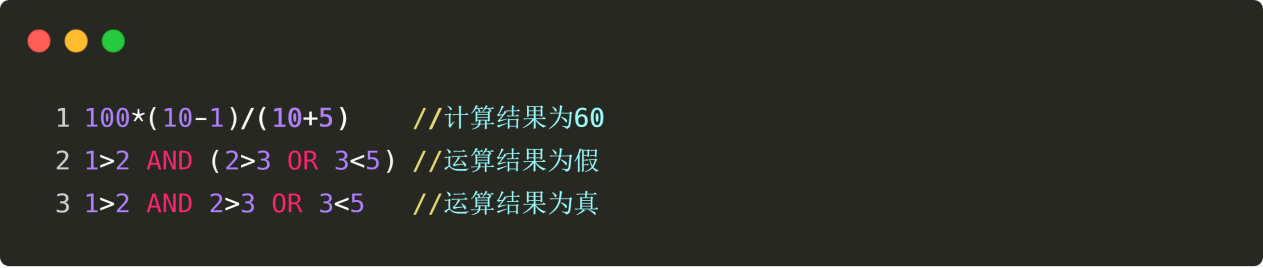 Figure 3-9 Priority of operations for Mac language operations
Execution mode
In the Mac language of the inventor's quantification tool, the programming strategy executes a total of two modes, namely: closing price mode and real-time price mode. The closing price mode refers to the current K-line signal being established, and immediately executes the order at the beginning of the lower root K-line. The real-time price mode refers to the current K-line signal being established, and immediately executes the next order.
The strategy
If it is a daytime strategy, when the tail needs to be leveled, the time-of-flight function of the TIME leverage function is used. This function is displayed in the form of four digits above the second cycle and below the day cycle, i.e.: HMMMM ((1450 leverage 14:50 points)). Note: using the TIME function as a condition for the tail's leveled position, it is recommended that the opening conditions also have a corresponding time limit.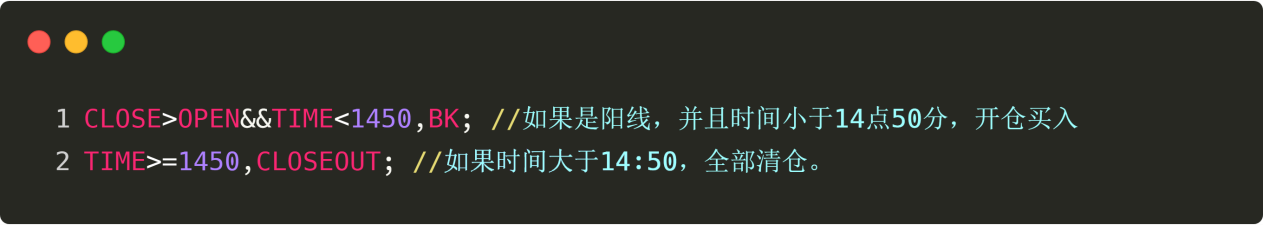 Figure 3-10 Time function in the Malay language
Classification of models
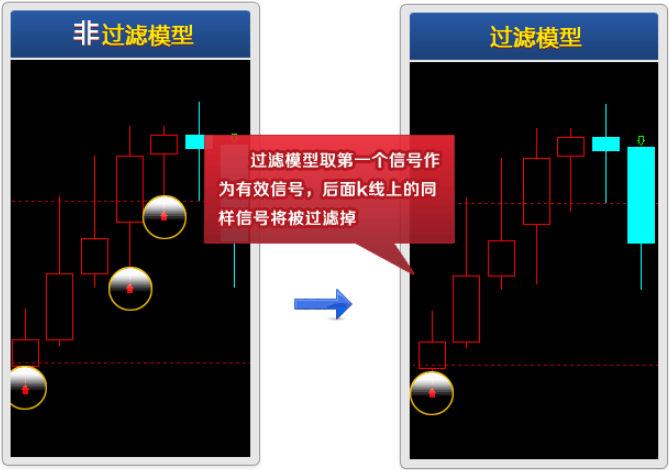 Figure 3-11 Classification of the Macan language model
There are two types of model classification in the Mac language, namely: non-filtered model and filtered model. This is actually well understood: non-filtered model allows for the continuous appearance of open signals or even signals, which can be raised and lowered. Filtered model does not allow for the continuous appearance of open signals or even signals, that is, when the open signals appear, the following open signals are filtered out until the flat signals appear, the order of the non-filtered model signals is: open-flat-open-flat-open...
Summary
This is a quick introduction to the Macanese language, and after learning it, you can program a quantitative trading strategy. If you need to write a more complex strategy, you can refer to the inventor's quantitative tool Macanese API documentation, or directly consult the official customer service representative writing a quantitative trading strategy.
The next section
Day trading is also a trading model, this way does not leave the stock overnight, so the risk of market volatility is low, and if an unfavorable market occurs, it can be adjusted in time.
After-school homework
1, try to write an API for basic data acquisition using the inventor's quantitative tools. 2, what are the common ways of displaying variable assignments in a graph?
3.3 How to implement strategies in Ma
Summary
In the previous article, we explained the prerequisites for implementing a trading strategy from the introduction of the Ma language, basic grammar, model execution methods, model classification, etc. In this article, we will continue the previous content, from commonly used strategy modules, technical indicators, step by step to help you implement a viable day-to-day quantified trading strategy.
The Strategy Module
Think about how you can put together a robot with Lego bricks. You can never put it together from top to bottom or from bottom to top, one piece at a time. A little bit of common sense people know, you should put together the head, arms, legs, wings, etc., and then put together a complete robot.
Stage increase
The phase gain is calculated as the percentage difference between the closing price of the root K line and the closing price of the previous N cycles. For example, calculate the increase of the last 10 K-line phases, using the code: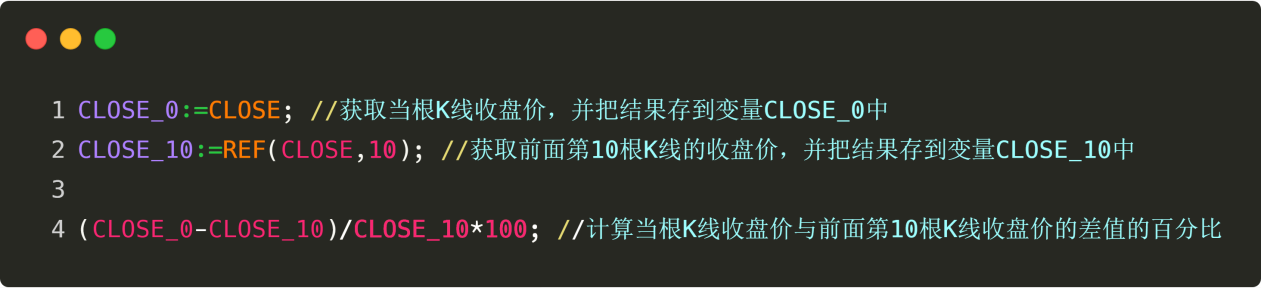 Figure 3-12 Increase in the Mayan language stage
Innovation is high
The innovation high is the highest price since N cycles when the root K line is greater than the highest price of the most recent 10 K lines. For example, the code for calculating whether the root K line is greater than the highest price of the most recent 10 K lines is: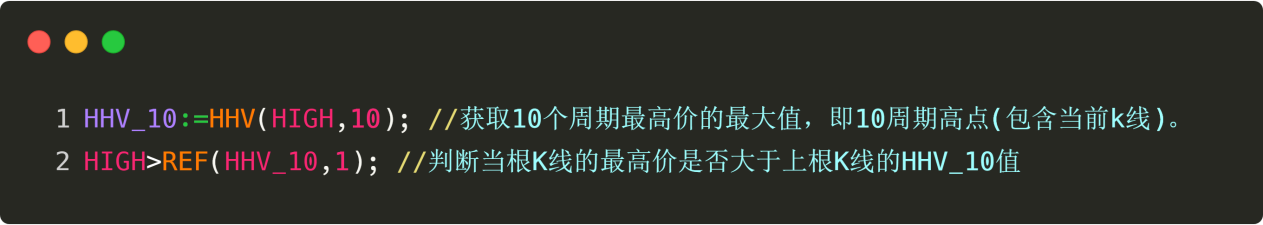 Figure 3-13 The Malay language is high in innovation
The launch is on.
A volume attack can be understood as a rise in price and a sharp increase in volume. For example, if the closing price of the root K line is 1.5 times the closing price of the previous 10th K line, that is, 50% gain within 10 days; the volume is more than 5 times the average of the last 10 K lines. The code can be written as: Figure 3-14 The Malayalam language is on the rise
Narrowly Sorted
Narrow-scale sorting refers to price stability within a certain range over a period of time. For example, if the difference between the highest price in 10 cycles and the lowest price in 10 cycles is less than or equal to 0.05 except for the closing price of the root K line, the code can be written as: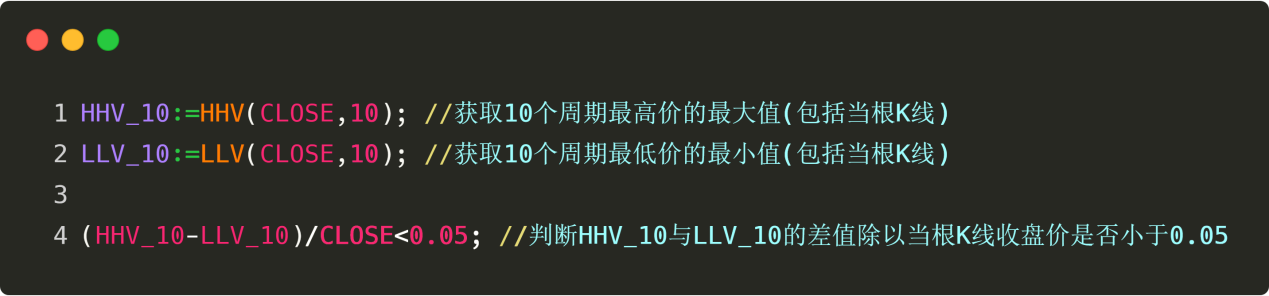 Figure 3-15 Narrowly arranged Ma
Uniform multihead array
A horizontal multiheaded array is divided into a horizontal multiheaded array and a horizontal multiheaded array, where the K-line is 5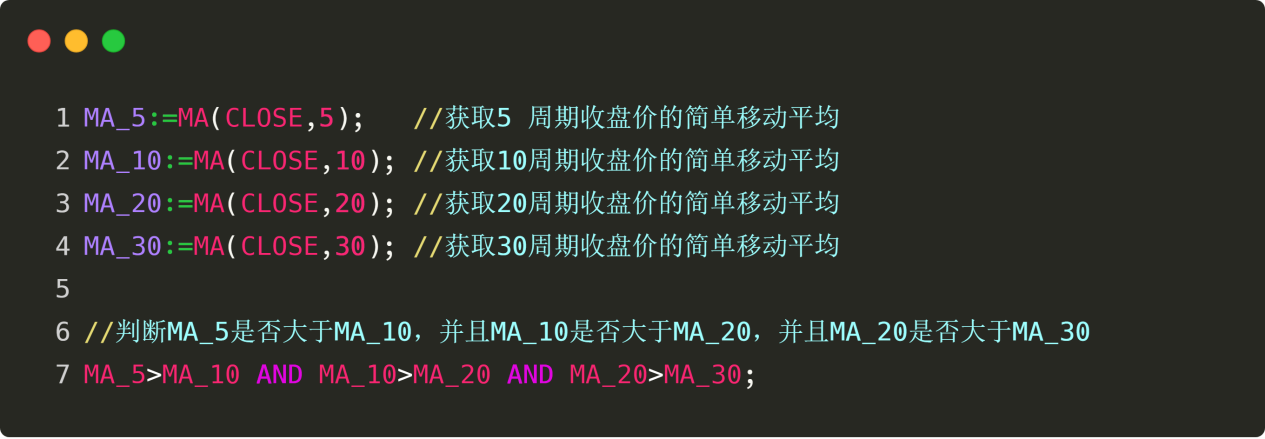 Figure 3-16 The Malayalam language has a linear polynomial
Previous high points and their location
To get the previous high point, and the location of this high point, you can directly access it through the API of the inventor's quantification tool.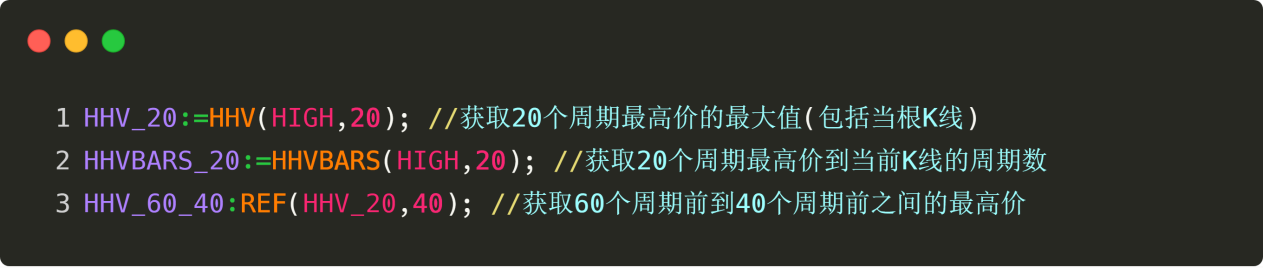 Figure 3-17 Early highs in the Ma language
Jumping the Gap
A jump gap is a situation in which the highest low of the two K-lines is unwound, consisting of two K-lines, and the jump gap is the reference price of the later support and pressure points. When a jump gap occurs, it can be assumed that an acceleration of the trend along the original jump direction has begun.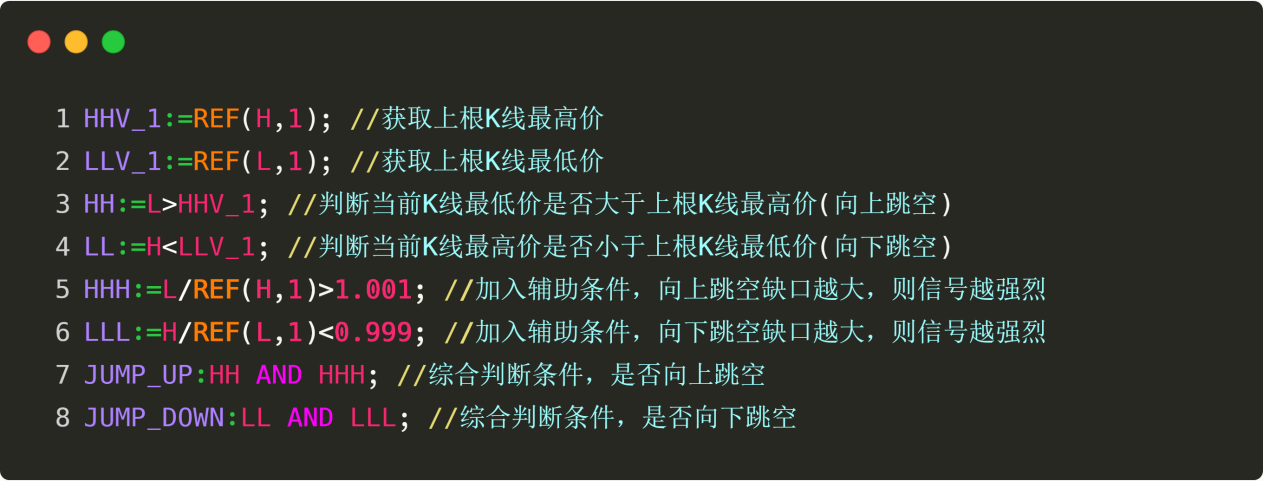 Figure 3-18 The gaps in the Malay language
Commonly used technical indicators
Moving Average
 Figure 3-19 Moving Average
From a statistical point of view, the average line is the arithmetic average of the daily price, it is a price trajectory with a trend. The average line system is a technical tool commonly used by most analysts, from a technical point of view it is a factor that affects the psychological price of the technical analyst, the decision-making factor of buying and selling, is a good reference tool for technical analysts, the inventor of the quantification tool supports many different types of average lines, as shown below: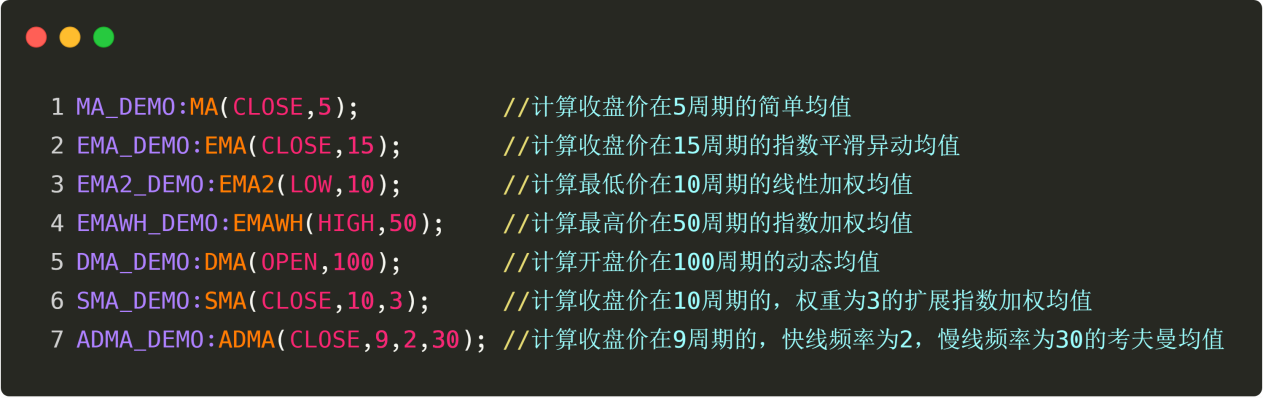 Figure 3-20 Calculation of various indicators in the Malay language
BOLL channel
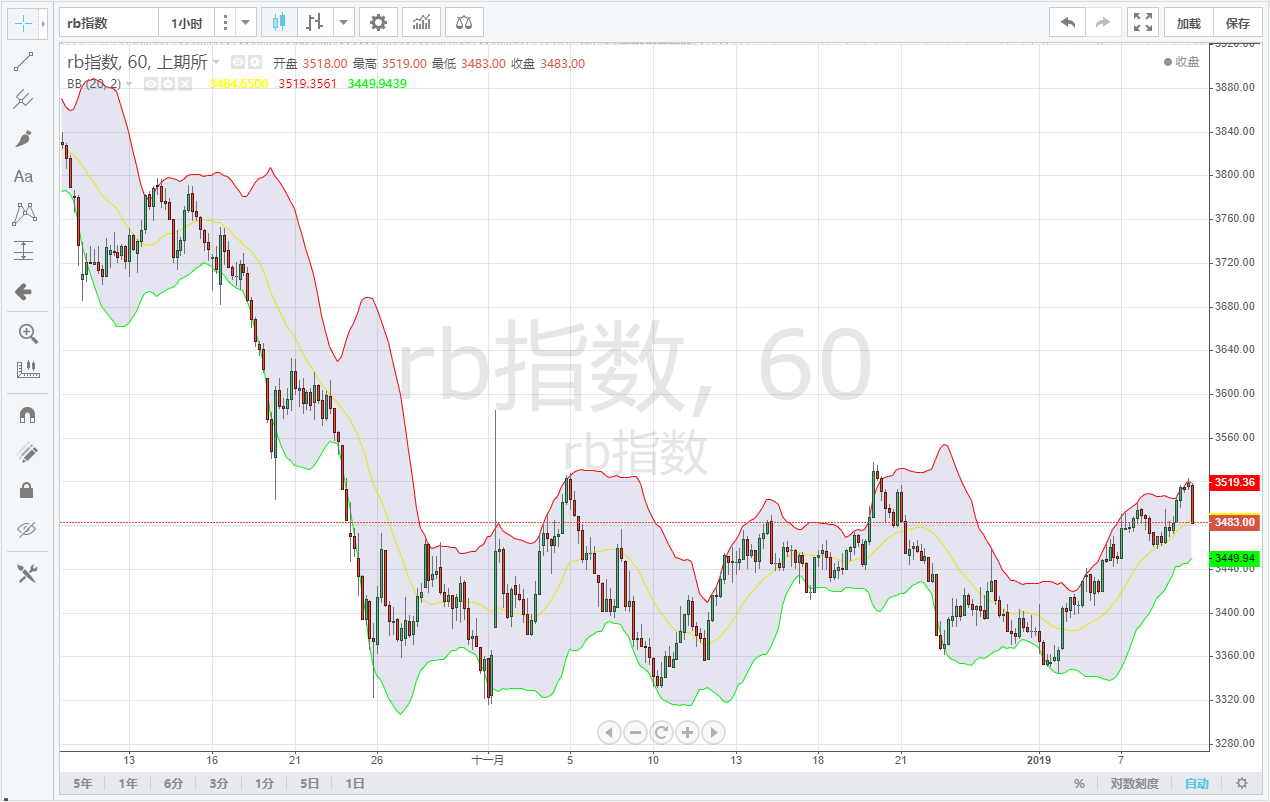 Figure 3-21 BOLL channel map
The BOLL is also known as the Boll-Band indicator, and uses statistical principles to calculate the mid-range based on the N-day moving average, and then the up and down-range based on the standard deviation. When the BOLL channel becomes narrower, it indicates that the price gradually returns to the mean. When the BOLL channel becomes narrower, it means that the market begins to change.
Of all the technical indicators, BOLL's method of calculation is one of the most complex, introducing the concept of standard deviation in statistics, involving the calculation of the median line (MB), the upstream line (UP) and the downstream line (DN).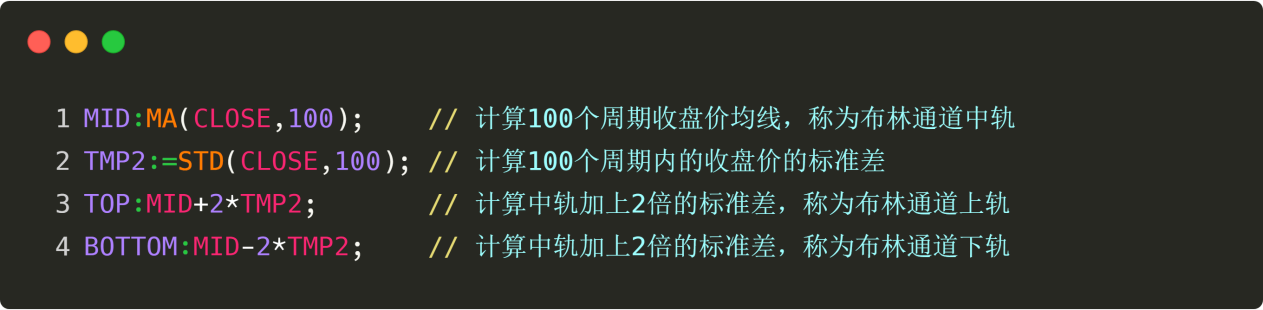 Figure 3-22 Braille-based computing
The MACD
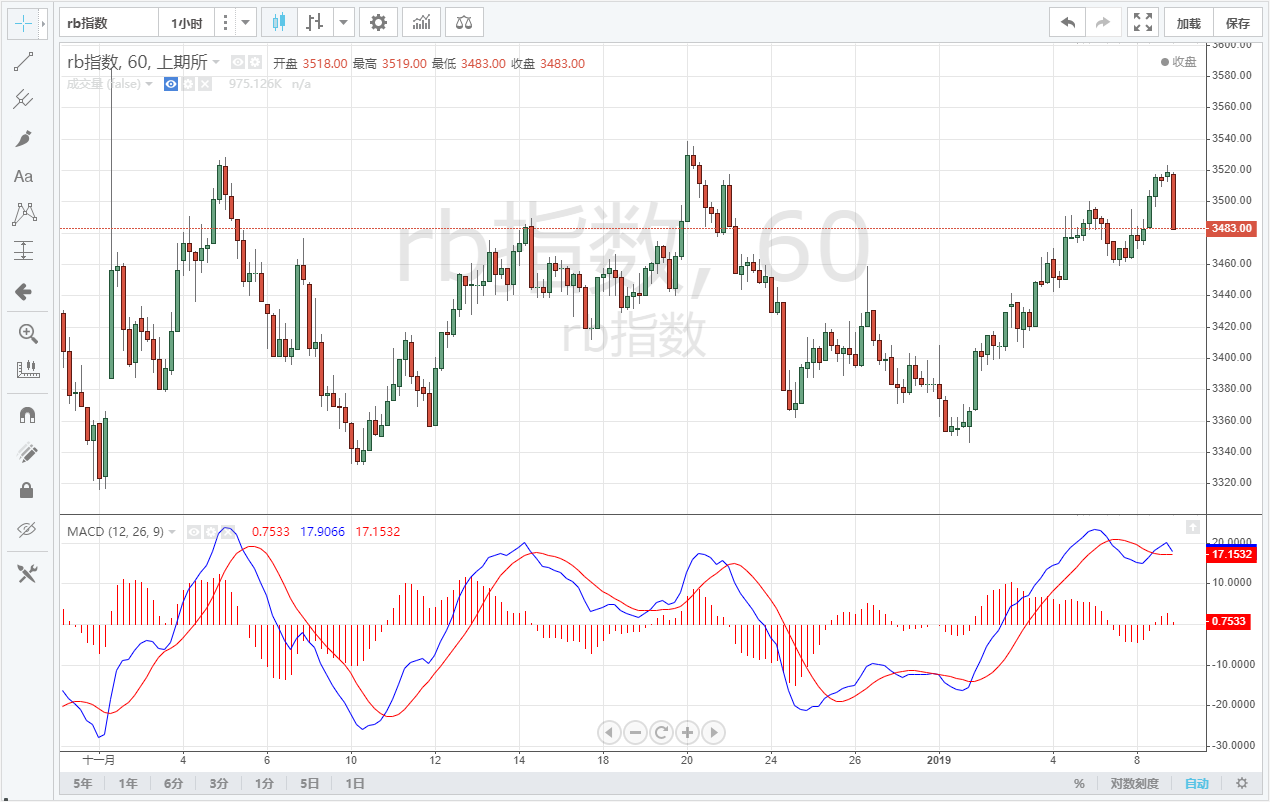 Figure 3-23 MACD is shown
The MACD indicator is a double smooth operation using the signs of fast (short) and slow (long) moving averages and their aggregation and separation. The MACD, which was developed on the basis of the moving average principle, removes the shortcomings of the frequent false signals of the moving average, while retaining the effect of the moving average. Therefore, the MACD indicator has characteristics such as uniform trendline, stability, stability, etc.
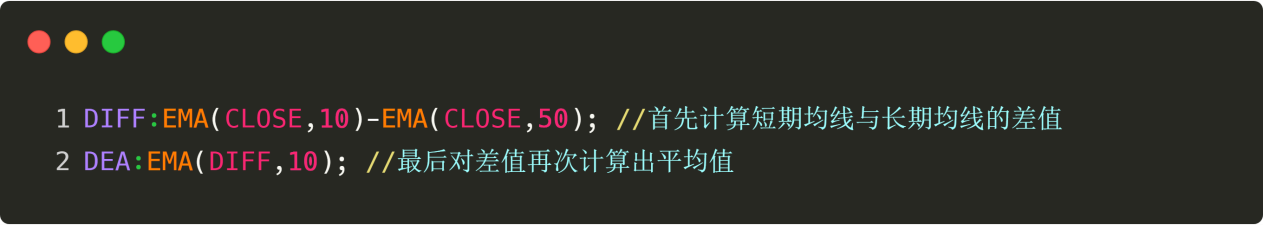 Figure 3-24 MACD indicators for the Malay language
The above are the most commonly used strategy modules in developing quantitative trading strategies, but of course it is much more than that. Through the above module examples, you can also manually implement some of the most commonly used trading modules in subjective trading.
Strategy writing
In the Forex spot market, a commonly used breakout trading strategy is the HANS123 strategy, which breaks the highs and lows of the N root K line after its brief opening as a judgement criterion for triggering a trading signal. This is also an early entry trading pattern.
Strategic logic
In the first half of the game, the players are ready to play. Upstream = high 30 minutes after opening; Downtrend = low 30 minutes after opening; When the price breaks out of the trajectory, buy the open position. When the price drops, sell the open position. The day trading strategy, the pre-closing equity;
The Strategy Code
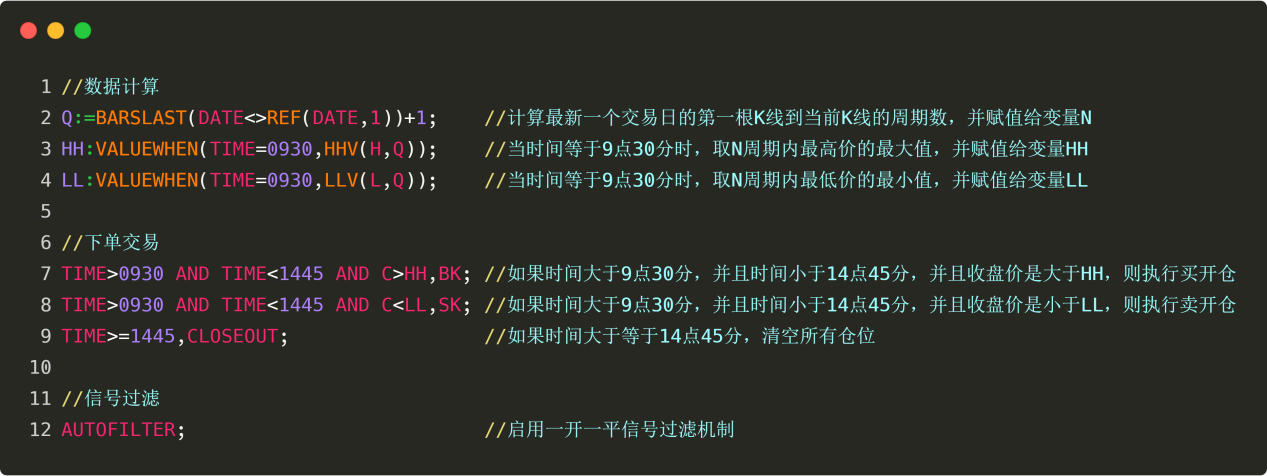 Figure 3-25 Code for the Ma language strategy
Summary
We have learned the concept of strategy modules above, and through a few commonly used strategy modules cases, familiar with the programming methods of inventor quantification tools, it can be said that learning to write strategy modules, improving programming logic thinking, is a key step in the progressive quantification of trading. Finally, we implemented the inventor quantification tools, commonly used in forex spot trading.
The next section
Maybe some of you will be confused, the code is very confusing and you can't understand it. Don't hurry, we've all thought of it for you, in the inventor's quantification tool, there is another programming language, more suitable for small white users, it is visualization programming, as the name implies, look forward to it!
After-school homework
Try to implement a few of the trading modules you use most often in subjective trading. 2, attempting to implement the KDJ indicator algorithm in the inventor's quantification tool in the Mac language.
3.4 A quick introduction to visualized programming
Summary
Many subjective traders who are interested in quantitative trading are confident that after learning the basic syntax, data processing, data structures, logic controls, etc. of traditional programming languages, they will often look back or stop short after long and complex code.
The full strategy
To help you quickly understand the main knowledge of this section, before introducing the inventor to the Quantified Visualization Programming Language, let's first look at what the strategies written in the visualization language look like? and get a preliminary understanding of the notion of the nouns in this section.
Multi-headed: if there is no position at the time, and the closing price is greater than the 50-cycle average.Opening the bargain: If there is no position at the time and the closing price is below the 50-cycle average.Multiple heads: if you currently hold multiple orders and the closing price is less than the 50-cycle average.Standing on empty: If the current holds a blank order, and the closing price is greater than the 50-cycle average.
If the above strategy is written in visual language, it looks like this: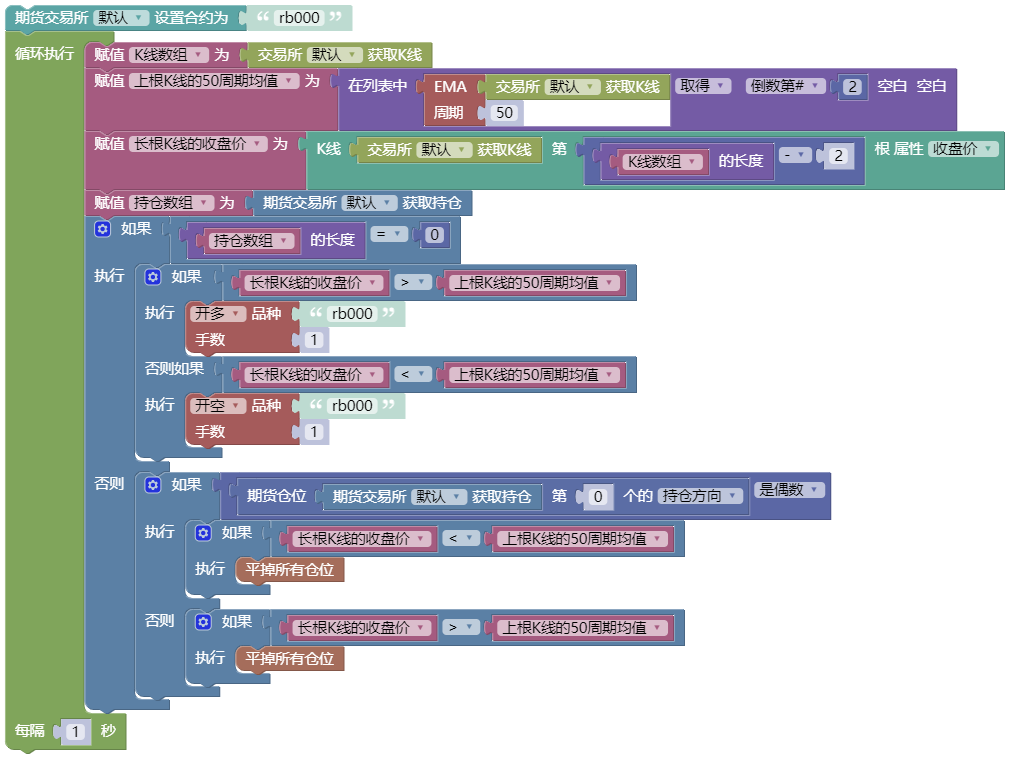 Figure 3-26 Visualized language interface
As shown above, the entire strategy design process is to: set the market variety, obtain the K-line array, obtain the 50-cycle mean of the upper root K-line, obtain the closing price of the upper root K-line, obtain the holding array, determine the holding status, determine whether the closing price is greater than or less than the mean, and execute the open or close position.
Note the concept of array arrays, which are one of the important data structures for every programming language. Arrays are like containers, in which a series of values can be stored. For example, an API called for an array of K strings returns: Figure 3-27 K-line arrays
The code in the diagram above is a K-line array, which has 3 data points: data from the upper root K, data from the upper root K, data from the root K. If we assign this array to a variable called an arr string, if we want to get the last data from this array (data from the root K) we can write it as follows (lines 4 and 5 of the following diagram): Reference to arrays in Figure 3-28
We write it directly in the second (line 5) because there are hundreds of thousands of roots of data in the real K-line, and new K-lines are constantly being added. So we can first get the length of the array,
If you are careful, you may find that these data are all included in the brackets, and you probably know the corresponding ones: time, opening price, highest price, lowest price, closing price, volume. If you want to get the closing price of the upper root K line, add the brackets directly after it. Reference to arrays in Figure 3-29
Why use a visual programming language?
With these concepts in mind, let's first write a program in Java that outputs hello, world, to get a feel for traditional programming, as shown below: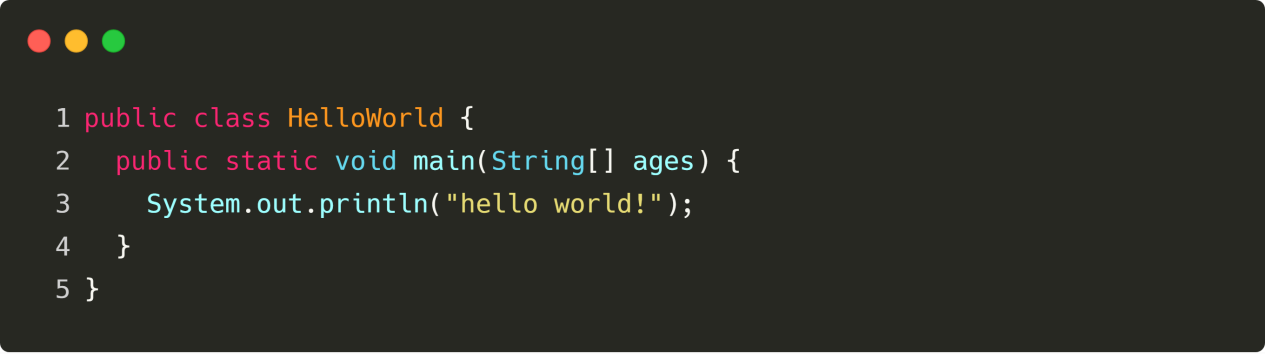 Figure 3 to 30
Simply output a hello world! string, and the program writes 5 lines of code. I believe that most beginners know only the English words hello, world, etc. in parentheses.
What is visual programming?
Visual programming has been around for a long time and is not a new thing. The idea of visualization is that it is a simple programming idea that contains a variety of control modules that can be used to construct code logic, complete transaction strategy design, and the process is very similar to building blocks.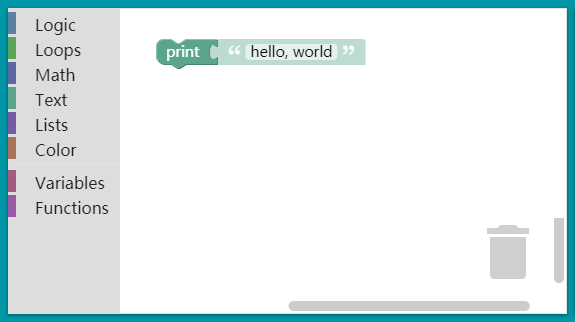 Figure 3 to 31
As shown above, the same procedure can be done with just one line of code in blockly visualized programming. This greatly reduces the programming threshold, especially for traders who don't know anything about programming.
What are the characteristics of a visualization programming language?
blockly is not a programming toy, it is a genuine editor, not the kind of operating system that masquerades as an editor, and supports many basic programming elements, such as variables, functions, arrays, and easily extensible custom blocks, which you can use to complete complex programming tasks.
The inventor quantified the visualization programming, which was made possible by Google's blockly visualization tool. Similar in design to Scratch from the University of Massachusetts, a true zero threshold (see figure below).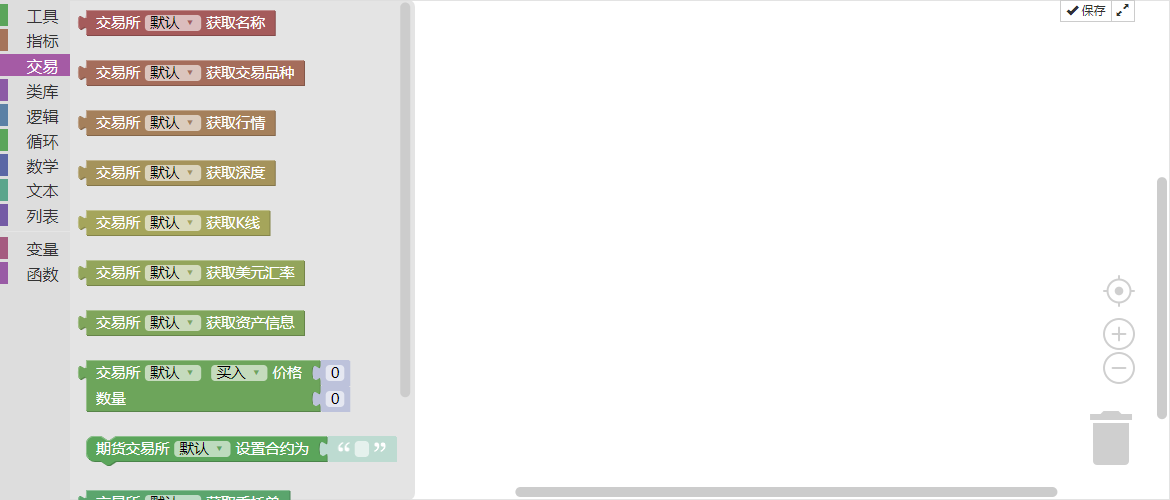 Figure 3 to 32
Hundreds of commonly used trading modules are built into the inventor's quantified visualization programming interface, and more will be added to support traders' new ideas and new applications, which will be co-developed and maintained by the developers.
Although the syntax is simple, it does not lose its performance. It can almost satisfy most simple quantitative trading strategy development. It is not inferior to conventional programming languages such as Python, JavaScript, and others in terms of functionality and speed. It will support logically complex financial applications in the future.
How to use
 Figure 3 to 33
Write a hello, world program
 Figure 3 to 34
Run, print out the hello, world button.
 Figure 3 to 35
Summary
Above we start with a complete visualization strategy, to an introduction and features of the visualization language, and finally how to use the visualization language on the inventor quantification tool, and an example of writing a hello world puzzle. However, it is necessary to remind everyone that as an introduction to quantification transactions, visualization programming is a good knock on the door, but currently on the inventor quantification tool, only a limited API interface is open, for quantification transactions it is best to use it as an auxiliary tool to help you clear the logic of the strategy.
The next section
Visual programming is not much different from the basics of a high-level programming language, and is even general in some places. Learning visual programming is a step further from learning high-level programming. In the next section, we will learn in-depth about the progression of visual programming, including how to write commonly used quantitative trading modules in visual language on inventor quantification tools, and how to develop a complete intraday trading strategy.
After-school homework
1, in which inventors quantify visualized programming interfaces, use APIs and understand their meaning. 2, to obtain the latest opening price in a visual language and export it to the logs.
3.5 How to implement strategies with visual language
Summary
In the previous post, we learned about the introduction and features of the visualization programming language, the example of hello world, and how to write a strategy in the inventor's quantitative trading tool. In this post, we continue to the next post, starting from the commonly used strategy modules and technical indicators, to the strategy logic, step by step to help you implement a complete intraday trading strategy.
The Strategy Module
Stage increase
The phase gain is calculated as the percentage difference between the closing price of the root K line and the closing price of the previous N cycles. For example, calculate the increase of the last 10 K-line phases, using the code: Figure 3 to 36
The above code shows that the way the computer executes it requires a complete logical loop, such as to calculate the increment of the most recent 10 K-line phases, which needs to be broken down into the following steps:
First, the computer needs to know exactly what variety you want to trade, for example methanol, and then set the contract code to: MA888
With K-line data, you can get detailed data for any one of these K-line data. In order to calculate the statistical phase of the increase, it is necessary to obtain the closing price of two K lines, for example: the closing price of the upper root K line and the closing price of the previous 11th root K line.
Finally, calculate the phase magnification ratio based on these two K-line closing prices. Each of the following strategies has such characteristics as a logical loop and a conditional property. Understanding this logic, visualizing programming will also become much easier.
The launch is on.
A volume attack can be understood as a rise in price and a sharp increase in volume. For example, if the closing price of the root K line is 1.5 times the closing price of the previous 10th K line, that is, 50% gain within 10 days; the volume is more than 5 times the average of the last 10 K lines. The code can be written as: Figure 3 to 37
Jumping the Gap
A jump gap is a situation in which the highest low of the two K-lines is unwound, consisting of two K-lines, and the jump gap is the reference price of the later support and pressure points. When a jump gap occurs, it can be assumed that an acceleration of the trend along the original jump direction has begun. Figure 3 to 38
Commonly used technical indicators
EMA mean
From a statistical point of view, the average line is the arithmetic average of the daily price, it is a price trajectory with a trend. The average line system is a technical tool commonly used by most analysts, from a technical point of view it is a factor that affects the psychological price of the technical analyst, the decision-making factor of buying and selling, is a good reference tool for technical analysts, the inventor of the quantification tool supports many different types of average lines, as shown below: Figure 3 to 39
The MACD
The MACD indicator is a double smooth operation using the signs of fast (short) and slow (long) moving averages and their aggregation and separation. The MACD, which was developed on the basis of the moving average principle, removes the shortcomings of the frequent false signals of the moving average, while retaining the effect of the moving average. Therefore, the MACD indicator has characteristics such as uniform trendline, stability, stability, etc. Figure 3 to 40
Indicator of KDJ
The KDJ indicator combines the strengths of momentum, strengths and moving averages to measure the degree of variation of stock prices away from the normal range of prices. It takes into account not only the closing price, but also recent highs and lows, which avoid ignoring the weakness of the true volatility, considering only the closing price. Figure 3 to 41
Strategy writing
Benjamin Graham, Warren Buffett's mentor, once wrote in his book, The Smarter Investor, about a trading model in which stocks and bonds are dynamically balanced.
The transaction model is very simple: Invest 50% of your money in a stock fund and the remaining 50% in a bond fund; that is, both stocks and bonds are half each.
A re-balancing of assets at a fixed interval or market change brings the ratio of equity assets to bond assets back to the original 1:1. That's the whole logic of the whole strategy, including when to buy and how much to buy.
In this approach, the volatility of the bond fund is actually small, much lower than the volatility of the stock, so the bonds are considered here as a'reference peg', that is, the bond is used to measure whether the stock is earning too much or too little.
If the stock price rises, the market value of the stock is greater than the market value of the bond, and when the market value ratio of the two exceeds the set threshold, the total position is readjusted, the stock is sold, and the bond is bought, returning the stock-bond market value ratio to the original 1:1.
Instead, a fall in the stock price causes the market value of the stock to be less than the market value of the bond, and when the market value ratio of the two exceeds the set threshold, the total position is readjusted, stocks are bought and bonds are sold, bringing the stock-bond market value ratio back to the original 1:1 ratio.
In this way, a dynamically balanced ratio between stocks and bonds is enough to enjoy the fruits of stock growth and reduce asset volatility. As a pioneer of value investing, Graham provides us with a good idea.
Strategic logic
At the current value of BTC, the account balance retains ¥5000 in cash and 0.1 BTC, i.e. the initial ratio of cash to BTC market value is 1:1.
If the price of BTC rises to ¥6000, i.e. the market value of BTC is greater than the account balance, and the difference between them is greater than the set threshold, sell ((6000-5000) / 6000/2 coins.
If the price of BTC drops to ¥4,000, i.e. the market value of BTC is less than the account balance, and the difference between them is more than the set threshold, buy ¥5000-4000/4000/2 coins.
In this way, regardless of whether BTC is appreciated or depreciated, the account balance is always kept dynamically equal to the market value of BTC. If BTC is depreciated, buy some, wait for it to come back, sell some more, as if it were normal.
Conditions of purchase: If the market value of the current holding minus the current available balance is less than negative 5% of the current available balance, the position is bought.Conditions of sale: If the current market value of the holding minus the current available balance is greater than 5% of the current available balance, the equity is sold.
Prerequisites
- The current market
- Current assets
- The total market value of the currency
- The wealth gap
Strategy building
Step 1 of the visualization writing strategy
We calculate the four prerequisites of the trading strategy and assign values to the respective variables. To visualize the programming, the code block looks like this.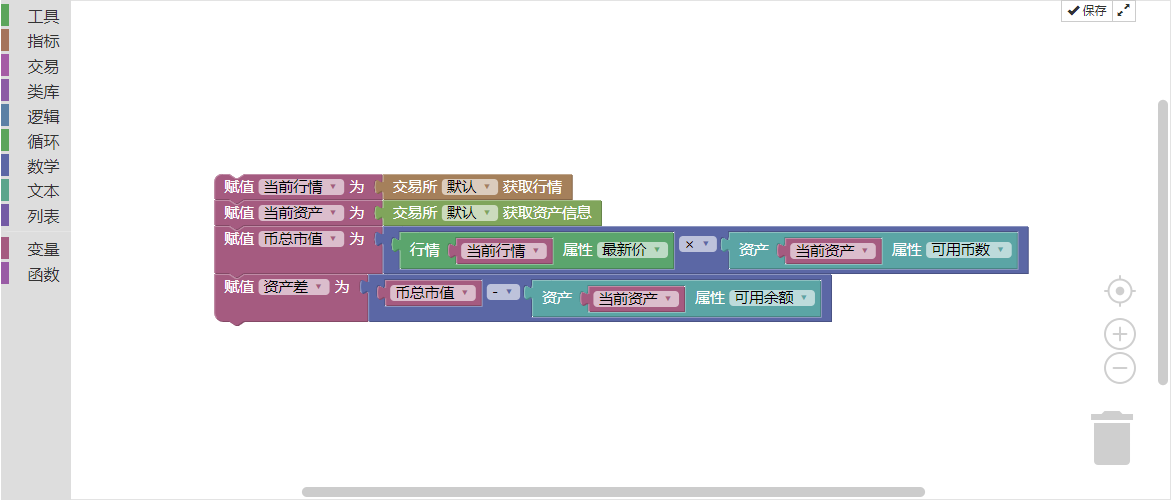 Figure 3 to 42
It is important to note that the total market value of the currency is the total market value of the current number of coins held, which is calculated by multiplying the current total number of coins held by the current latest price. The asset gap is the total market value of the currency minus the current available balance.
Step 2 of the visualization writing strategy
Once the prerequisite attribution is complete, the transaction logic needs to be written. This is also not as complicated as imagined. It is simply a matter of expressing the above strategy logic in the form of blocks of code.
This means that if the asset is less than 5% of the negative available balance, it is bought, and if the asset is more than 5% of the available balance, it is sold.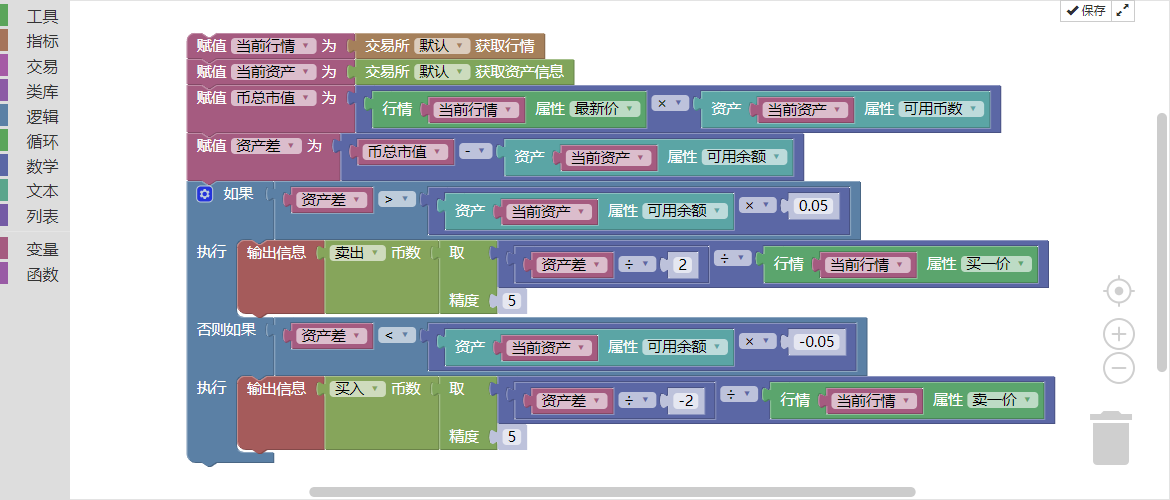 Figure 3 to 43
The whole strategy seems to have been written, but remember that the process is executed from top to bottom and stops after execution. But our trading strategy is not to execute the transaction conditions once, but repeatedly execute them in a loop.
In other words, the program needs to continuously check whether the policy conditions have been met, and if it is about executing a buy or sell, then keep checking; at this point, another loop statement is needed, as shown below:Figure 3 to 44
Strategic retesting
Visualization strategies are essentially the same as strategies written in other programming languages, and also support multiple cycles, accurate historical data testing, and of course support for both domestic and foreign commodity futures and digital currency trading.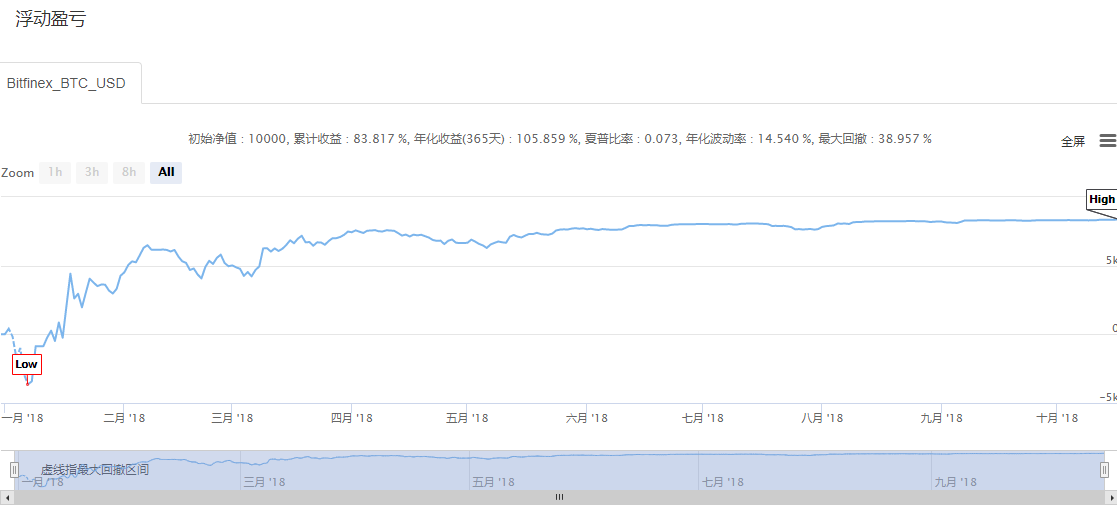 Figure 3 to 45
To this end, a complete trading strategy has yet to be completed. In order to take care of the handlers, this strategy has been shared on Strategy Square and can be directly copied.
The End
The 10,000-hour law is always there, but it's impossible for a zero-based trader to take 10,000 hours to get back on track. So you have to have a ladder, and for a zero-based trader, the inventor's quantized visualization programming is a quick entry ladder.
With visualization programming, you don't need to remember syntax and method names, just simply browse the function module to find what you want. This is where the inventors of quantization came from, to help more beginners of quantification lower the entry threshold, increase the interest in quantification, and everyone can become a quantification trader!
However, visualising programming as a quantitative entry point is not a problem, but it has its limitations, such as not being able to develop too complex, too detailed trading strategies.
The next section
From the perspective of the professionalism of quantitative trading, both Macrolanguages and visualization languages are merely transitional languages into the world of quantitative trading. Their linguistic characteristics also determine the limitations in the development of quantitative trading strategies, and some complex strategies are unlikely to be realized. So in the next section we will take you to learn JavaScript, which is a formal high-level programming language and a must-have for you to progress to advanced quantitative trading.
After-school homework
1, try to implement the Brainstorm indicator in a visual language. Try to complete a trading strategy using the trading module in this section.
Chapter 4: The mainstream programming language for implementing transaction strategies
4.1 A quick introduction to the JavaScript language
Summary
As a future quantitative trading star, you can't learn a simple language alone. The inventors of quantitative trading tools, such as the Mac language and the visualization language, can get you started, but there are many limitations in strategy development due to their language characteristics.
Why learn JavaScript
JavaScript has better performance and execution efficiency than visualization languages. JavaScript is also much more flexible than visualization languages when it comes to policy development. For example, if you want to develop a set of policies, you can't do it with visualization languages because of its limited modules and doesn't support set-like policy policies, which JavaScript can easily do.
In addition, the JavaScript language is more concise and elegant than the visualization language, for example: the visualization language has 10 lines of code, which can be written in JavaScript with maybe 5 lines. In some respects, the visualization language is just a text version of JavaScript, whose code execution and logic is almost the same as JavaScript. If you learn the visualization language, then learning JavaScript will be very easy.
JavaScript language briefing
JavaScript is a formal high-level programming language. It is suitable both as an introductory language for learning programming and as a working language for everyday development. It is one of the most promising and promising computer languages currently, with an unshakable dominance on the browser side. Although it is best known for developing web pages, it is also used in many non-browser environments, e.g. server, PC, mobile, etc.
The full strategy
To help you quickly understand the main points of this section, before introducing the inventors of the Quantified JavaScript language, let's have a preliminary understanding of the concept of nouns in this section.
Multi-headed: if there is no position at the moment, and the 5-cycle averagely is greater than the 20-cycle averagely.Opening the bargain: if there is no position at the moment, and the 5-cycle averagely is less than the 20-cycle averagely.Multiple heads: if the current holds multiple orders, and the 5-cycle average is less than the 20-cycle average.Standing on empty: if the current hold is empty, and the 5-cycle average is greater than the 20-cycle average.
If it's written in JavaScript, it looks like this: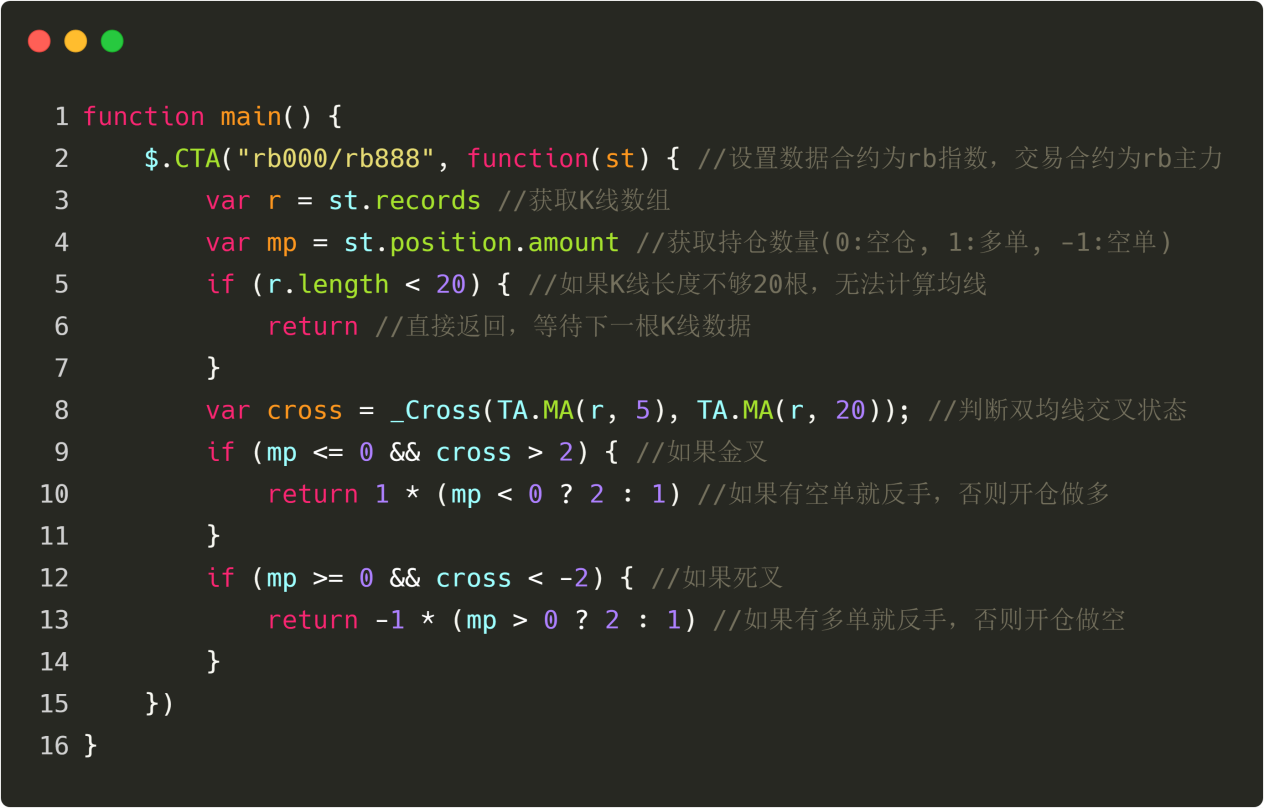 Figure 4 to 1
The code in the diagram above is a complete quantized trading strategy written in JavaScript language. It can be run in real time and automatically place orders. The language is simpler than a visual language in terms of code volume. The design process for the entire strategy is: set up the market variety, get K-line data, get hold information, calculate trading logic, place buy orders.
Identifier
Everything in JavaScript (variables, function names, and operators) is capitalized, which means that the variable name test and the variable name test are two different variables. The first character of the identifier (name of variable, function, attribute, function parameter) must be a letter, underscore, dollar sign, or a number, as shown in the following figure: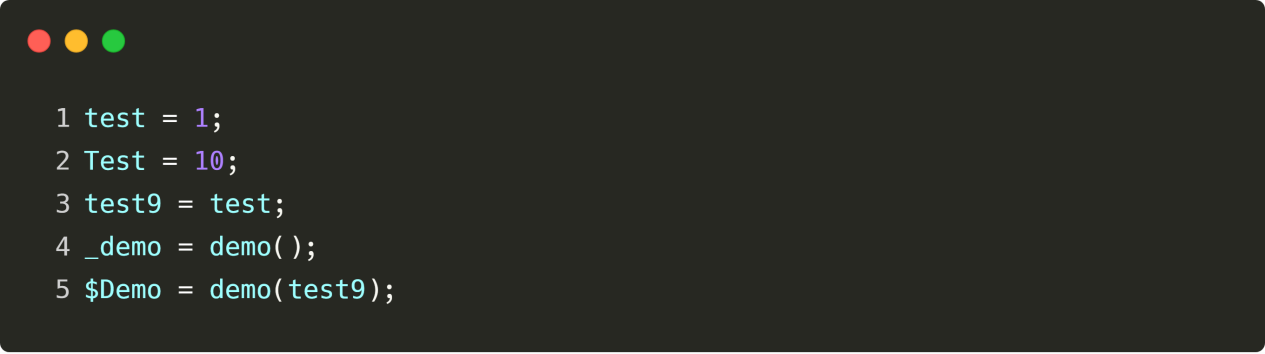 Figure 4 and 4
Notes
The annotations include single-line annotations and block-level annotations. Single-line annotations begin with two slashes, block annotations with one slash and an asterisk./) start with a star and a slash (((/) end with the following graph: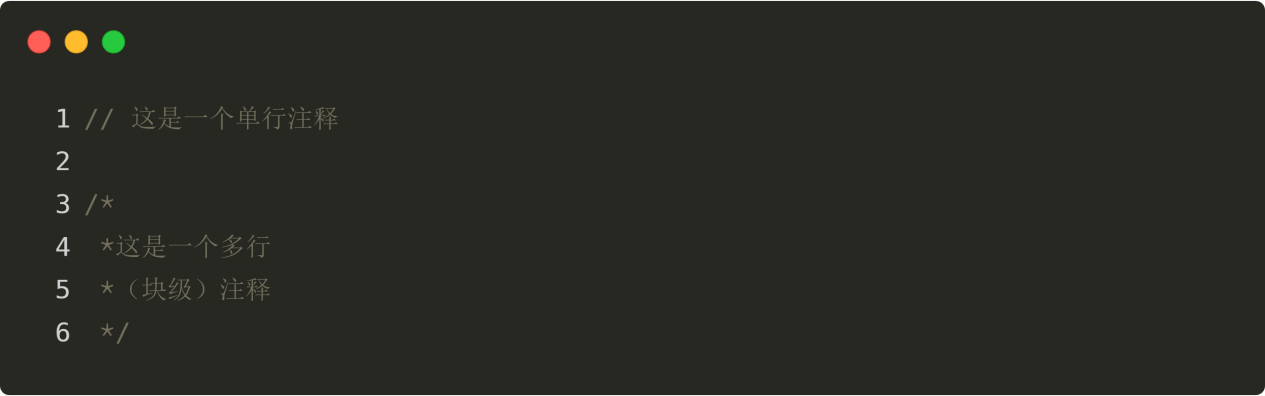 Figure 4 to 3
The phrase
Each statement has a comma at the end; although this is not required, we recommend that it is not omitted at any time. Adding a comma can increase the performance of the code in some cases, as shown in the figure below: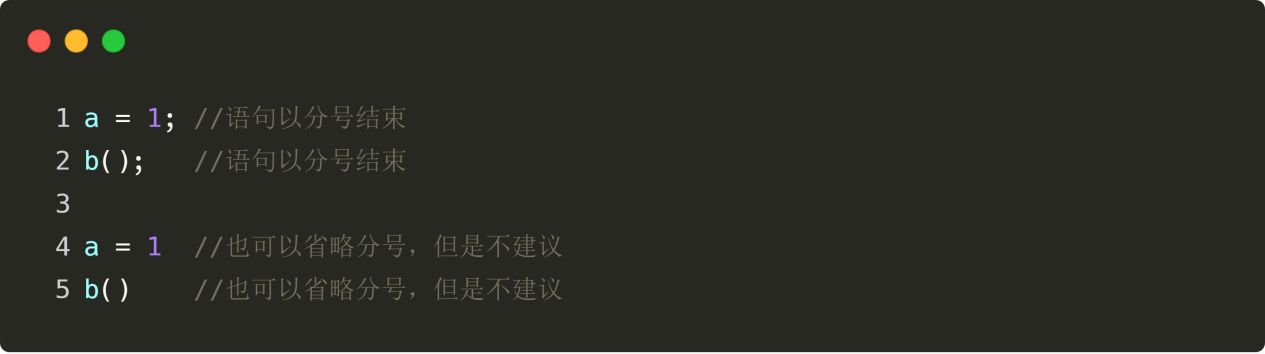 Figure 4 to 4
Variable
Variables can store any type of data, and the var operator is used when creating the variable, followed by the variable name. Variables can also be set at the same time when defining the variable. Once the variable is created, the value of the variable is set again without the var operator, as shown in the figure below: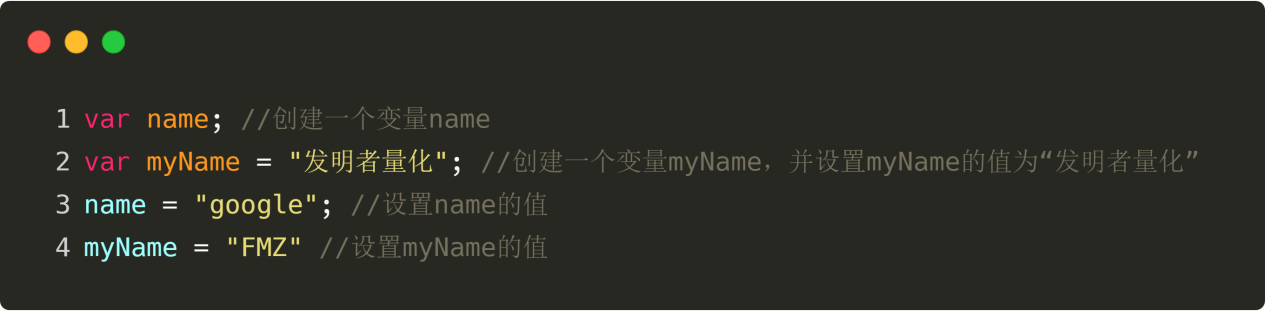 Figure 4 and 5
The data
There are five data types in JavaScript: undefined, null, boolean, numeric, string, and string, as shown below: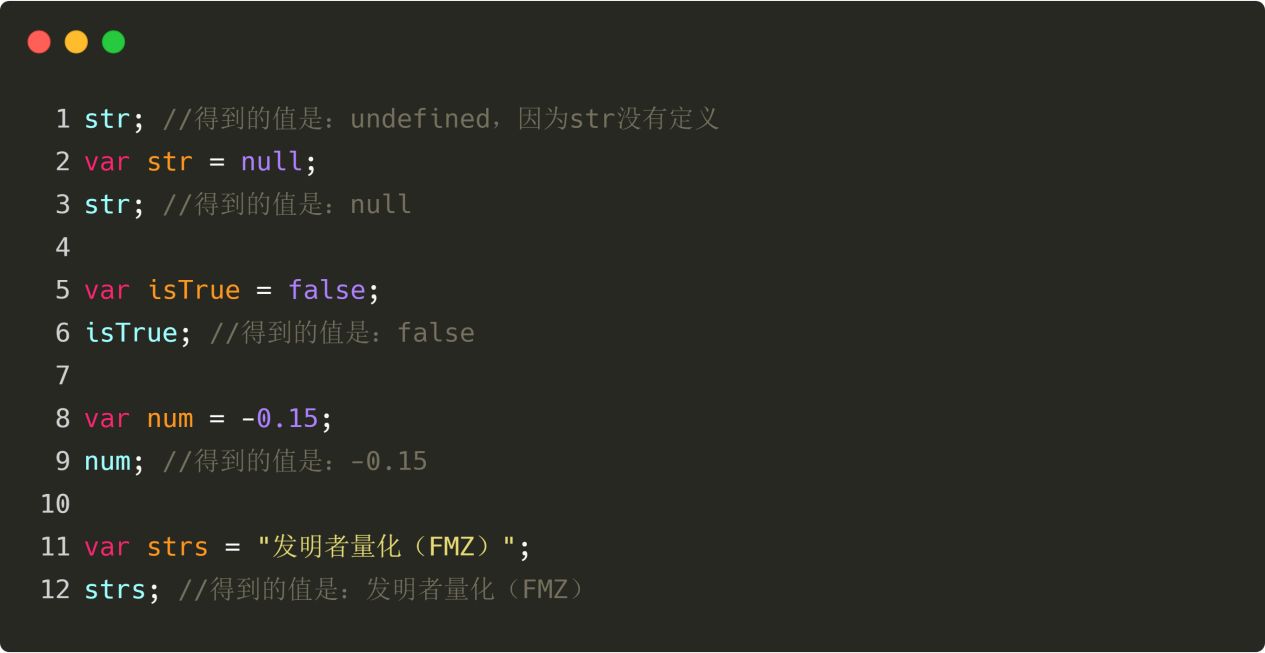 Figure 4 to 6
Undefined has only one value, a special undefined value, which represents a value that has not yet been set. For example, if we define only one variable and do not set a value for that variable, then the value of that variable is undefined.
Null has only one value, the special null string, which represents a value set to null. For example, if we first create a variable and then set the value of the variable to null string, then the value returned by the query is null string.
Boolean has two values, the true and false values, which are true and false. Note that both the true and false values are lower case.
Number is a type of number, including: positive, negative, integer, decimal, etc. It is also a special number, which is specifically used to represent the case where the number is not returned, for example:
String can be understood as text, contain Chinese and English, and can be constructed using single or double quotation marks. For example:
Objects
An object can be understood as a container that stores a variety of data, with properties and values in the container. The container can be created first with the new operator. Attributes and methods can be added to the created object, as shown below: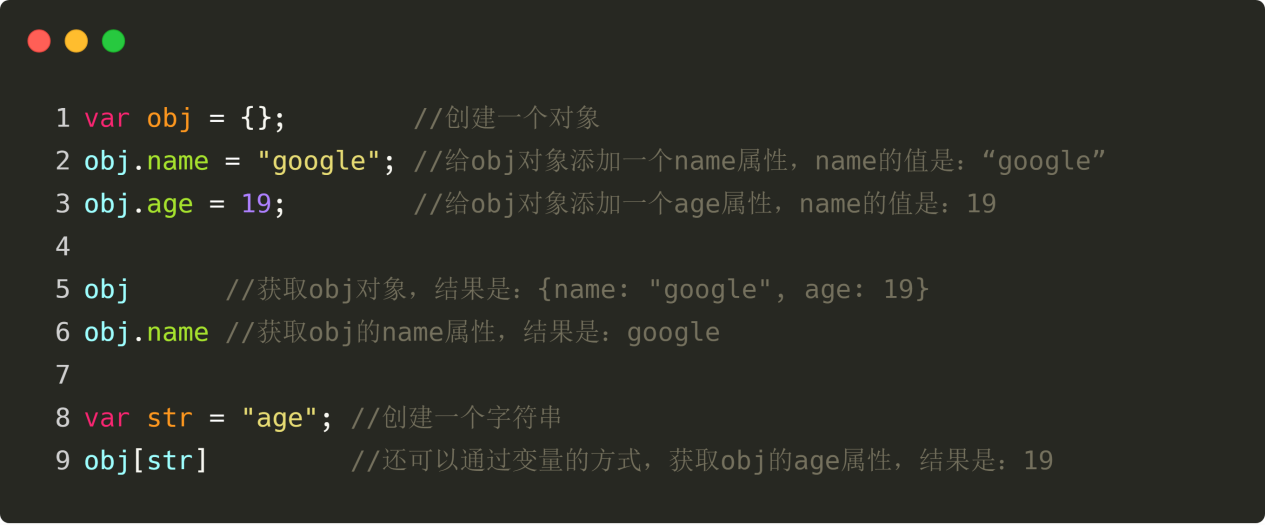 Figure 4 to 7
Arrays
An array is also a container for storing a variety of data, except that the elements in the container are arranged in a left-to-right order, with the first element being 0, the second element being 1, and so on. Additionally, JavaScript arrays can store any data type, as shown in the figure below: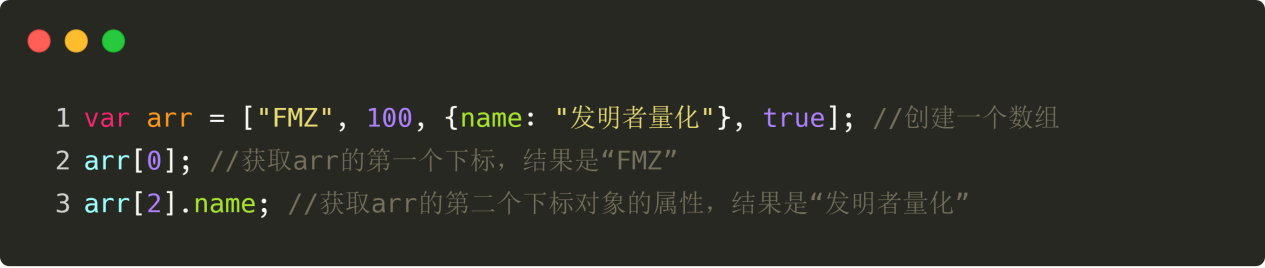 Figure 4 to 8
Function
Functions in JavaScript are essentially no different from our middle school functions, you can understand what is passed in, what is output through the calculation of functions, as shown in the following diagram: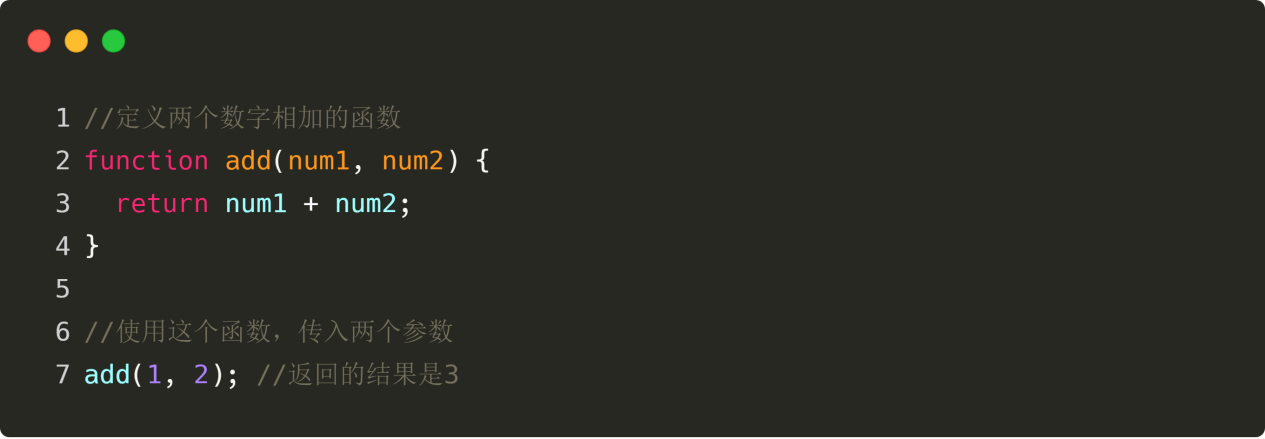 Figure 4 to 9
The operator
JavaScript has several types of operators, namely arithmetic operators, comparison operators, and logical operators. The arithmetic operator is a mathematical operation that adds or subtracts multiplication. The comparison operator can compare two values whether they are less than or equal to each other.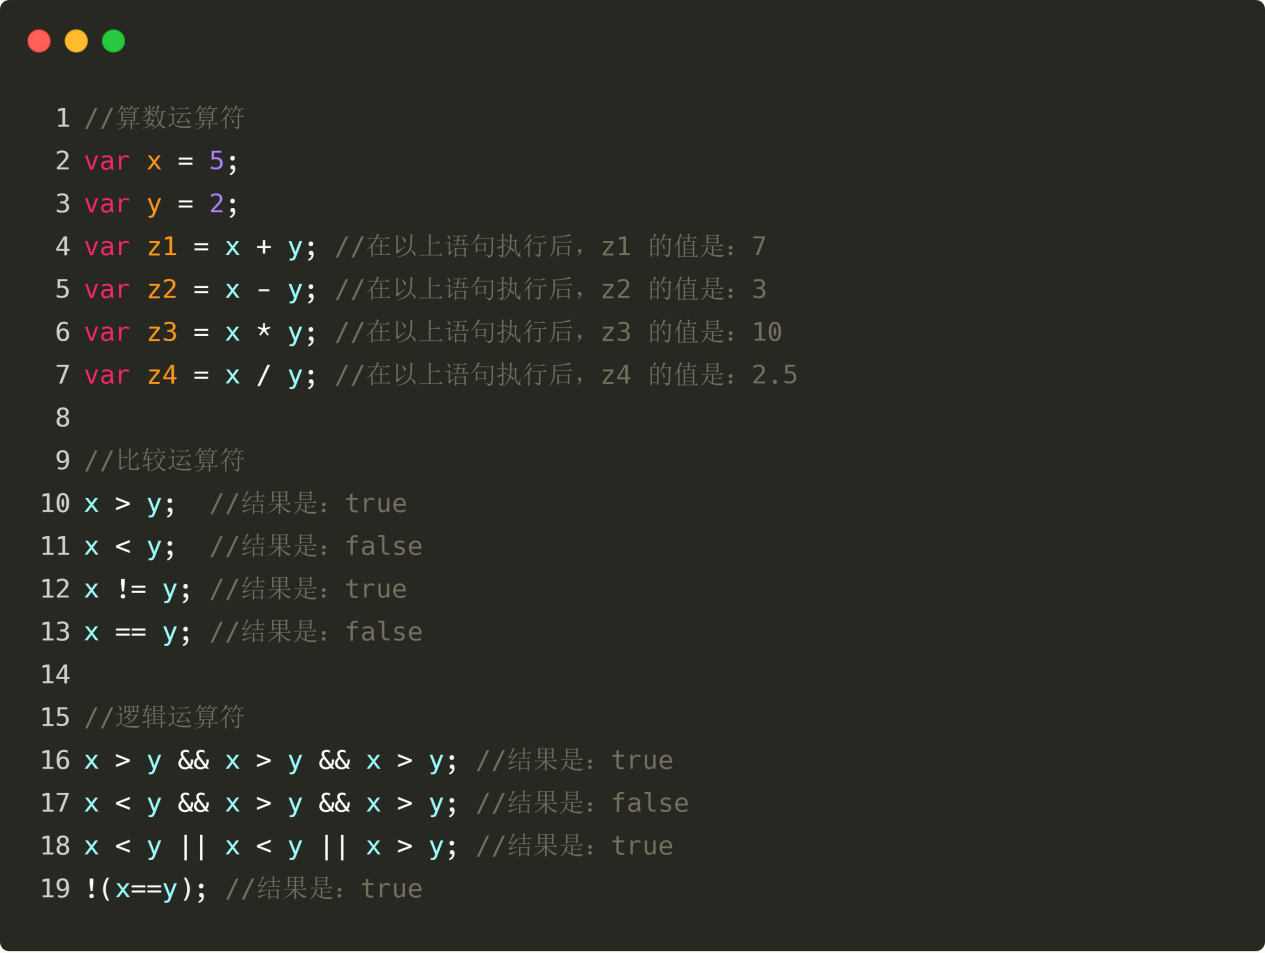 Figure 4 to 10
Note that:
Figure 4 to 10
Note that:
Priorities
If there is an expression 100* ((10-1) / ((10+5), which step of the program is the first to be computed? Secondary mathematics tells us: (1) If it is the same level of operation, the calculation is usually done in left-to-right order. (2) If there is both addition and subtraction and multiplication, multiply first. (3) If there is a parenthesis, the parenthesis is in parenthesis. (4) If the operation law is met, the operation law can be used to reduce.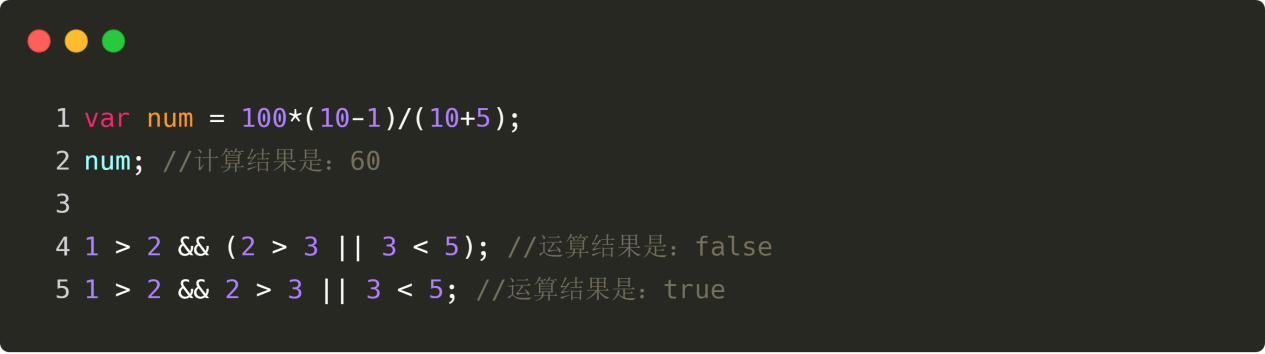 Figure 4 to 11
Conditional statements
Usually when writing code, you always need to perform different actions for different decisions. You can use conditional statements in code to accomplish this task. In JavaScript, we can use the following conditional statements: if statement - Use the statement to execute code only when the specified condition is true if...else statement - executes code when the condition is true and other code when the condition is false if...else if...else statement - Use this statement to select one of several blocks of code to execute switch statement - Use this statement to select one of several blocks of code to execute
If statements
The statement will execute code only when the specified condition is true. Use lowercase if. Use uppercase IF will generate a JavaScript error!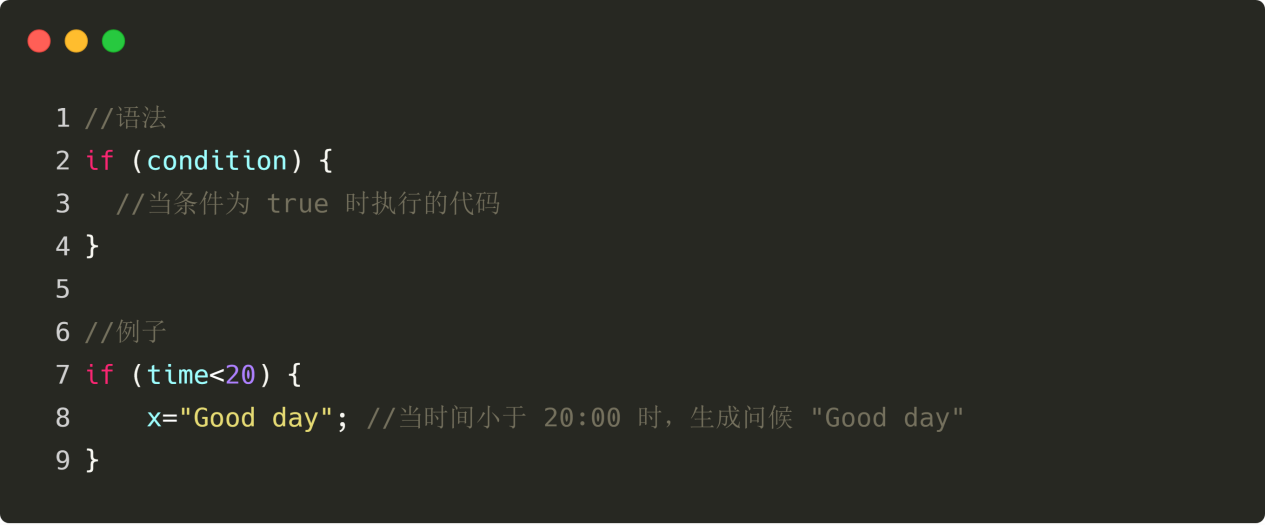 Figure 4-12#
If...else phrase
Execute code when the condition is true, and execute other code when the condition is false, as shown in the figure below: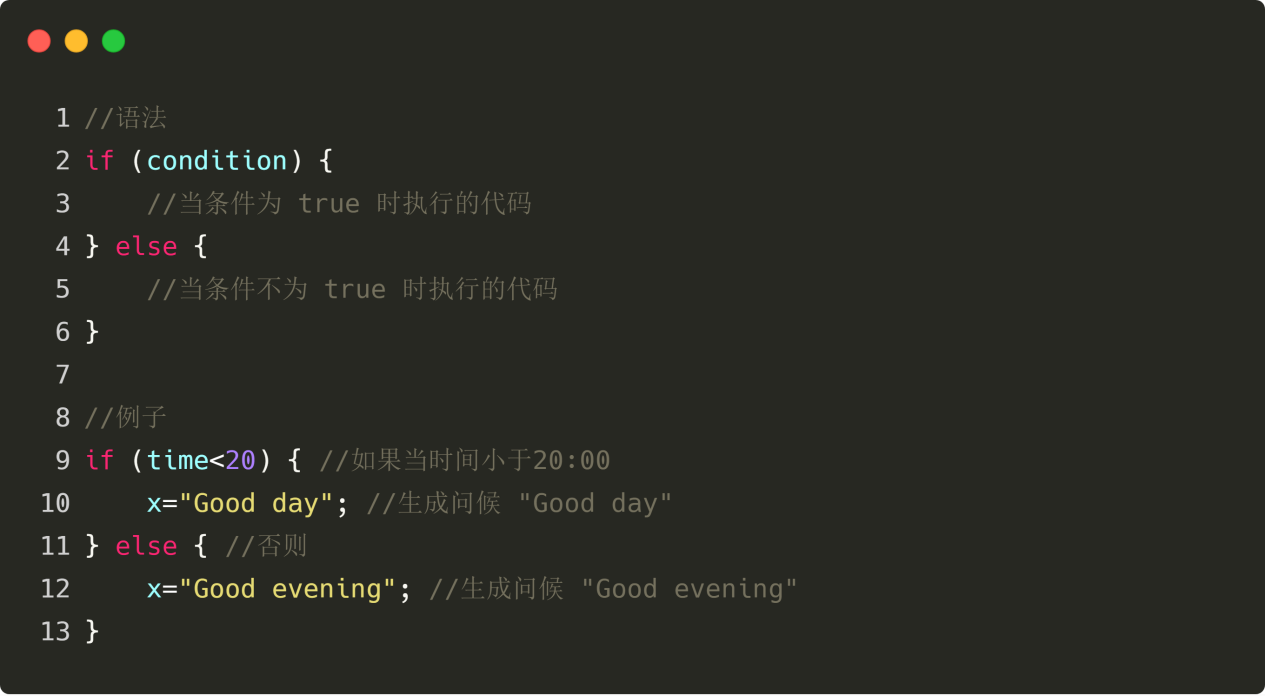 Figure 4 to 13
for cycle
Sometimes we need to get the data of the K-line of the most recent days, and we need to get it from the K-line array, according to the location of the K-line data, then using the for loop is very convenient, as shown in the following diagram: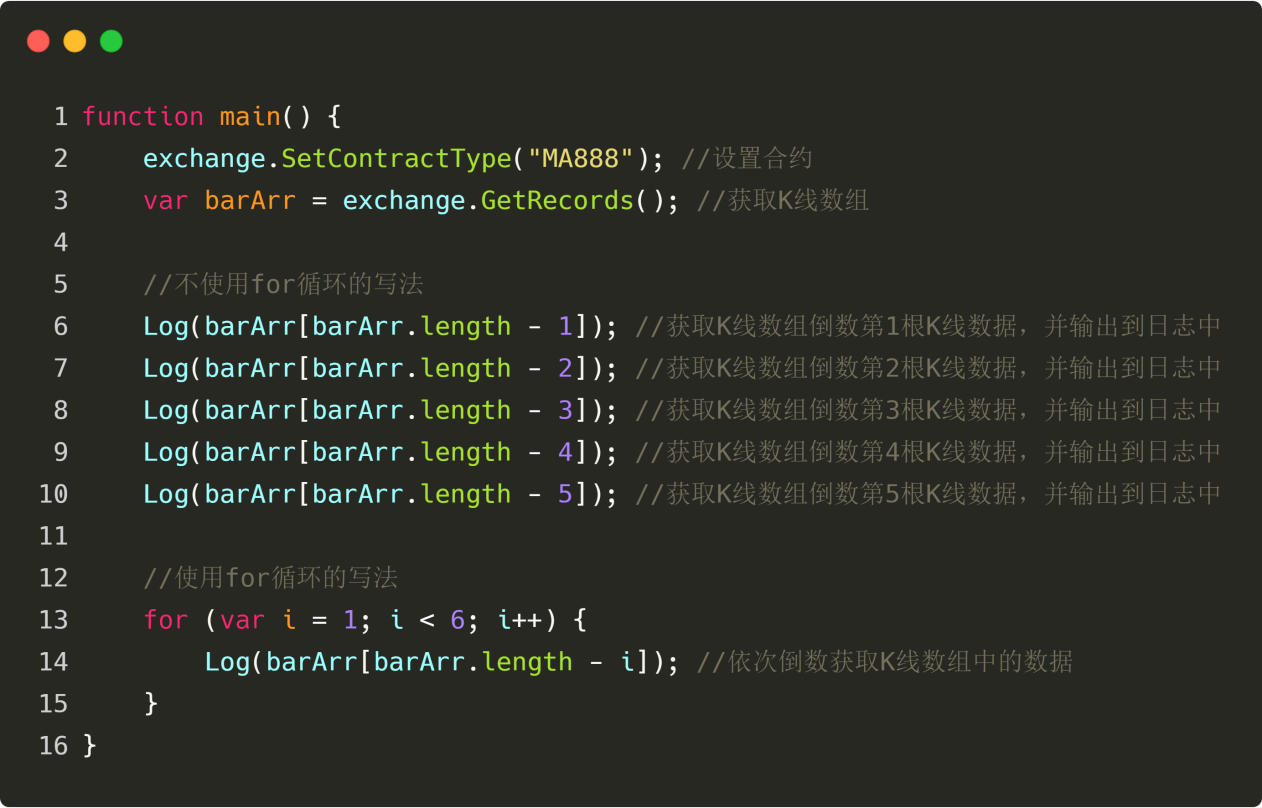 Figure 4 to 14
while loop
We all know that the market is constantly changing, and if you want to get the latest K-line arrays, you have to run the same code over and over again, then using a whilex loop, the loop can always get the latest K-line arrays as long as the condition is true.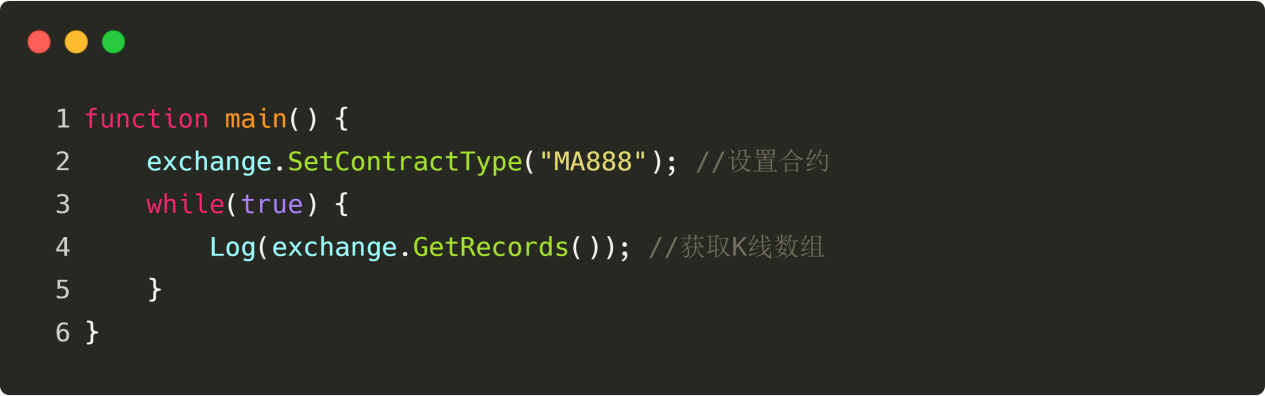 Figure 4 to 15
break and continue sentences
The loop is conditional, and the loop starts doing something repeatedly only when the condition is true, and the loop ends when the condition is false. However, break statements can jump out of the loop immediately while the loop is executed; continue statements can interrupt a loop and then continue the next loop, as shown below: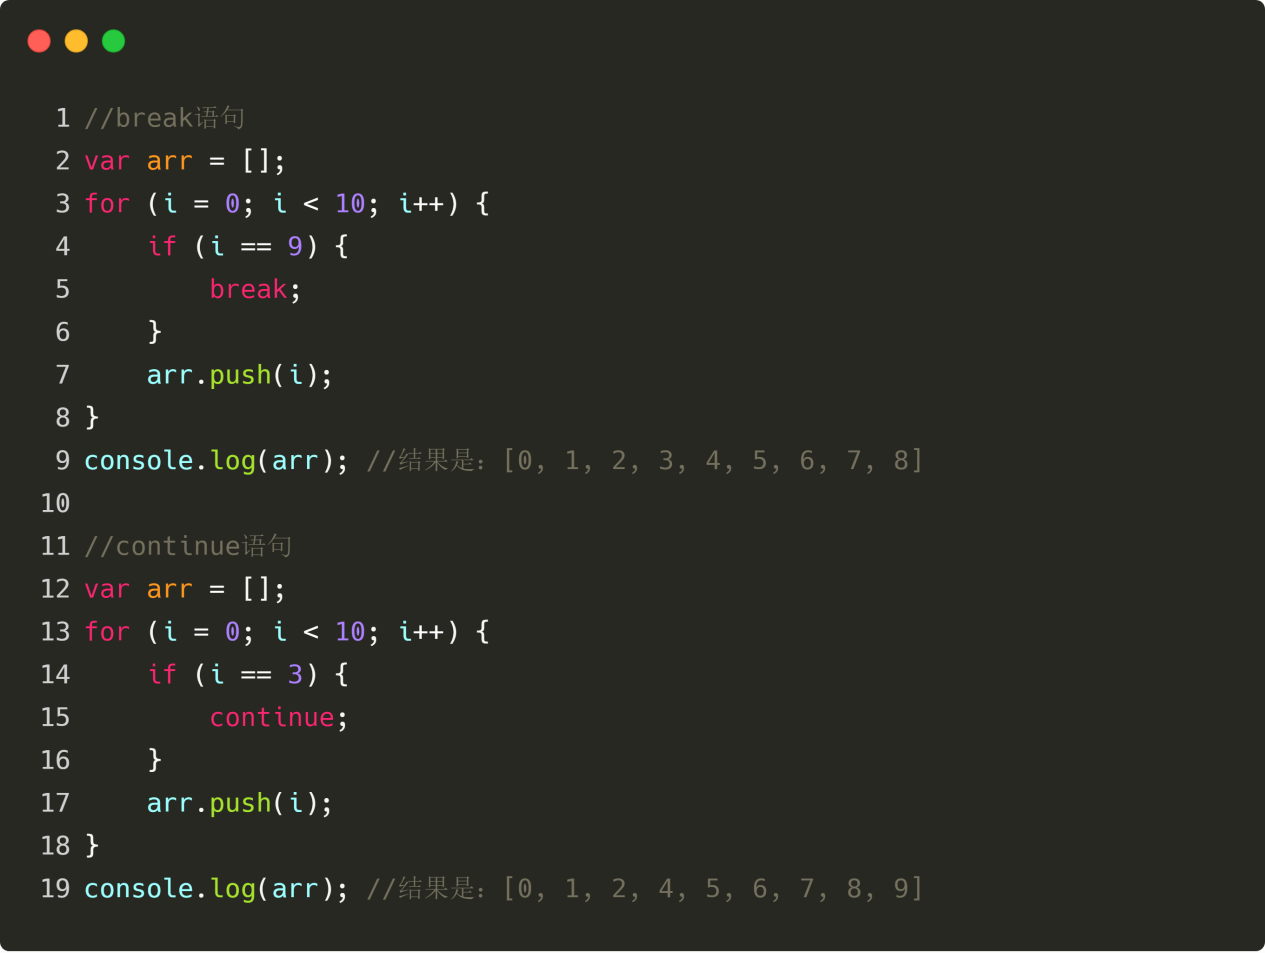 Figure 4 to 16
return statements
The return statement terminates the function's execution and returns the value of the function. The return statement can only appear within the function body, and any other appearance in the code will cause a syntax error!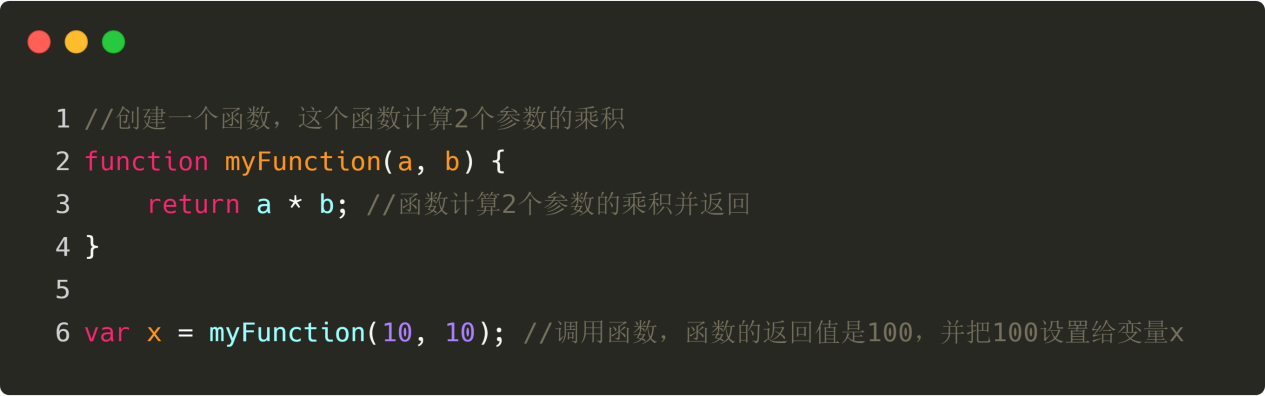 Figure 4 to 17
CTA strategy architecture
In the inventor's quantification tool, the official built-in set of standard policy frameworks, which would be very convenient if written in JavaScript language, is shown below: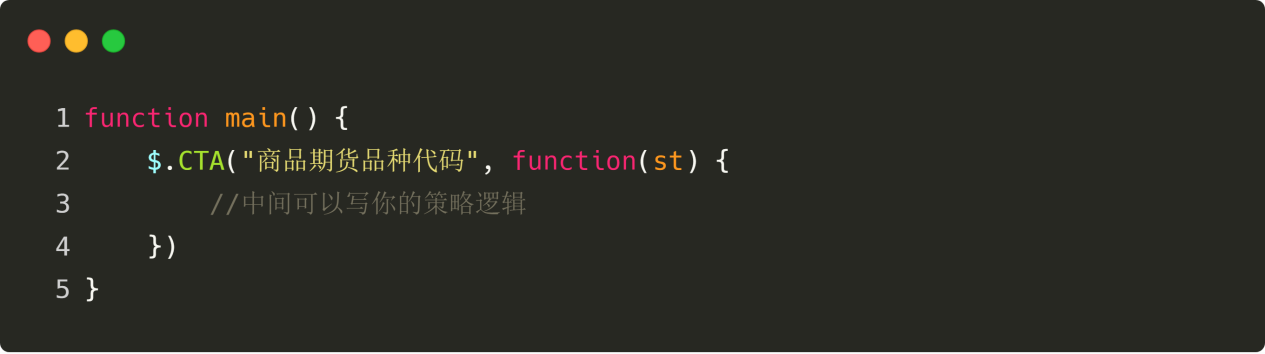 Figure 4 to 18
As in the code shown above, this is a standard policy framework, in addition to the fact that you can change the codebase of the commodity futures varieties, the rest is a fixed format. The biggest advantage of writing a policy using the framework is that you only need to write the strategy logic and you are done.
Summary
This is a quick introduction to the JavaScript language, and after learning it, you can program quantitative trading strategies. If you need to write more complex strategies, you can refer to the inventors of the JavaScript language API documentation.
The next section
Day trading is also a trading mode that does not hold overnight, so it is less exposed to the risk of market volatility and can be adjusted in a timely manner if an adverse market occurs. After learning an introduction to the JavaScript language in this section, we will help you write a workable day trading strategy.
After-school homework
1, try to get historical K-line data using the JavaScript language in the inventor's quantification tool. Try writing the policy code at the beginning of this section and write a commentary.
4.2 How to implement strategic trading in JavaScript
Summary
In the previous article, we explained the prerequisites for implementing a trading strategy from the point of view of JavaScript language introduction, basic grammar, CTA strategy framework, etc. In this article, we will continue the previous content, from commonly used strategy modules, technical indicators, step by step to help you implement a viable day-to-day quantified trading strategy.
Strategy briefing
The Bollinger band, also known as the Bollinger channel or BOLL, is one of the most commonly used technical indicators. It was invented by John Bollinger in the 1980s. In theory, prices always fluctuate up and down within a certain range of values.
It is calculated by using statistical principles, first calculating the standard deviation of the price of nickel over a period of time, and then using a straight line plus/minus 2 times the standard deviation of nickel, the price dependence interval. Its basic form consists of a band-like channel consisting of three tracks (mid-track, up-track, down-track).
The width of the BOLL channel is dynamically adjusted based on recent price movements; when it is small, the BOLL channel becomes narrower; when it is large, the BOLL channel becomes wider. When the BOLL channel becomes narrower, the price gradually returns to normal. When the BOLL channel becomes narrower, the market begins to change.
How to calculate the Blinking Belt Indicator
Of all the technical indicators, the method of calculation of the Blink band is one of the most complex, which introduces the concept of standard deviation in statistics, involving the calculation of the median line (MB), the upper line (UP) and the lower line (DN). Its calculation method is as follows:
Central railway= Simple moving average over N time periodsOn the tracks= mean + K × N standard deviationDown the tracks= mid-range − K × N standard deviation of the time interval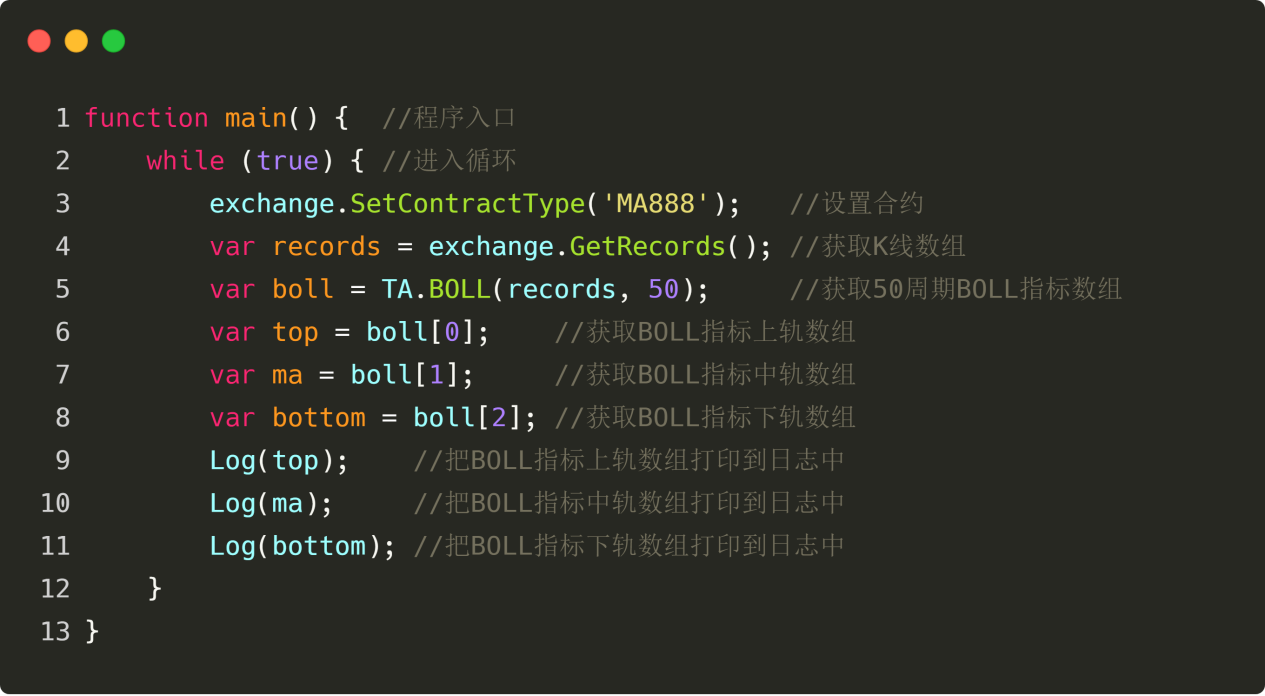 Figure 4 to 19
Strategic logic
There are many ways to use the Brin line, which can be used alone or in combination with other indicators. In this tutorial, we will use one of the simplest ways to use the Brin line. That is, when the price breaks out of the uptrend from the bottom up, that is, breaks the pressure line above, we think that the multilateral forces are strengthening, a bullish wave has formed, and a buy open position signal is generated;
- Quantifying Fundamental Analysis in the Cryptocurrency Market: Let Data Speak for Itself!
- Quantified research on the basics of coin circles - stop believing in all kinds of crazy professors, data is objective!
- The inventor of the Quantitative Data Exploration Module, an essential tool in the field of quantitative trading.
- Mastering Everything - Introduction to FMZ New Version of Trading Terminal (with TRB Arbitrage Source Code)
- Get all the details about the new FMZ trading terminal (with the TRB suite source code)
- FMZ Quant: An Analysis of Common Requirements Design Examples in the Cryptocurrency Market (II)
- How to Exploit Brainless Selling Bots with a High-Frequency Strategy in 80 Lines of Code
- FMZ quantification: common demands on the cryptocurrency market design example analysis (II)
- How to exploit brainless robots for sale with high-frequency strategies of 80 lines of code
- FMZ Quant: An Analysis of Common Requirements Design Examples in the Cryptocurrency Market (I)
- FMZ quantification: common demands of the cryptocurrency market design instance analysis (1)
- Nine trading rules that helped a trader go from $1,000 to $46,000 in less than a year
- 5.5 Trading strategy optimization
Hailhydra2Good article!
The vacuum is quantized mark