Inventors introduce quantitative trading - from the basics to the real world.
Author: Goodness, Created: 2019-06-25 15:48:58, Updated: 2023-10-31 21:01:08When the price breaks the support line, we think that the upper force is strengthening, a wave of a downtrend has formed, and a sell-off signal is generated. Figure 4 to 20
If the price falls back to the midline of the Bollinger band after buying the open position, we think that the multilateral force is weakening, or the overhand force is strengthening, and a sell-off position signal is generated; if the overhand position is sold, and the price falls back to the midline of the Bollinger band, we think that the overhand force is weakening, or the multilateral force is strengthening, and the buy-off position signal is generated.
Conditions of sale
Multi-headed:如果无持仓,并且收盘价大于上轨,并且时间非14:45 Opening the bargain:如果无持仓,并且收盘价小于下轨,并且时间非14:45 Multiple heads:如果持多单,并且收盘价小于中轨,或者时间是14:45 Standing on empty:如果持空单,并且收盘价大于中轨,或者时间是14:45
Implementation of the strategy code
In order to implement the strategy, we first need to consider what data we need, what API to use, how to calculate the transaction logic, and finally how to place the order.
Step one: Use the CTA strategy framework
The so-called CTA strategy framework is a set of standard frameworks officially introduced by the inventors of quantitative trading, using which the trivial problems of developing a quantitative trading strategy can be eliminated and the focus can be placed directly on programming trading logic. For example, if the framework is not used, it is necessary to consider the issues of monthly movements, purchase and sale prices, withdrawal or tracking of orders when they are not executed, etc.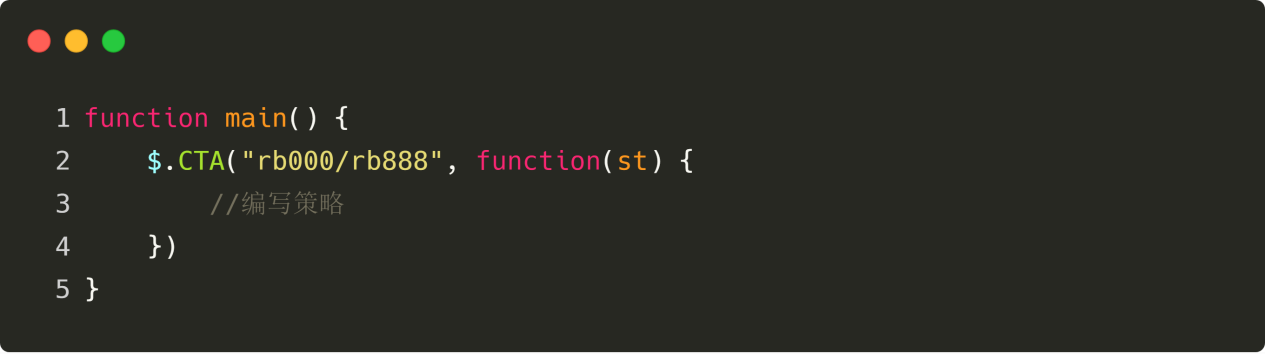 Figure 4 to 21
The above is the CTA policy framework using the inventor's quantification tools. It is a fixed code format, with all transactional logic code written from line 3 onwards. In use, no modifications are required elsewhere except for variation of the breed code (light yellow).
It is important to note that the variety code in the diagram above is
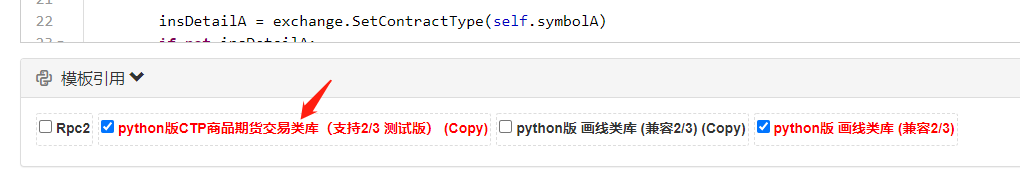
FMZ has a built-in JavaScript commodity futures trading class library that can be used in code by clicking directly on the policy editor interface: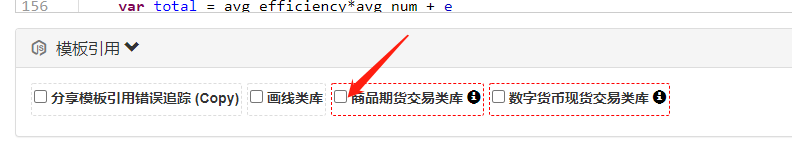
Step two: Get all the data
Think carefully, what data do we need? From our strategic trading logic, we find that we first need to get the current holding status, then compare the closing price to the correlation between the closing price and the downtrend on the Brin belt indicator, and finally judge whether the market is about to close.
Obtaining K-line data
The first thing to do is to get the K-line array and the upper root K-line closing price, because with the K-line array, you can calculate the Brynner band indicator.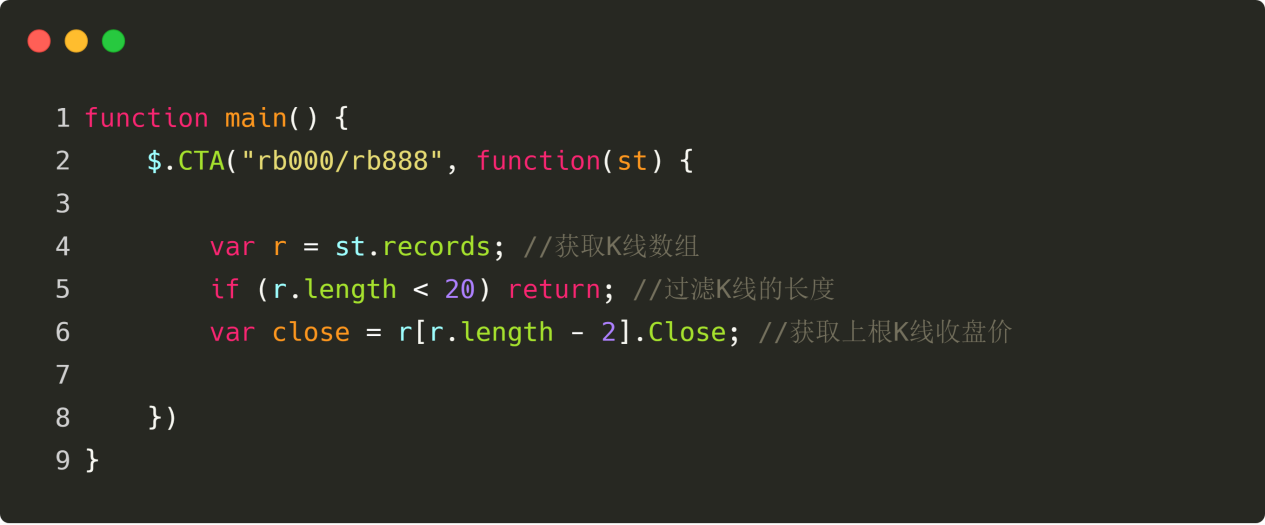 Figure 4 to 22
As shown above: Line 4: Get the array of K-strings, which is a fixed format. Line 5: Filter the length of the K-line, because the parameter we use to calculate the Braille band indicator is 20, it is not possible to calculate the Braille band indicator when the K-line is less than 20. Line 6: From the obtained K-line array, first obtain the object of the upper root K-line, and then obtain the closing price from this object. Get the second element of the inverse of an array, that is, the length of this array minus 2 ((r[r.length - 2]); The elements in the K-line array are all one object, the object contains the opening price, the highest price, the lowest price, the closing price, the transaction volume, the time, to obtain the closing price directly after the addition of the bar. The bar and the attribute name can be ((r[r.length - 2].Close)).
Get the K-line time data
Since we are a daily strategy, we need to level the position before closing, so to determine if the current K line is close to closing, if it is close to closing, we can level the position, if it is not close to closing, we can open the position.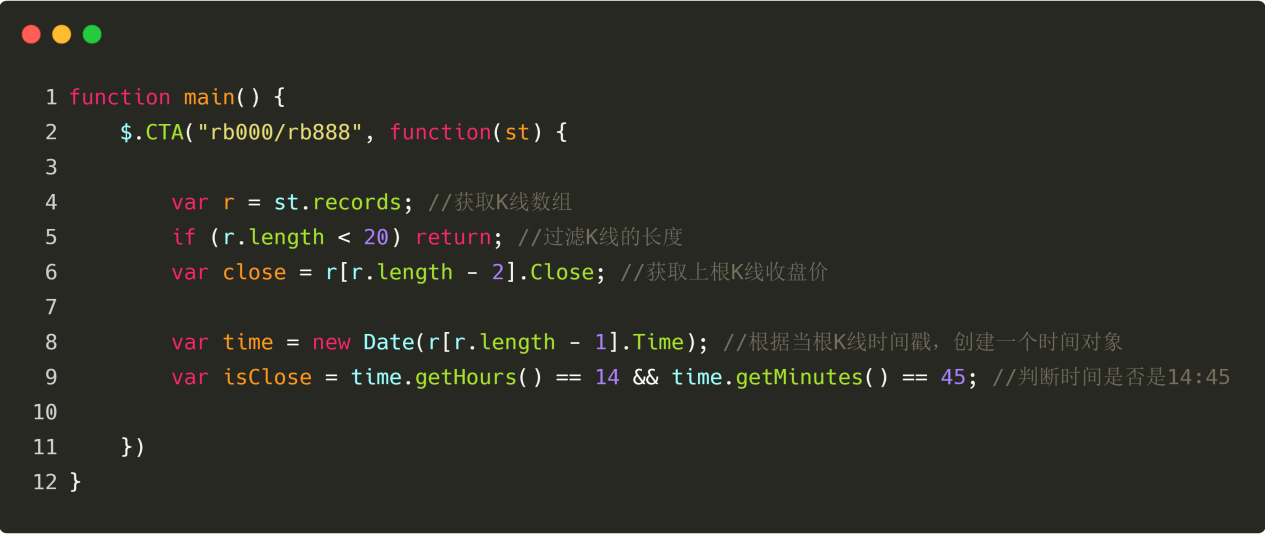 Figure 4 to 23
As shown above: Line 8: Obtain the timestamp property of the root K string and then create a time object ((new Date)). Line 9: According to the time object, calculate the number of hours and minutes, respectively, and determine if the time of the root K line is 14:45.
Obtaining stock data
Holding information is a very important condition in the quantitative trading strategy, when the trading conditions are established, it is also necessary to judge whether to place an order by the holding status and number of holdings. For example: when the trading conditions are established, if there is a holding, it is not necessary to place an order in repetition; if there is no holding, you can place an order.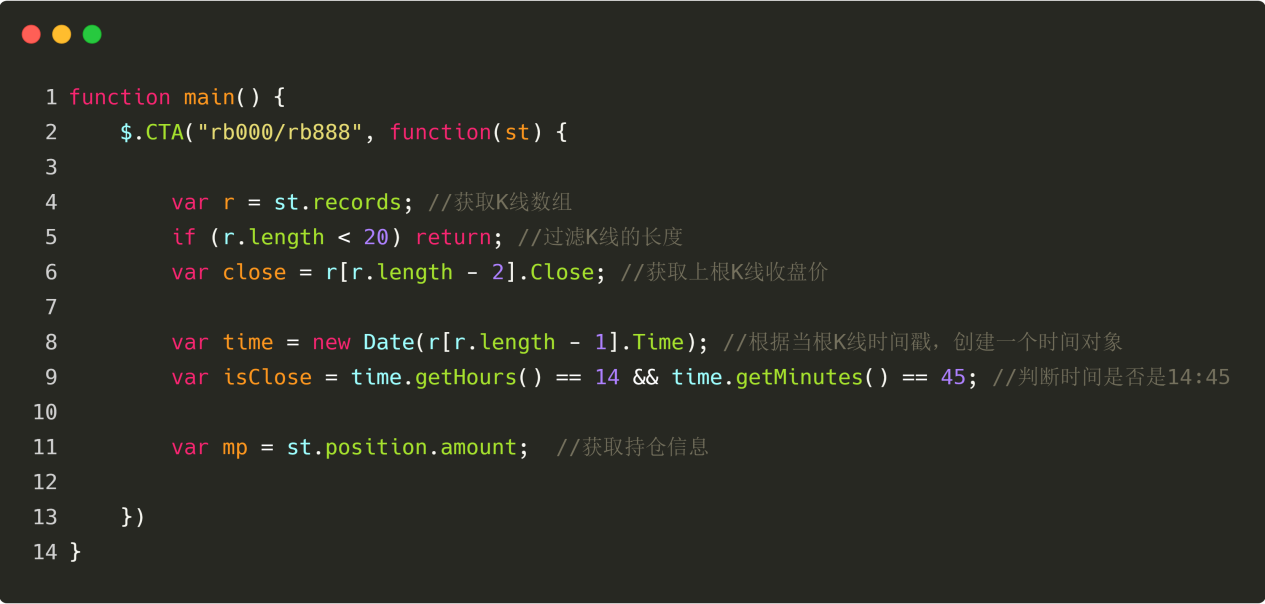 Figure 4 to 24
As shown above:
Line 11: Get the current holding status. If there are multiple orders, the value is 1; if there are empty orders, the value is 1; if there are no holds, the value is 0.
Figure 4 to 24
As shown above:
Line 11: Get the current holding status. If there are multiple orders, the value is 1; if there are empty orders, the value is 1; if there are no holds, the value is 0.
Get the data from the Brains
Next, it is necessary to calculate the values of the Blink-Band indicator on track, mid-track, and down-track. First, it is necessary to obtain the Blink-Band array, and to obtain the values of the up-and-down tracks from the array. In the inventor's quantization tool, obtaining a Blink-Band array is very simple, you can directly call the Blink-Band API.
A two-dimensional array is actually well understood, it is an array in an array, so the order of obtaining it is: first obtaining the specified array in the array, and then obtaining the specified element from the specified array, as shown in the figure below: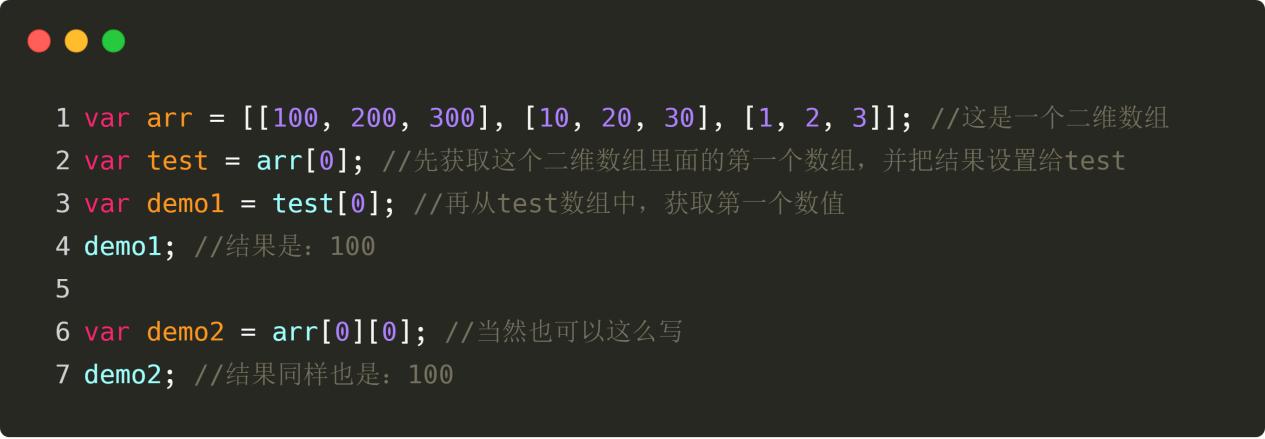 Figure 4 to 25
As shown below, the 13th to 19th rows are the values of the Braille band trajectories, median trajectories, and trajectories obtained by the code. The 13th line is the API directly using the inventor's quantification tool to directly obtain the Braille band array; the 14th to 16th rows are the upstream, midstream, and downstream trajectories obtained from the two-dimensional arrays; the 17th to 19th rows are the Braille band trajectories, median trajectories, and trajectories obtained from the upstream, midstream, and downstream trajectories of the upstream K-root arrays, respectively.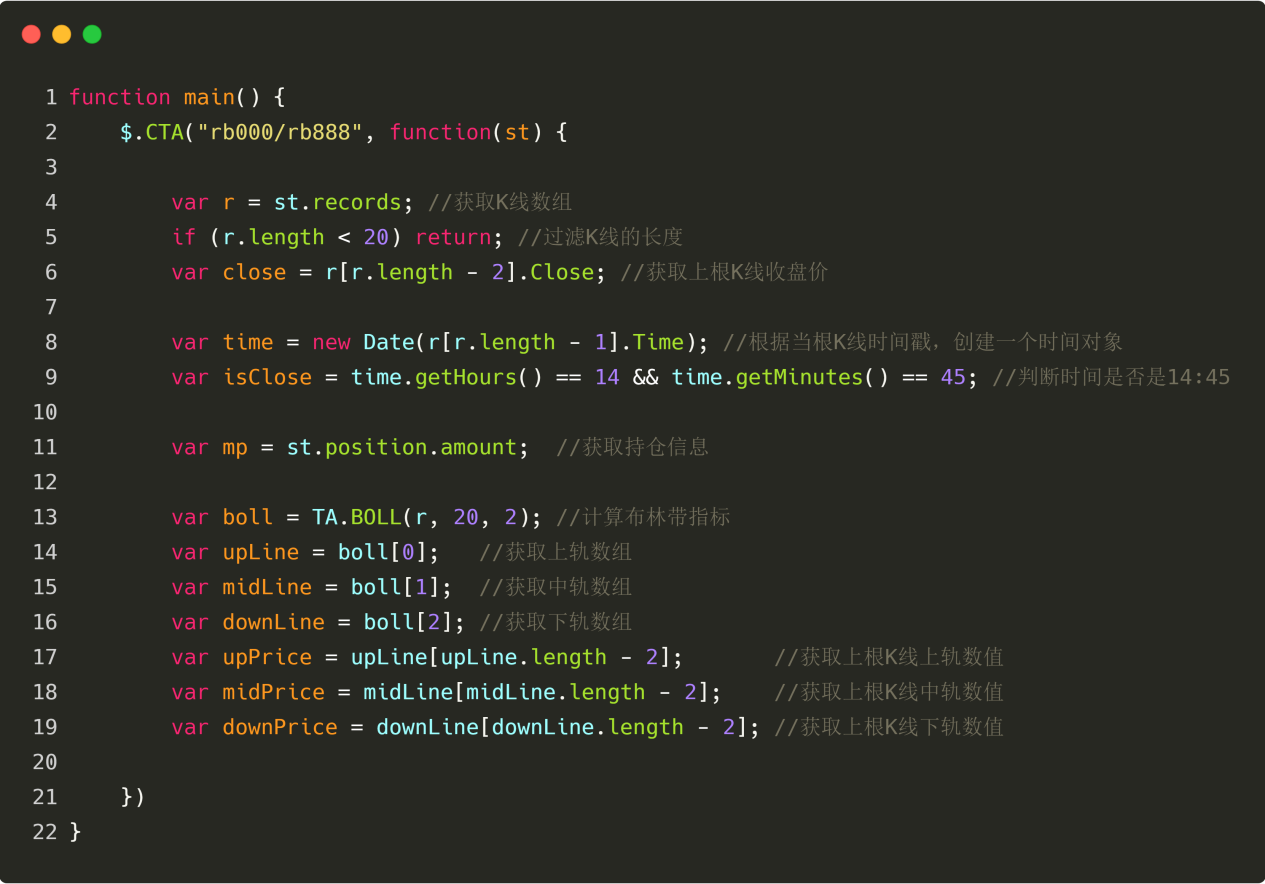 Figure 4 to 26
Step 3: Order the deal
With the above data, it is possible to write the transaction logic as well as the code for the ordering of transactions. The format is also very simple, the most commonly used is the if statement, which can be described as: if condition 1 and condition 2 are established, order; if condition 3 or condition 4 is established, order.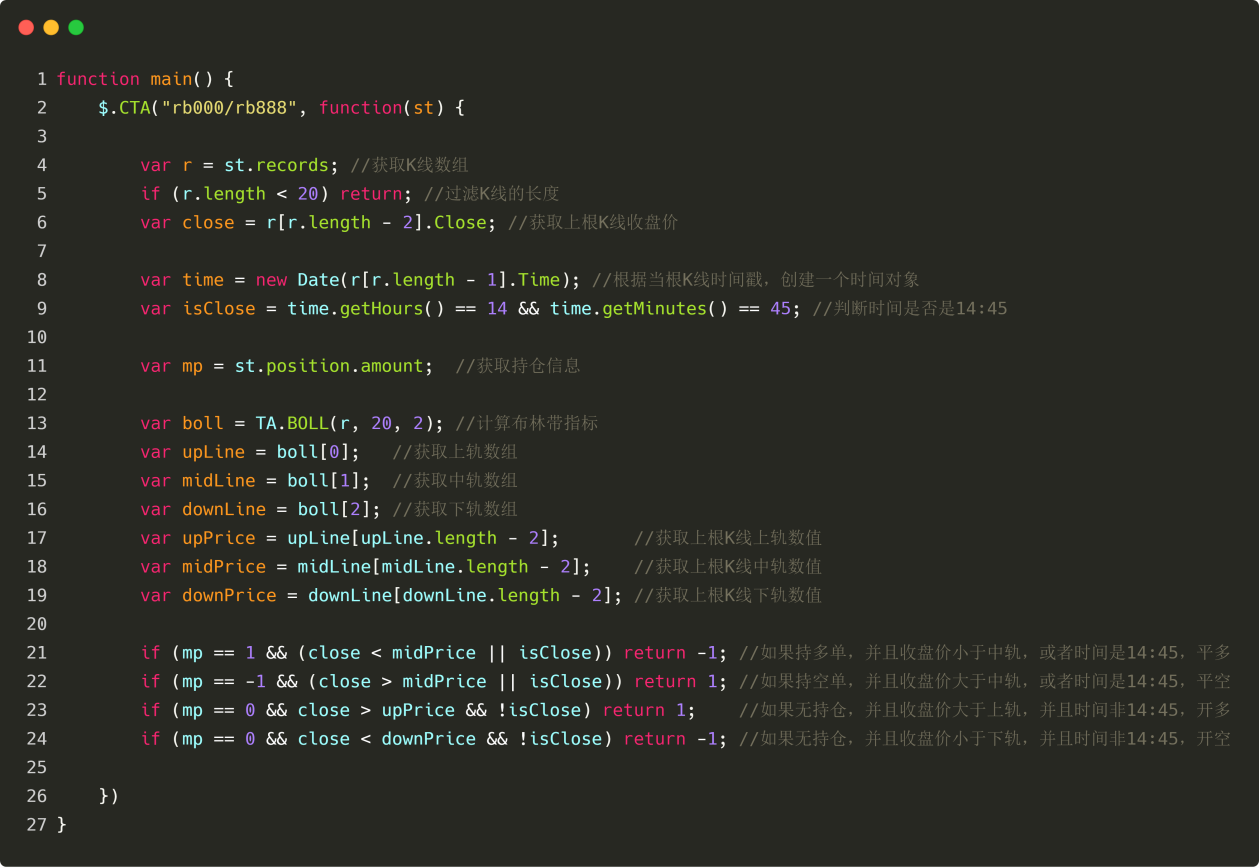 Figure 4 to 27
In the diagram above, the 21st to 24th lines are the trading logic and the code for the next order. From top to bottom, they are: odd, even, odd, open.
For example, this is a string if statement string, in which the parenthesis string {} can be omitted if only one line of code is executed. The statement translates to: if the current hold is 0, and the closing price is greater than the overtrack, and the line time is not 14:45, then the string returns 1 ton.
If you look carefully, you may notice that these lines have a return 1 and a return -1 and this is a fixed format, which means: if bought, write return 1; if sold, write return −1.
Full code of the strategy
If you write a complete strategy code, and if you separate the trading framework, the trading data, the trading logic, the buy and sell order, etc. is it not simple to write it, here is the complete code of the strategy: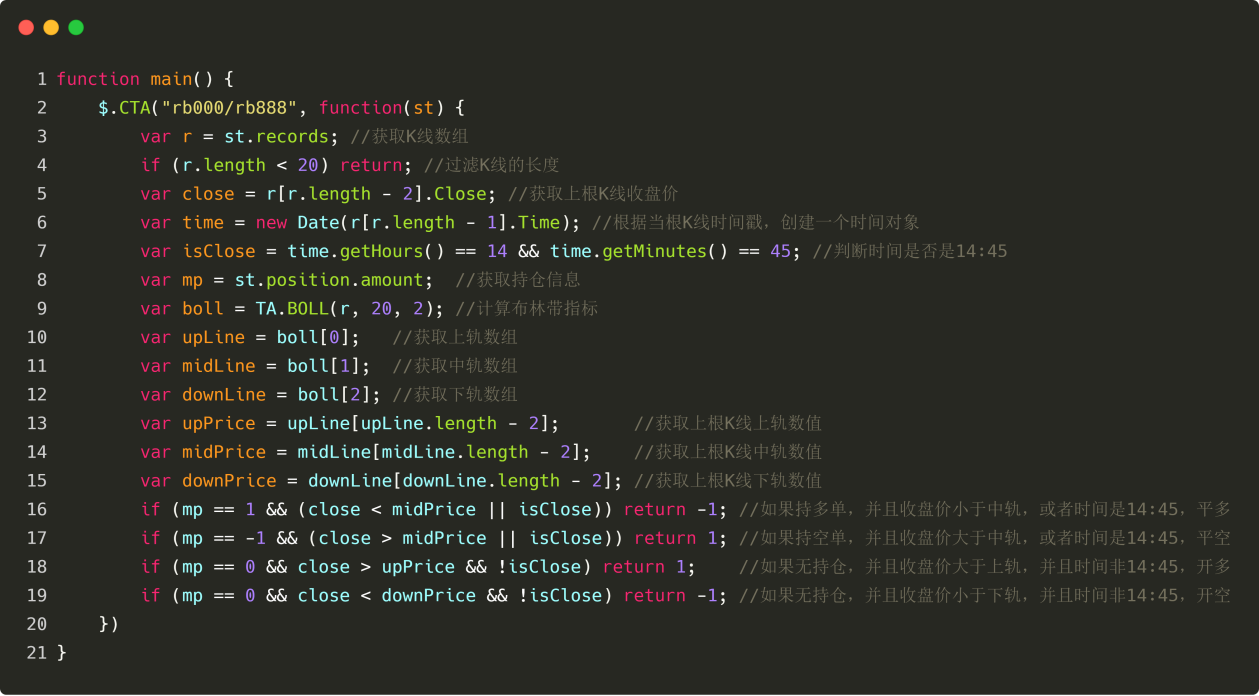 Figure 4 to 28
There are two places to pay attention to: try (but not necessarily) to write the strategy logic as if the root K-line conditions were established, the lower root K-line was issued, or the upper root K-line conditions were established, so that the results of this retest are not very different from the results of the real disk. It is also possible to write this way, but it is important to pay attention to whether the strategy logic is correct. In general, write the logic of the placement in front of the opening logic, the purpose of doing this is to try to make the strategy logic meet your expectations.
Summary
Above we have learned every step of developing a complete intraday quantized trading strategy, including: strategy overview, methods for calculating the Brainstorm indicator, strategy logic, buy and sell conditions, strategy code implementation, etc. Through this strategy case, not only is the inventor familiar with the programming method of the quantized tools, but also different strategies can be adapted based on this template.
Quantitative trading strategies are nothing more than a summary of subjective trading experience or systems, and you will find it much easier to write a strategy if we write the experience or system used in subjective trading, one by one, before writing the strategy. Try it!
The next section
In the development of quantitative trading strategies, if only one programming language can be chosen, then do not hesitate to choose Python, from data acquisition to strategy feedback to transactions, Python has covered the entire business chain.
After-school homework
Try to implement a two-pronged strategy using the knowledge in this section. 2, try to implement the KDJ pointer algorithm using the JavaScript language in the inventor's quantification tool.
4.3 A quick introduction to the Python language
Summary
In the development of quantitative trading strategies, if only one programming language can be chosen, then do not hesitate to choose Python, from data acquisition to strategic feedback to transactions, Python has covered the entire business chain.
Why learn so many programming languages
Looking back at the previous classes, we learned together: Mac language, visualization language, JavaScript language, including Python language, which we are going to learn in this section. Some of you may be wondering, why do I have to learn so many programming languages to learn quantitative trading?
In fact, each programming language has its own language characteristics, and these languages have no advantages and disadvantages, it is more to see which programming language is more suitable for the strategy, and whether the programming language is suitable for you.
At the same time, we are committed to opening the doors of quantification to everyone, spreading the knowledge of all programming languages, quantification is not as deep and unreachable as we imagine, and we believe that in the future quantification will be universal and civilized.
Why choose Python for quantitative trading
In terms of data analysis, no other language can be as precise and efficient as Python. Especially in time-series analysis, Python has the advantage of simplicity and convenience. In addition, Python is more concise and easy to learn than other programming languages.
Five reasons to choose Python
1. Quantification is widely used:
Quantipian in the United States and inventors in the country can quantify using Python.
2. Easy to learn:
Python's design philosophy is user-centric, and it belongs to the interpretive language that is easy to debug.
3. Free and open source:
Free of use costs, open source code sharing, enhanced learning and use efficiency.
4. The rich library:
This is the first time that the company has been able to offer its services in the field of data processing, data processing, visualization, statistical analysis, technical analysis, machine learning, etc.
5. The application interface:
The platform data is accessed through an interface that stores calls and real-time transaction links.
The full strategy
To help you quickly understand the main points of this section, before introducing the inventors of the Quantified JavaScript language, let's have a preliminary understanding of the concept of nouns in this section.
Multi-headed: if there is no position at the moment, and the 5-cycle averagely is greater than the 20-cycle averagely.Opening the bargain: if there is no position at the moment, and the 5-cycle averagely is less than the 20-cycle averagely.Multiple heads: if the current holds multiple orders, and the 5-cycle average is less than the 20-cycle average.Standing on empty: if the current hold is empty, and the 5-cycle average is greater than the 20-cycle average.
If you write it in Python, it looks like this: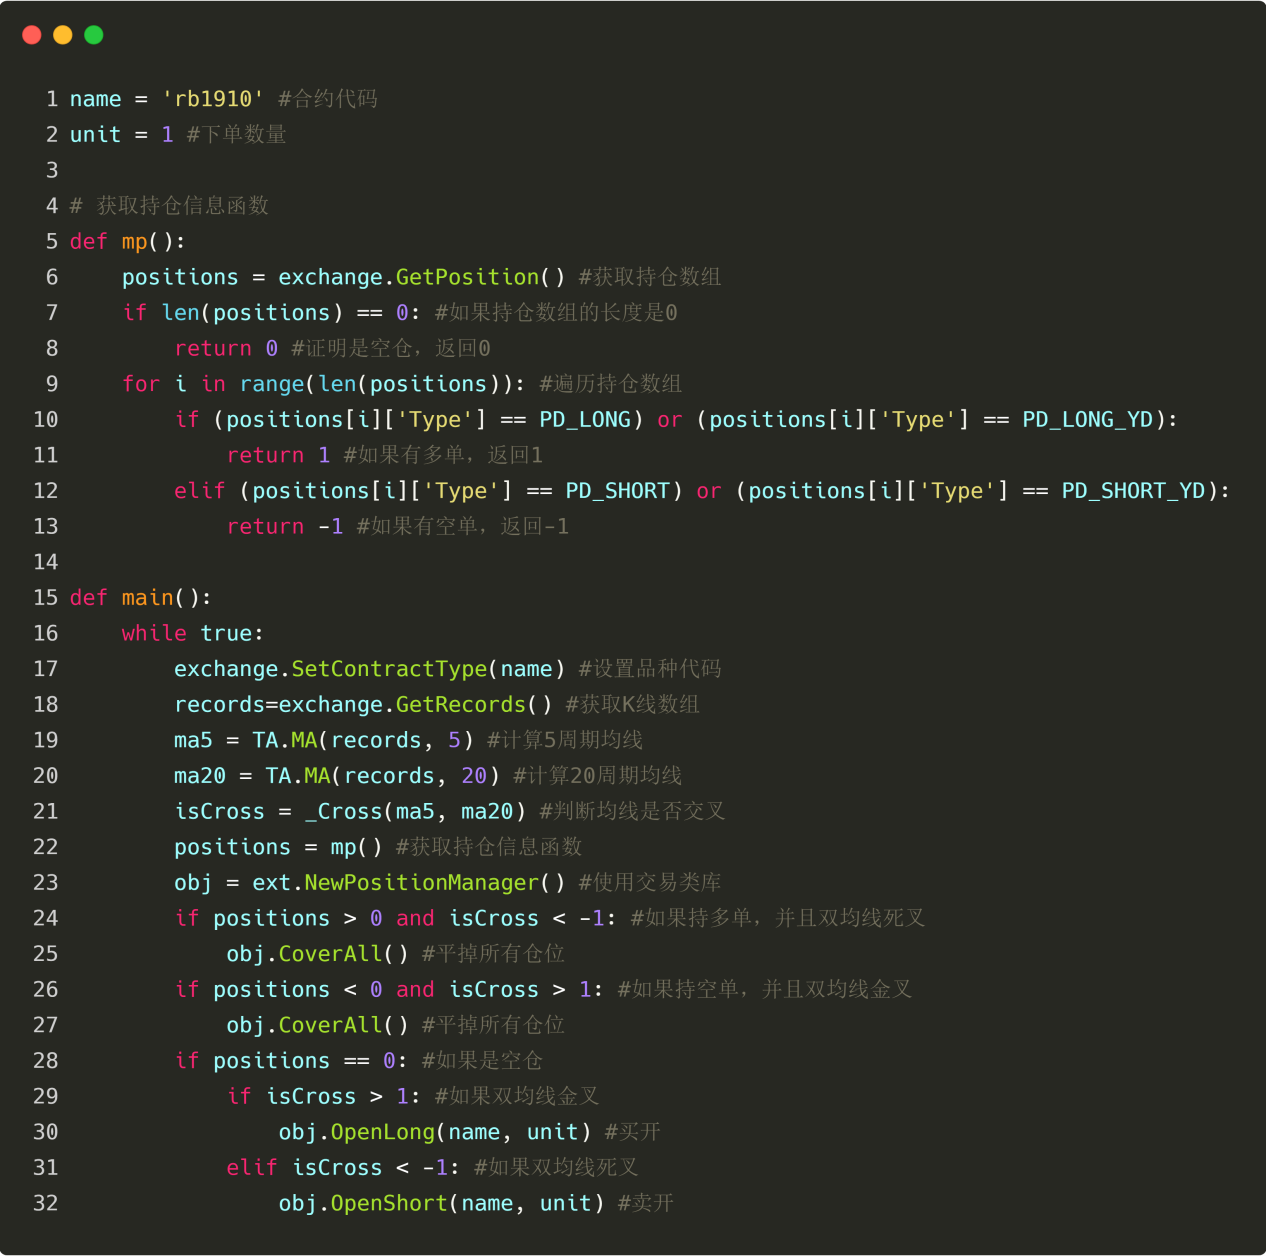 Figure 4 to 29
The code in the diagram above is a complete quantitative trading strategy written in Python. It can be run on a real disk and automatically order trades. In terms of code, Python is more than JavaScript because we don't use the CTA trading framework.
But the whole strategy design process is pretty much the same: set up the market variety, get the K-line data, get the holdings information, calculate the trading logic, buy and sell the order. That is, while the programming syntax is different, the written strategy logic is the same, so next, let's learn the basic syntax of Python!
Selection of versions
There are two versions of Python: Python 2 and Python 3. There was a passage that said that Python is like a double-barreled gun, but you can only fire a bullet with one barrel at a time, but you never know which one is more accurate. So if you are new to Python, it is recommended to learn Python 3 directly, because it is the latest and the Python community has been maintaining it.
Identifier
The identifier is the name of the variable, as shown in the following diagram test, test10, test10, and test10.demo etc. Everything in Python (variables, function names and operators) is capitalized, i.e. the variable name test and the variable name test are two different variables. The first character of the identifier (variable, function, property, function parameter name) must be a letter, a hyphen.The following table shows the number of characters that can be followed by the number of digits: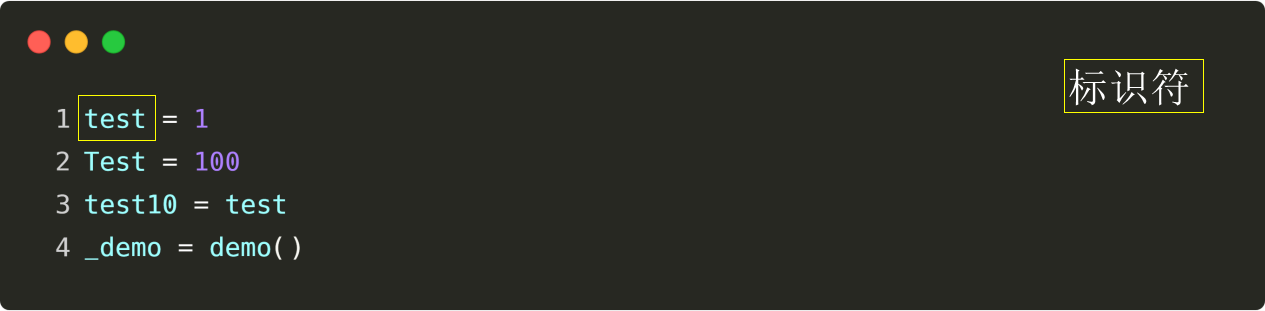 Figure 4 to 30
Notes
An annotation is a translation or interpretation of a line of code whose rules are very simple, including both single-line annotations and block-level annotations. A single-line annotation begins with a well number ((#), a block annotation begins with three single quotes (( Figure 4 to 31
Line and contraction
The most distinctive feature of Python is the use of shrinking to represent code blocks, without the need to use a capital bracket {}. The number of shrink spaces is variable, but the statements of the same code block must contain the same number of shrink spaces. As shown below: in this case, the program will return an error. Even if the condition is valid, it will not output a true string, because Python automatically checks the correct syntax of the code before running the code, and if the code format is wrong, the program will not run.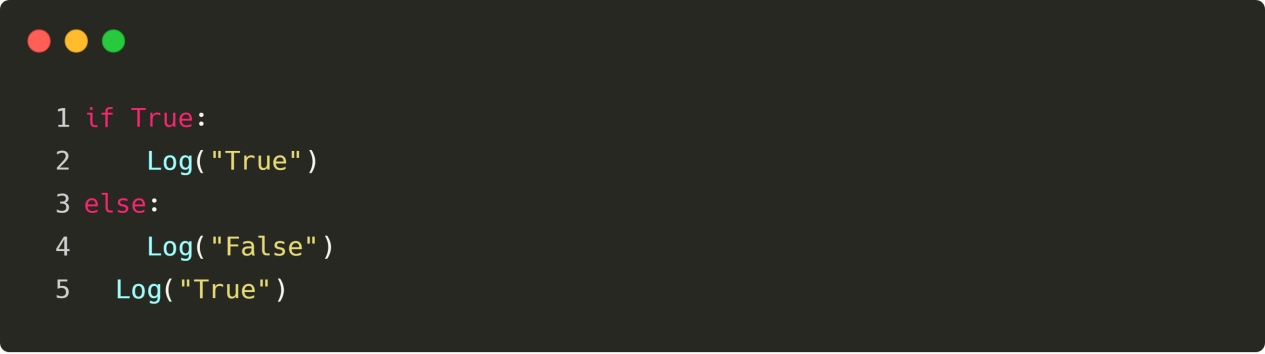 Figure 4-32
Variable
Variables can be stored with any type of data, and the name of the variable is created directly, but the value of the variable must be set at the same time as the variable is created, otherwise the program will return an error. The equals sign on the left of the operator is a variable name, and the equals sign on the right of the operator is a value stored in the variable.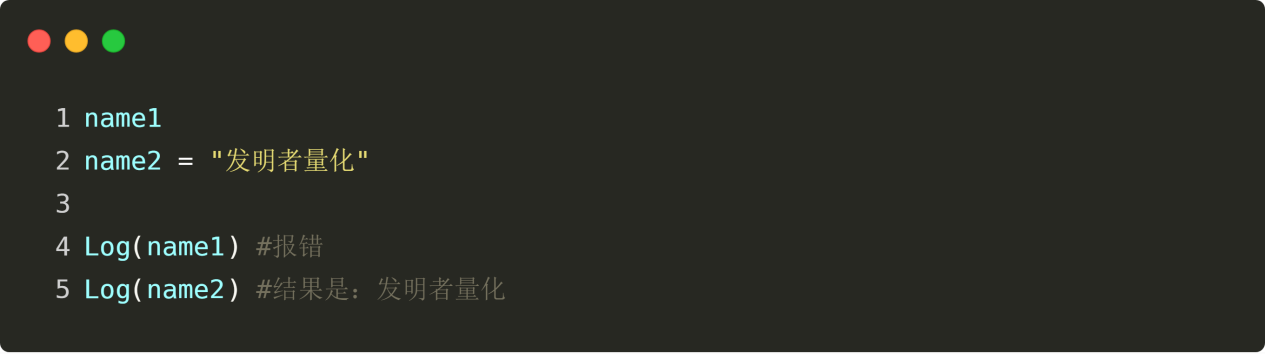 Figure 4 to 33
The data
Python has six data types, of which three are invariant data and three are variable data. As the name implies, once invariant data is created, its value cannot be changed and the address in memory is unique; variable data is a reference to an address in memory whose memory address remains unchanged if its value changes.
Invariable data ((3)): Number ((number)) ∞ String (∞ string) ∞ Tuple (∞ array);
Variable data ((3)): List ((list) ), Dictionary ((dictionary) ), Set ((collection) );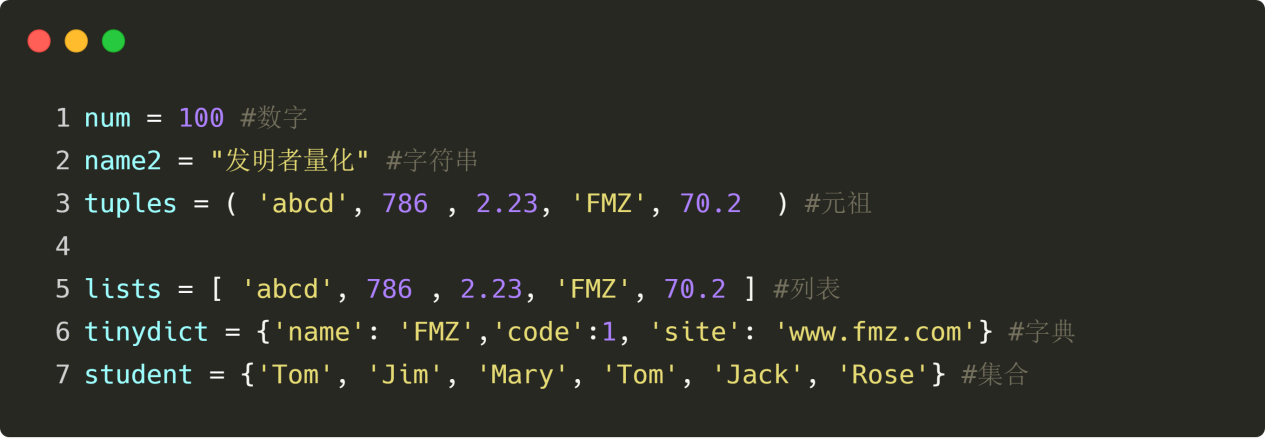 Figure 4 to 34
Numbers
Python's numeric types support int (integer), float (floating point), bool (bool), complex (plural) and built-in type (type) functions that can be used to query the object type of a variable.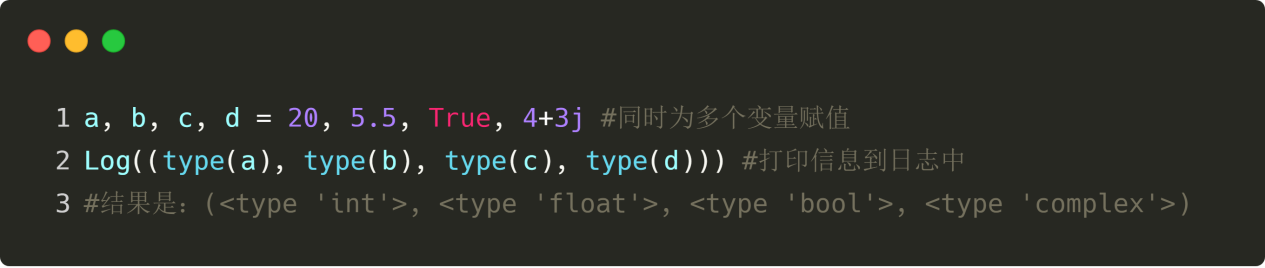 Figure 4 to 35
The operator
As with most languages, the mathematical operations in Python are very intuitive. Both arithmetic operators, comparison operators and logical operators are the same as we know in school. The arithmetic operator is a mathematical operation of addition and subtraction, comparing two values to see if they are less than or equal to each other. Figure 4 to 36
Note that:
Priorities
If there is an expression 100* ((10-1) / ((10+5)), which step of the program is the first to be computed? Secondary mathematics tells us: (1) If it is the same level of operation, it is usually done in left-to-right order. (2) If there is both addition and subtraction and multiplication, multiply first. (3) If there are parentheses, the parentheses are in parentheses. (4) If the operation law is met, the operation law can be used to reduce. Figure 4 to 37
Boolean value
The Boolean type represents true and false, and is commonly used in conditional and looping statements. Python defines two constants for true and false. In fact, any object can be converted to a Boolean type or used directly for conditional, as shown in the figure below: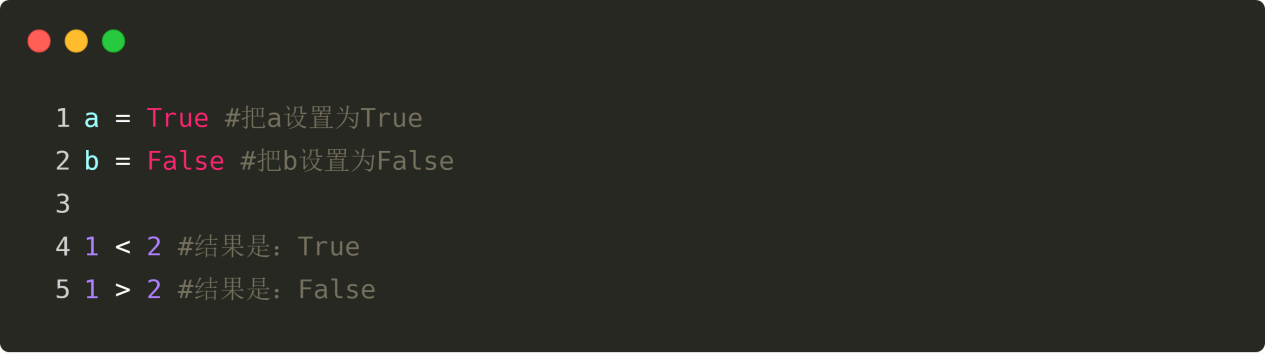 Figure 4 to 38
String
A string is a text, which is often used in the setup of variety codes, such as  Figure 4 to 39
List of
Lists are the most frequently used data type in Python, and you can think of a list as a container, except that the elements in the container are arranged in a left-to-right order, with the first element being 0, the second element being 1, and so on. Additionally, lists in Python can store any data type, as shown in the figure below: Figure 4 to 40
Function
There is no essential difference between Python functions and our middle school functions, you can understand what is passed in and what is output through the computation of the function, as shown in the following diagram: Figure 4-41
if statements
If statements are a common occurrence in our lives, such as: I'll bet if it rains today. That is, the statement will only execute code when the specified condition is True. Note, pay attention to the condensed format of the code, otherwise it will generate Python errors! Figure 4-42
If...else phrase
If...else statements are also commonly used statements, such as: If it rains today, I bet; otherwise, I don't bet.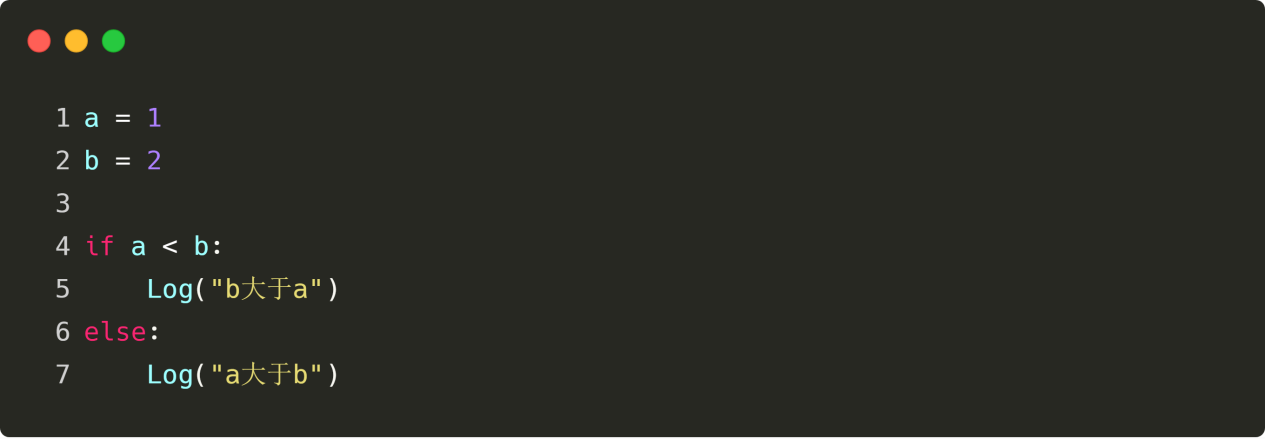 Figure 4-43
Elif phrase
Since python does not support switch statements, Python can only implement elif statements when judging multiple conditions. For example: if it is a sunbeam, I see more; otherwise, if it is a tinbeam, I see blank; otherwise, I observe.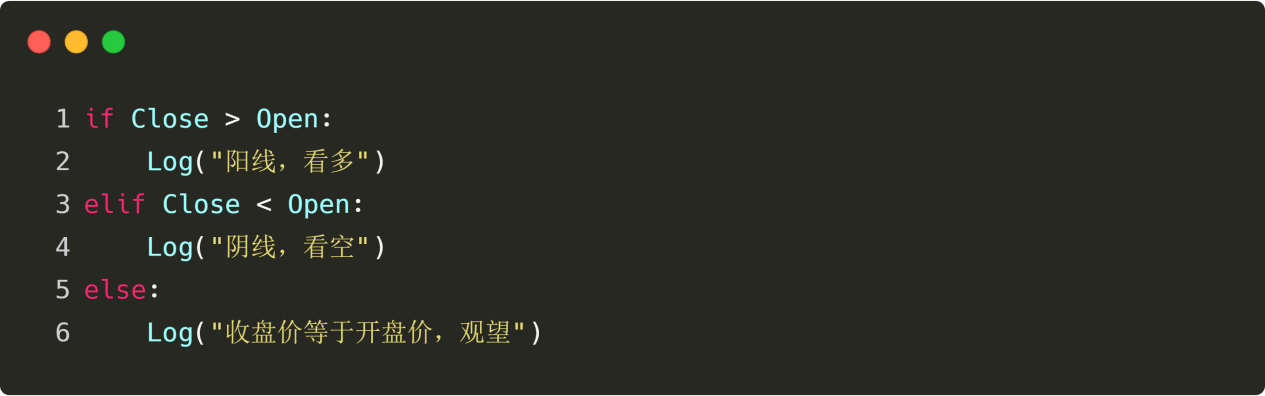 Figure 4-44
for cycle
Sometimes we need to get the data of the K-line of the most recent days, and we need to get it from the K-line array, according to the location of the K-line data, then using the for loop is very convenient, as shown in the following diagram: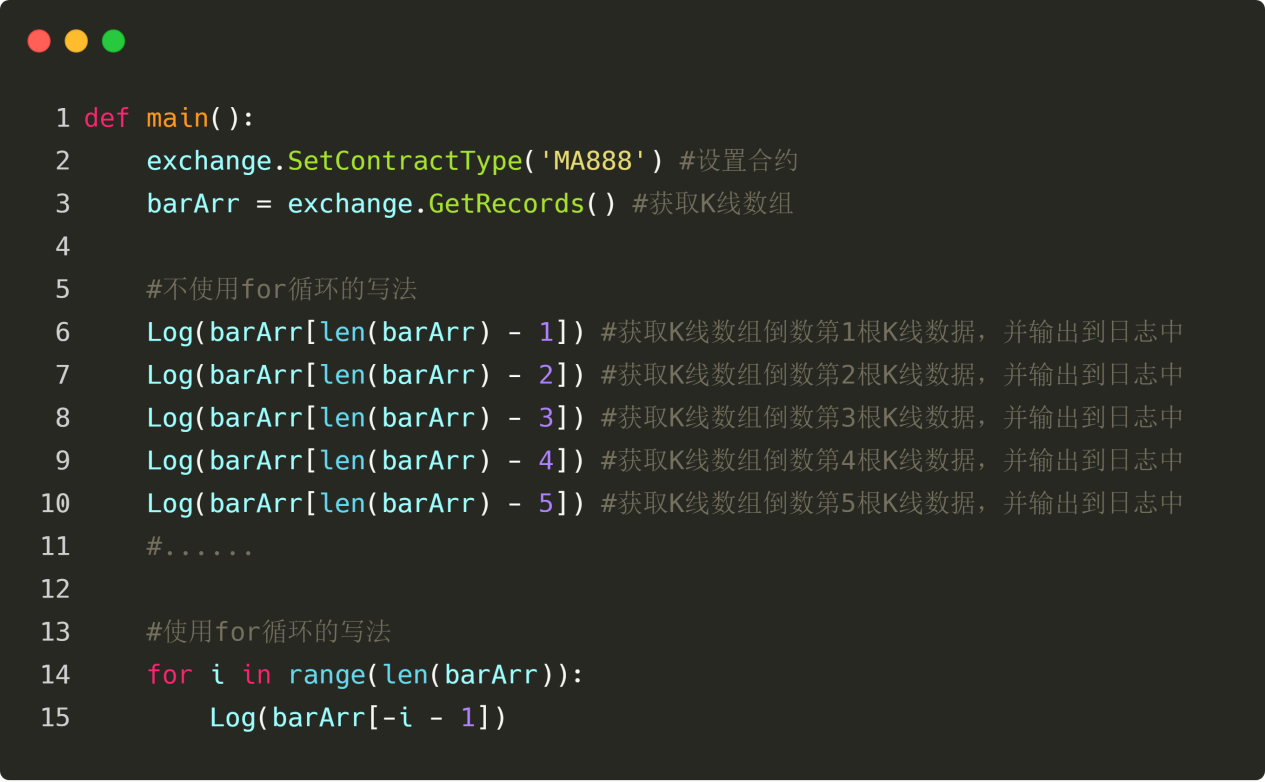 Figure 4 to 45
while loop
We all know that the market is constantly changing, and if you want to get the latest K-line arrays, you have to run the same code over and over again, then using a whilex loop, the loop can always get the latest K-line arrays as long as the condition is true.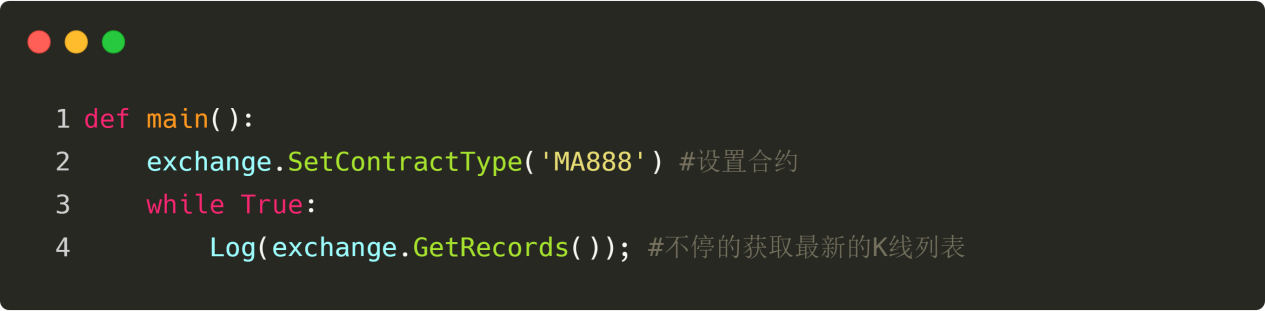 Figure 4-46
break and continue sentences
The loop is conditional, and the loop starts doing something repeatedly only when the condition is true, and the loop ends when the condition is false. However, break statements can jump out of the loop immediately while the loop is executed; continue statements can interrupt a loop and then continue the next loop, as shown below: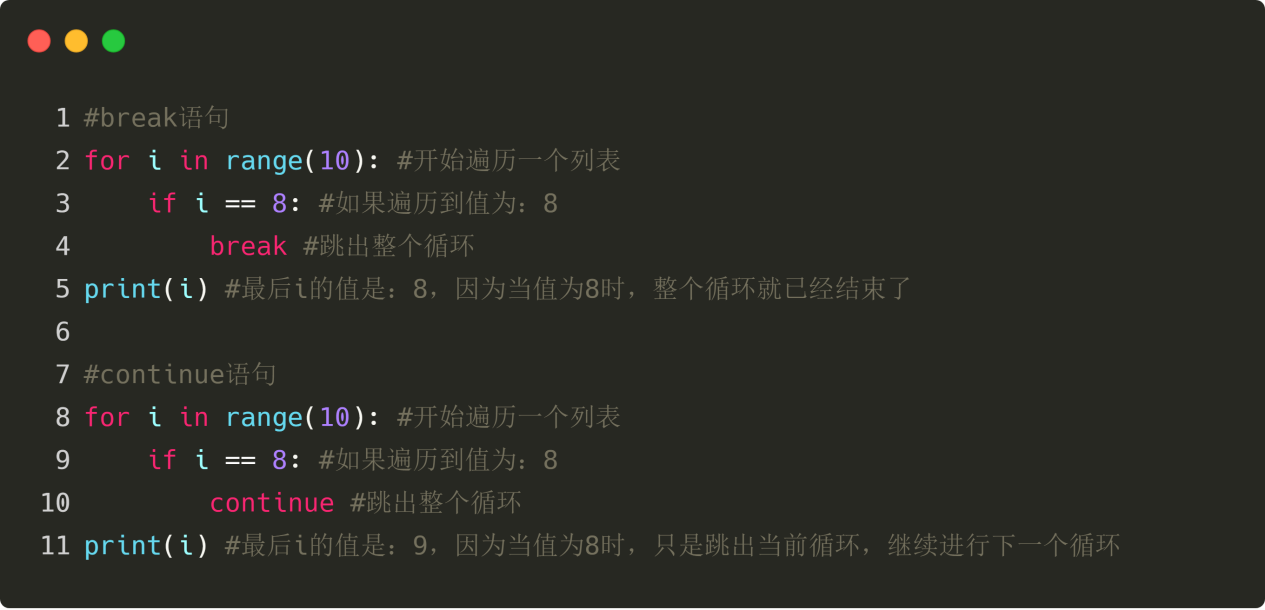 Figure 4-47
return statements
The return statement terminates the function's execution and returns the value of the function. The return statement can only appear within the function body, and any other appearance in the code will cause a syntax error!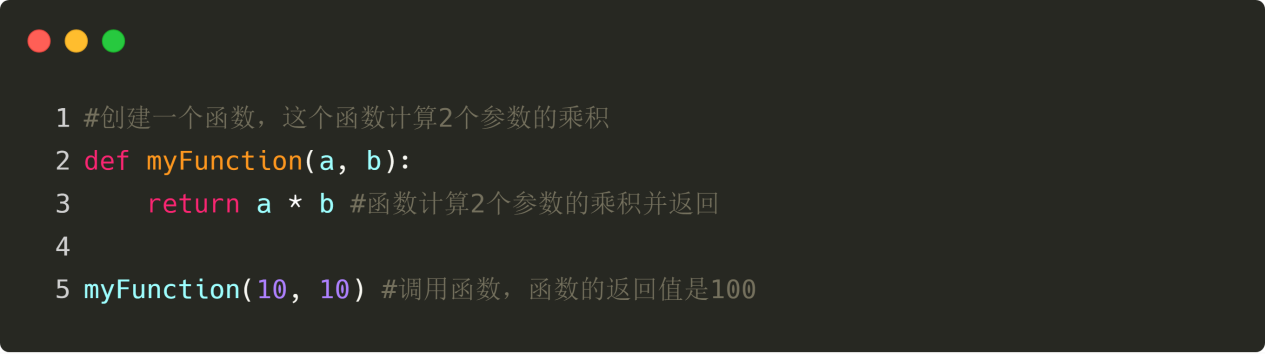 Figure 4-48
Strategic architecture
Strategy architecture can be understood as a fixed format of the strategy, the inventor of the quantification tool uses a consultation model, the classic commodity futures strategy architecture.
Line 4 - 7 is the main input function of the whole program, that is, the computer executes the code starting from line 4, then directly executes line 5 and enters an infinite loop; then executes the onTick and sleep logic functions in an infinite loop; onTick is also the first line of code, you can write the logic in line 2; we know that in the loop, the execution rate of the program is very fast, so using the sleep function can pause the session, and the next generation of code Sleep (500) is every cycle, falling asleep 500 milliseconds.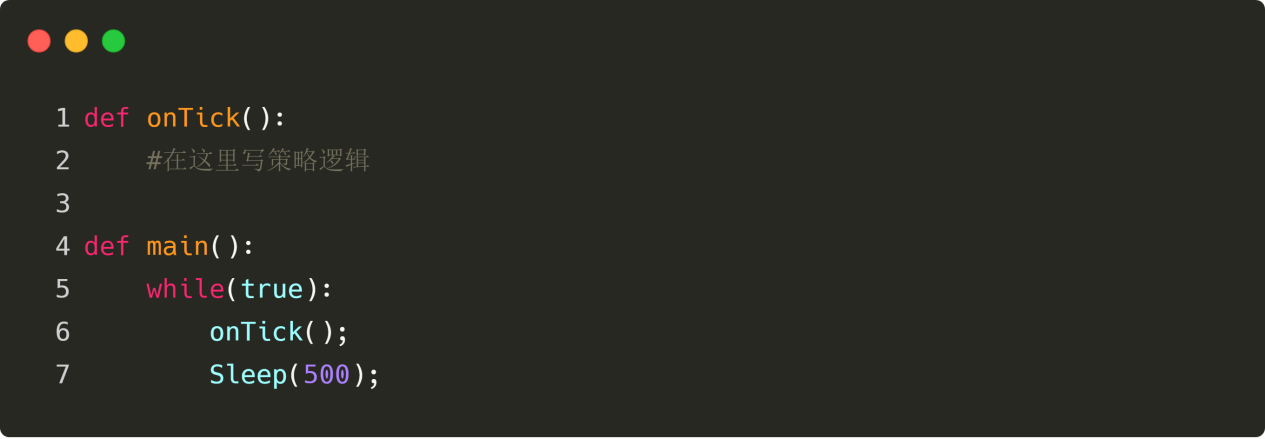 Figure 4-49
Summary
This is a quick introduction to the Python language, although it is only a simple basic knowledge, but it is okay to write a simple quantitative trading strategy. If you need to write more complex strategies, you can refer to the inventors of the Python language API documentation.
The next section
In the field of technical analysis, trend-class strategies are undoubtedly divided into the two main categories: average and channel breakouts. Although the goal is to capture the trend of price movements, the trading philosophy and risk characteristics of the two strategies are very different.
After-school homework
1, try to get historical K-line data in the Python language in the inventor's quantification tool. Try writing the policy code at the beginning of this section and write a commentary.
4.4 How to implement strategic trading in Python
Summary
In the last post we learned about the Python language introduction, basic grammar, strategy framework, etc. Although the content is boring, it is a necessary skill for you to implement a trading strategy, and it is necessary to learn. Then in this post we will take the heat and continue with the previous Python basics, starting from a simple strategy, learning side by side, step by step to help you implement a viable quantified trading strategy.
Strategy briefing
Of the many trading strategies, the Dongguan channel strategy is probably one of the most classic breakthrough strategies, having been popularised as early as 1970, when foreign-owned firms conducted simulation tests and research on mainstream programmatic trading strategies. The results showed that the Dongguan channel strategy was the most successful of all strategy tests.
Later, in the United States, another training of the most famous mermaid traders in the history of trading took place, which was a huge success. The mermaid's trading methods were secret at the time, but it was more than a decade later that the mermaid trading laws were made public, and it was discovered that the mermaids were using an improved version of the Don Quixote channel strategy.
The most common type of breakout trading strategy is to use the relationship between price and the relative position of support and resistance to determine the point of purchase and sale of a particular trade. The Dongjian channel strategy in this section is based on this principle.
Don Quijote's rules of conduct
The Dongqian channel is a trend indicator, with a slightly similar appearance and signal to the Braille band. However, the Dongqian price channel is built on the basis of the highest and lowest prices in a periodic interval. For example, when calculating the maximum value of the highest price of the most recent 50 K-lines, a trajectory is formed; when calculating the minimum value of the lowest price of the most recent 50 K-lines, a trajectory is formed. The indicator consists of a curve of 3 different colors, the default is the highest and lowest price in 20 cycles to show the volatility of the market price, when its channel is narrow indicates the market volatility is smaller, and the reverse channel width indicates the market volatility is larger.
If the price breaks above the trajectory, it is a buy signal; conversely, if the price breaks below the trajectory, it is a sell signal. Since its up and down trajectory is calculated by the highest and lowest prices, in general, prices rarely rise and fall simultaneously on the up and down channel lines. In most cases, prices move along the up or down trajectory unilaterally, or between the up and down trajectories.
How to calculate the Dongjian tunnel
In the inventor's quantification tool, the method of calculating the Dongjian channel is simple, and can be used directly to obtain the highest price or the lowest price within a specified cycle, as shown in the following figure: line 5 is the maximum value of the highest price of 50 cycles, line 6 is the minimum value of the lowest price of 50 cycles.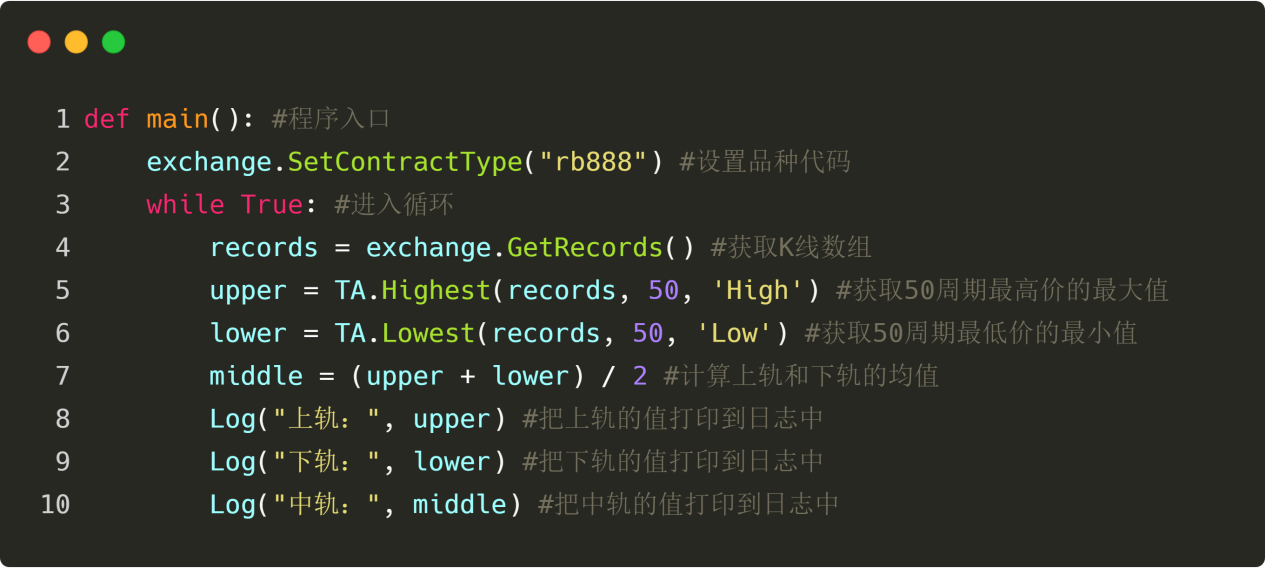 Figure 4 to 50
Strategic logic
There are many ways to use the Dongguan channel, which can be used alone or in combination with other indicators. In this section, we will use the simplest method of use. That is, when the price breaks through the uptrend from the bottom, i.e. breaks through the upper pressure line, we think that the multilateral forces are strengthening, a wave of uptrend has formed, which generates a buy and sell signal; when the price breaks through the downtrend from the top, i.e. breaks the support line, we think that the uptrend is strengthening, a wave of downtrend has formed, which generates an open position signal. Figure 4-51
If the price falls back to the middle of the Dongguan channel after the buy-in, we think that the multilateral forces are weakening, or the air force is strengthening, and a sell-off signal is generated; if the price falls back to the middle of the Dongguan channel after the sell-off position, we think that the air force is weakening, or the multilateral forces are strengthening, and the buy-out signal is generated.
Conditions of sale Multi-headed: If there is no holding, and the closing price is higher than the going rateOpening the bargain: If there is no holding and the closing price is below the trajectoryMultiple heads: If you hold more orders and the closing price is lower than the mid-rangeStanding on empty: If you have a blank bill and the closing price is higher than the average
Implementation of the strategy code
The first step in implementing the strategy is to get the data first, because the data is a prerequisite for the trading strategy, imagine what data we all need? and how to get this data? then calculate the trading logic based on this data; finally, with the trading logic buy and sell transactions.
Step one: Use the transaction library
You can think of a trading library as a functional module, and the advantage of using a trading library is that you can focus on writing strategy logic. For example, when we use a trading library, we can open a trade directly using the following API in the trading library; but if we don't use a trading library, we need to access the price of the trade, we need to consider the issue of returns but not transactions, we need to consider the issue of withdrawals, etc.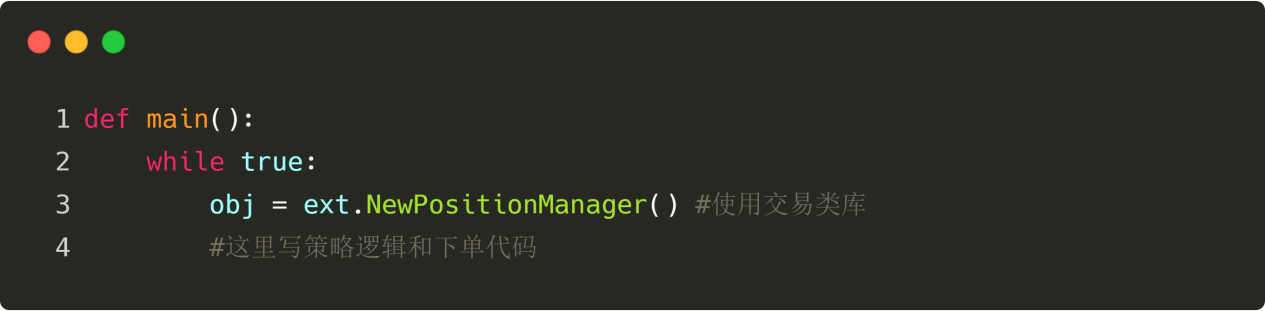 Figure 4-52
The above is the CTA policy framework using the inventor's quantification tools. It is a fixed code format, with all transactional logic code written from line 4.
The template library for JavaScript is built in, and Python needs to copy and save this template:https://www.fmz.com/strategy/24288◦ Then, on the policy edit page, select References. You can also complete a policy without using the template library.
Step two: Get all the data
Think carefully, what data do we need? From our strategic trading logic, we find that we first need to get the current holding status, then compare the closing price to the correlation between the closing price and the downtrend on the Brin belt indicator, and finally judge whether the market is about to close.
Obtaining K-line data
The first step is to get the K-line array and the current K-line closing price, because with the K-line array, you can call the API to get the highest or lowest price of N cycles.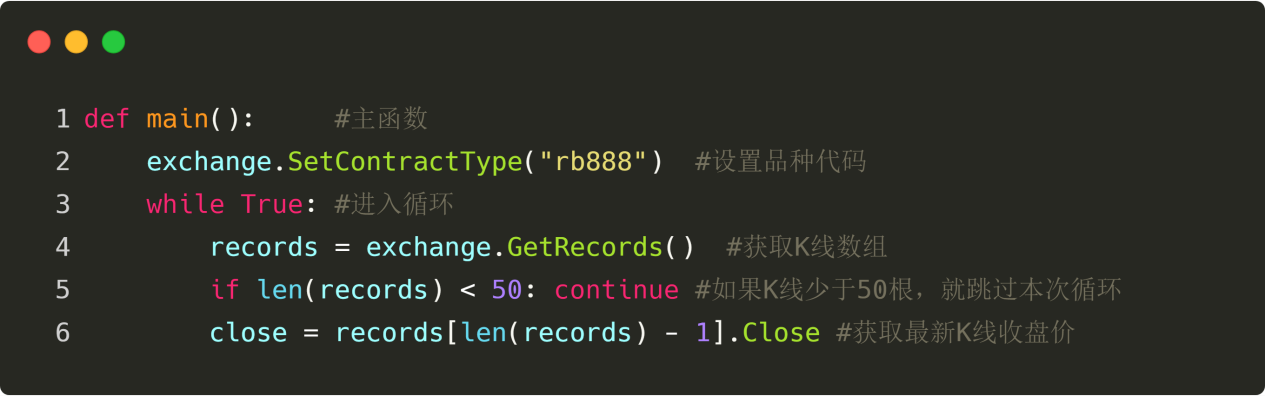 Figure 4-53
As shown above:
Line 4: Get the array of K-strings, which is a fixed format.
Line 5: Filter the length of the K-line, because we are calculating the highest or lowest price of N cycles, the parameter used is 50, and when the K-line is less than 50 bits, it cannot be calculated. So here to filter the length of the K-line, if the K-line is less than 50 bits, skip this loop and continue waiting for the next K-line.
Line 6: We use the code len ((records - 1) to get to the last data of the K-line array, the latest K-line data. This data is an object that contains: opening price, highest price, lowest price, closing price, volume, time, etc. Since it is an object, we use the link directly. Close key is to get the latest K-line closing price.
Figure 4-53
As shown above:
Line 4: Get the array of K-strings, which is a fixed format.
Line 5: Filter the length of the K-line, because we are calculating the highest or lowest price of N cycles, the parameter used is 50, and when the K-line is less than 50 bits, it cannot be calculated. So here to filter the length of the K-line, if the K-line is less than 50 bits, skip this loop and continue waiting for the next K-line.
Line 6: We use the code len ((records - 1) to get to the last data of the K-line array, the latest K-line data. This data is an object that contains: opening price, highest price, lowest price, closing price, volume, time, etc. Since it is an object, we use the link directly. Close key is to get the latest K-line closing price.
Obtaining stock data
Holding information is a very important condition in the quantitative trading strategy, when the trading conditions are established, it is also necessary to judge whether to place an order by the holding status and number of holdings. For example: when the conditions for buying and opening a trade are established, if there is a holding, it is not necessary to place an order in repetition; if there is no holding, it can be placed.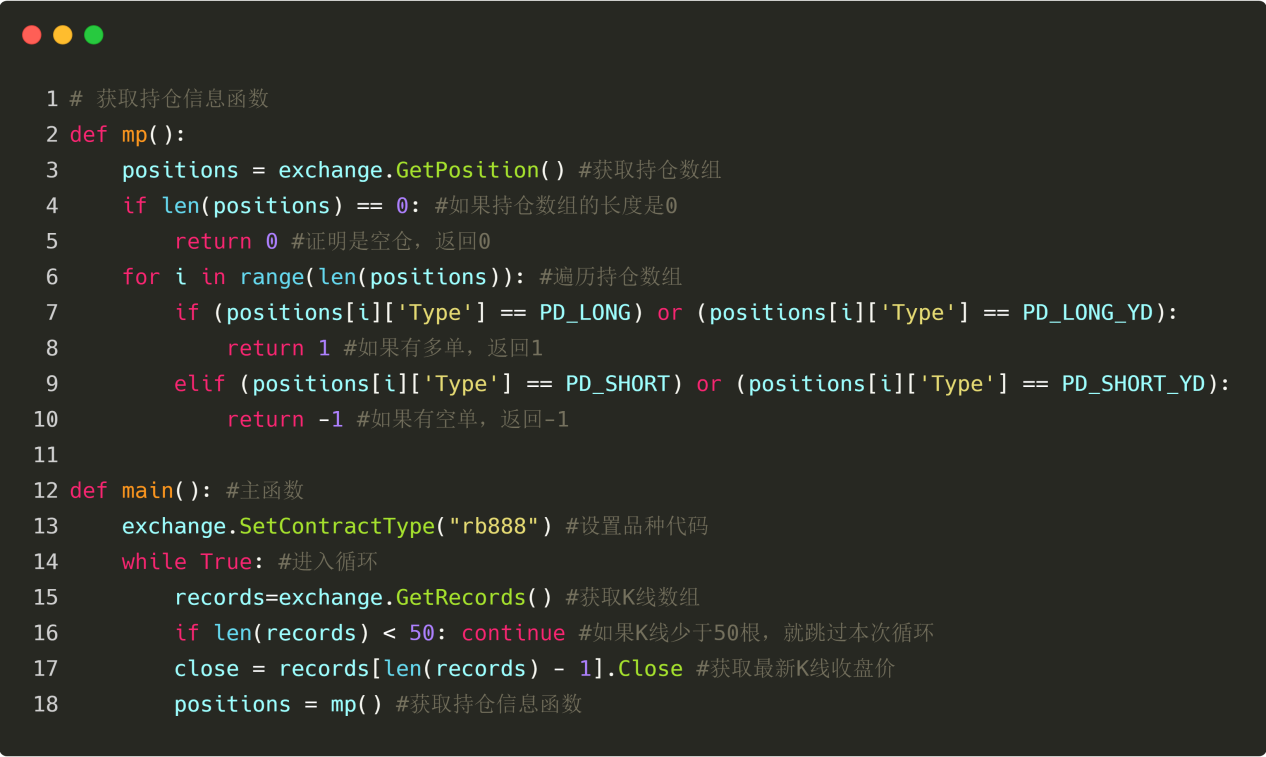 Figure 4-54
As shown above: This is a function that retrieves hold information, returning 0 if the hold is empty; 1 if the hold is multiple; and -1 if the hold is empty. Note the code above: Line 2: Create a function named mp, which has no parameters. Line 3: Acquire a stored array, which is a fixed format. Line 4: Determine the length of the array of the storage, if its length is equal to, it must be empty storage, so it returns 0. Line 6: Use the for loop to start traversing the array, and the next logic is very simple: if you hold multiple numbers, you return 1; if you hold empty numbers, you return −1. Line 18: Call the access to stored information function mp, which you just wrote.
Get the highest and lowest prices for the most recent 50 K lines
In the inventor's quantification tools, the TA.Highest TA.Lowest TA.Lowest functions can be obtained directly using the TA.Highest TA.Lowest functions without having to write the logic calculations themselves. And the TA.Highest TA.Lowest TA.Highest TA.Lowest functions return the result of specific values rather than arrays.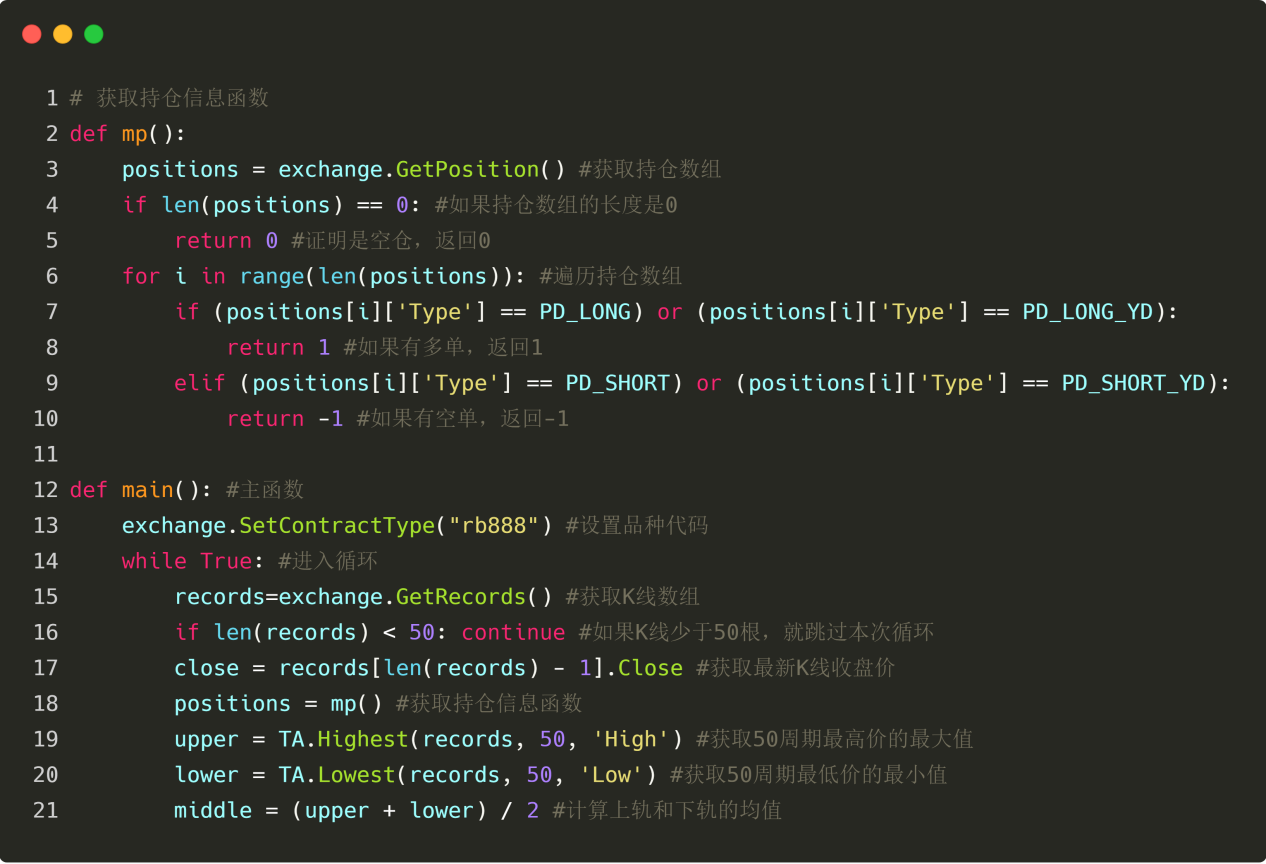 Figure 4-55
As shown above: Line 19: Call the TA.Highest hash function to get the maximum value for the highest price of 50 cycles Line 20: Call the TA.Lowest function to get the minimum value of the 50 cycle lowest price Row 21: Average calculated from the maximum value of the highest price of 50 cycles and the minimum value of the lowest price of 50 cycles
Step 3: Order the deal
With the above data, it is possible to write the transaction logic as well as the code for the ordering of transactions. The format is also very simple, the most commonly used is the if statement if, which can be described as: if condition 1 and condition 2 are established, order; if condition 3 or condition 4 is established, order.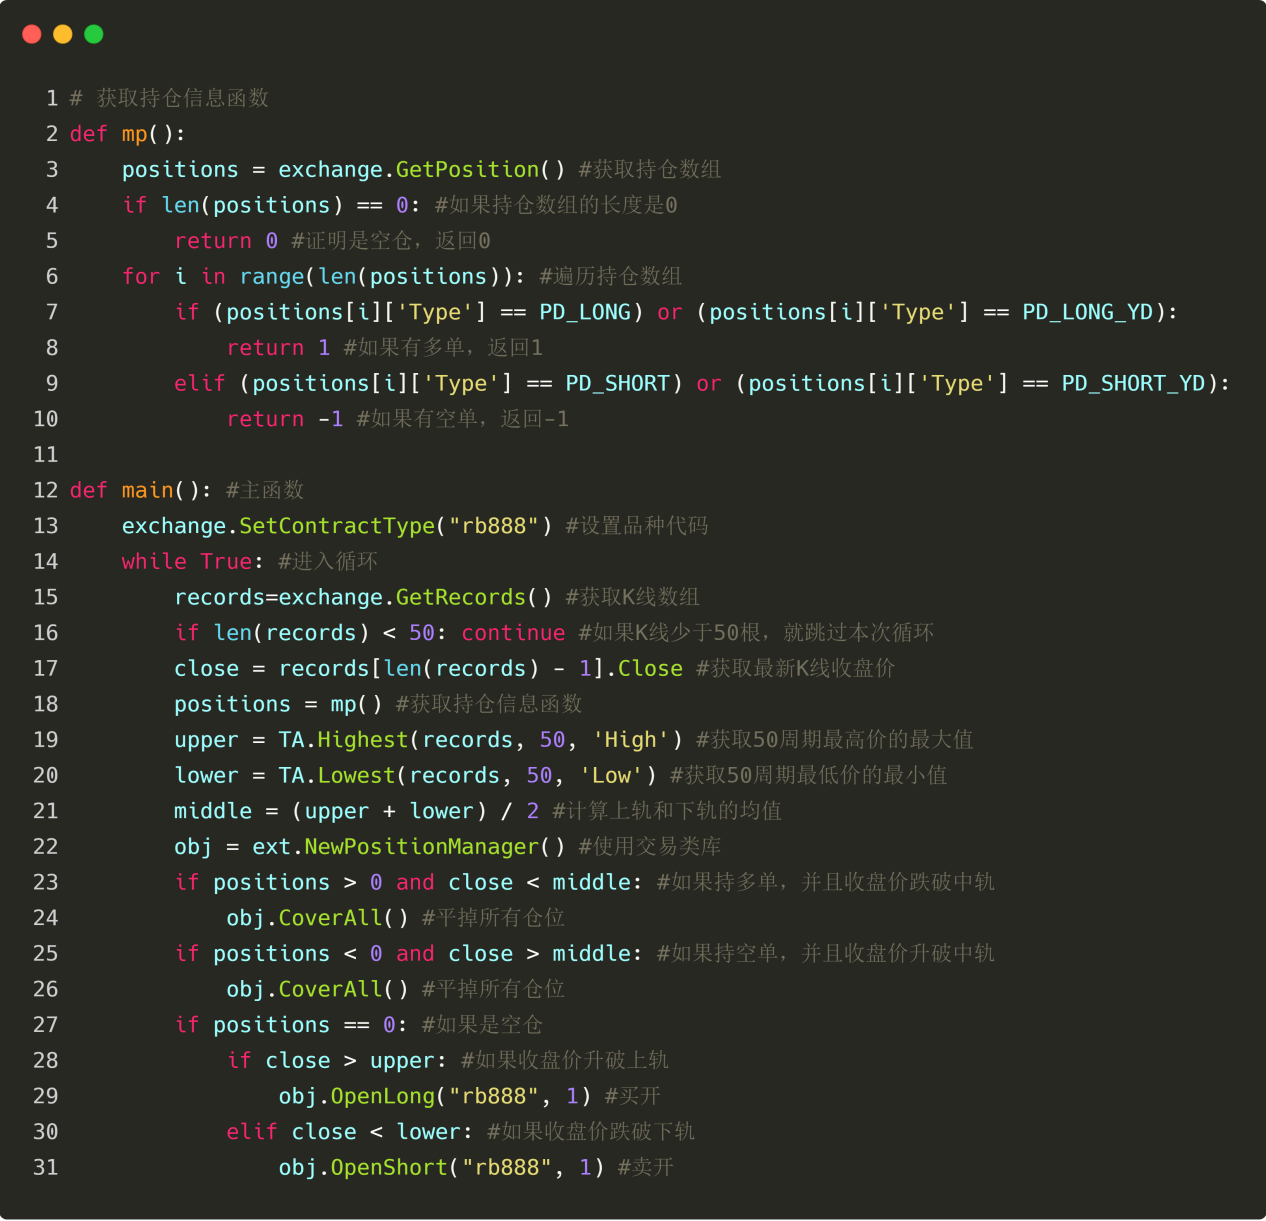 Figure 4-56
The following is a graphic: Line 22: Use a transaction class library, which is a fixed format Rows 23 and 24: This is a plain polynomial statement that uses the conjecture we learned earlier, that if you have multiple orders and the closing price is less than the mid-range, all positions will be tied. Rows 25, 26: This is a statement for a blank order, which uses the hash comparison and hash logic functions we learned earlier, meaning that if the current order is blank and the closing price is greater than the mid-range, all positions are evened. Line 27: Judge the current holding status and proceed to the next step if the stock is empty. Lines 28 and 29: Judge whether the closing price is higher than the uptrend, and buy the open position if the closing price rises above the uptrend. Lines 30 and 31: Judge whether the closing price is below the downtrend, and sell the open position if the closing price falls below the downtrend.
Summary
In this section, we have learned every step of developing a complete quantitative trading strategy in Python, including: strategy overview, method of calculation of Dongjian channel, strategy logic, bid and offer conditions, strategy code implementation, etc. This section is just a simple strategy, as a throwing dice, there is more than one method, you can overlay different trading methods according to your trading system, thus forming your own quantitative trading strategy.
The next section
In the development of quantitative trading strategies, from the perspective of programming language execution speed, it is only C++ that can be said to be the fastest language. Especially in the field of derivatives and high-frequency trading, C++ is unique language specific, C++ has an advantage in numerical computation, which can increase the speed several orders of magnitude compared to JavaScript and Python.
After-school homework
1. Starting from the beginning, implement the strategy of this section. Try adding a straight-line indicator to the strategy in this section, reducing the frequency of trading.
Chapter 5: Strategic review, debugging and improvement
5.1 Meaning and pitfalls of retesting
Summary
Re-testing is where quantitative trading differs most from traditional trading, based on actual market data that has occurred in history, rapid simulation of strategy signals triggered and captured trades, yielding performance reports over a period of time, etc. For domestic and foreign markets such as stocks, commodity futures, foreign exchange, etc. are one of the most important components of strategy development.
The Meaning of Reassessment
In the previous chapter, we learned the basics of the mainstream programming languages, and taught how to use these basics to write some simple trading strategies. However, once a strategy is written, it is definitely not directly playable, and it also requires continuous re-testing, debugging, debugging, etc. until the strategy can fully implement the model content and can run smoothly.
From the perspective of quantitative trading logic, strategy is based on a set of perceptions and assumptions about the market, and retesting can efficiently determine whether these assumptions are valid and stable. In times of historical uncertainty, what kind of losses may be incurred and help make decisions to prevent these losses.
In addition, from a quantitative trading operation perspective, retesting can help detect bugs in strategy logic, such as future functions, steal prices, multiple fit, etc. It provides reliable evidence that a strategy can be used for real-time trading.
- The validation of the transaction signals.
- Check the logic of the transaction and whether your idea works.
- Discover flaws in the trading system and improve the original strategy.
The meaning of retesting, therefore, is to restore the actual trading process to as true a state as possible through historical data, to verify the effectiveness of the strategy, to avoid paying a costly price for the wrong strategy, and to help us screen, improve, and optimize the trading strategy.
The Trap of Retesting
The signal flashes when the traps are detected:
The trading strategy is based on static historical data when retested; whereas the actual trading data is dynamic. For example, if the highest price is greater than yesterday's closing price, the open position is bought. This opening condition is in real time, if the K line has not been completed, then the highest price is dynamic, and the trading signal is likely to flash back and forth.
The future function of the traps:
The future function uses the future price, i.e. the current condition may be modified in the future, and the same future function can cause the signal to flash. So any function has the property of a future function, such as the conversion of the keyword to the function key.
As shown below: The word-turned-function indicates the turning point of the peak and valley of the wave, and it can adjust its valuation according to the latest real-time price, but if the current price changes, the result of the word-turned-function calculation will also change. If a function with a future function is used, the current order signal may be established and ordered, but after a while the signal may not be valid. Figure 5 to 1
The price of trapping
The so-called steal price behavior refers to the use of the past price to trade. For example: if the highest price is greater than a fixed price, then buy at the opening price. This condition is in steal price, because in the real market, when the highest price is greater than a certain price, the price is already higher than the opening price at a certain distance, at which time the opening price is not bought.
In another case, if the price jumps above the fixed price set by the strategy, the retrospective can be settled at a fixed price, but in the real world this fixed price is obviously not available.
Re-evaluate the impossible price of the trap
The price that cannot be negotiated can be divided into several situations: The first is that in the real world, stops are usually not bought, and falls are usually not bought. But in retesting, they can be traded.
The second type: the exchange shooting mechanism is: price priority, time priority. Some varieties of listings will often have large orders, in real time if the listing buy and sell, you need to wait for the thickness of the listing, in order to transact or not to transact. But in retesting, listing buy and sell is possible.
Third: if the strategy is a leverage, then the retest profit is high, because the retest has always assumed to capture these price differences. In reality, many price differences cannot be captured, or only one leg is captured, and in general, the one that is certainly not in your direction is undoubtedly the first transaction, then you need to immediately replenish the other leg, at which point the slippage point is no longer 1 or 2 points, and the leverage strategy itself will capture the price difference of these points, which is impossible to simulate in retest.
The fourth type: black swan event. In the black swan event, although it looks on the surface to have the opening price, the highest price, the lowest price, the closing price, in fact in the extreme market of the day, the middle price is a vacuum, a large number of stop loss orders, causing a tramp event, liquidity is zero, the transaction difficulty is very large, but the loss can be stopped in the test. Figure 5 to 5
Re-test the over-fitting of the trap
Every time I see this diagram below, my thoughts are: hahahahahaha... as you can see from this diagram below, a ridiculous model, if complex enough, is perfectly suited to the data.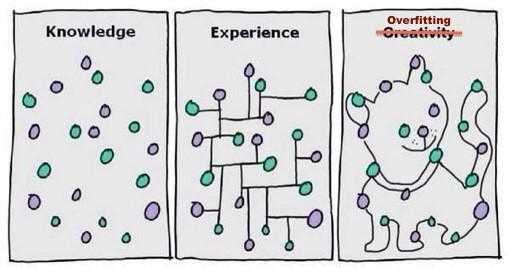 Figure 5 to 5
For quantitative trades, retrospection is based on historical data, but the sample of historical data is limited if the parameters of the trading strategy are too many, or the trading logic is too complex, leading to the over-adaptation of the trading strategy to historical data.
The modeling process for quantitative strategies is essentially a process of finding local non-random data from a large amount of seemingly random data, which can easily fall into the trap of over-fitting without the knowledge of statistics.
So, don't be fooled. If you find out that the extra-sample data is not performing well, and you feel too sorry to throw the model away, or you are unwilling to admit that your model is not working, and you continue to optimize the model for the extra-sample data until it performs as well on the extra-sample data, then the final injury will be your real silver bullet.
Trapped survivors are being tracked
A popular joke on Wall Street is that if there are 1,000 monkeys in the market, 500 monkeys are eliminated in the first year; half are eliminated in the second year and 250 monkeys remain; and 125 monkeys are eliminated at the end of the third year.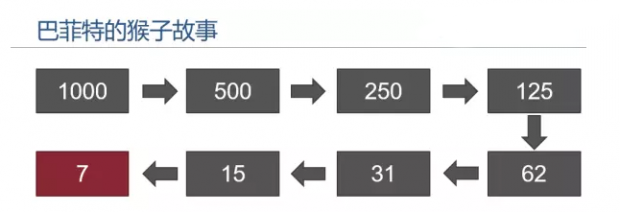 Figure 5 to 5
By the ninth year, there was only one rabbit left. Then you look, look, look left, look right, and it's like you're blindfolded. The last time you saw the cover of a financial magazine, you thought, "Oh, oh, that's Buffett!"
Of course, this is just a joke, but did you ever think that if there are 1000 fund managers, then in 10 years, about 10 fund managers will be running the market for 10 consecutive years.
As in the left-hand side of the chart, I believe that the vast majority of investors will see a bright future. The investment strategy has performed very solidly and with little to no significant retracement. Figure 5 and 5
The left-hand side of the feedback curve is the one that performs the best among many feedback loops. That is, there are many worse ones behind the left-hand side of the feedback.
Re-measuring the impact costs of traps
In a real trading environment, prices are always fluctuating, and when you look forward to a trade opportunity, the moment you place an order, the price may have changed. So slippage issues are inevitable, both in subjective trading and in quantitative trading.
However, because feedback is based on static data, it is difficult to simulate a real trading environment. For example: the price of the order is 1050 buy, but the actual transaction price may be 1051. There are many principles that cause this phenomenon, such as: liquidity vacuum in extreme market conditions, network latency, software system hardware, server response, etc.
Reassessment of non-slip points
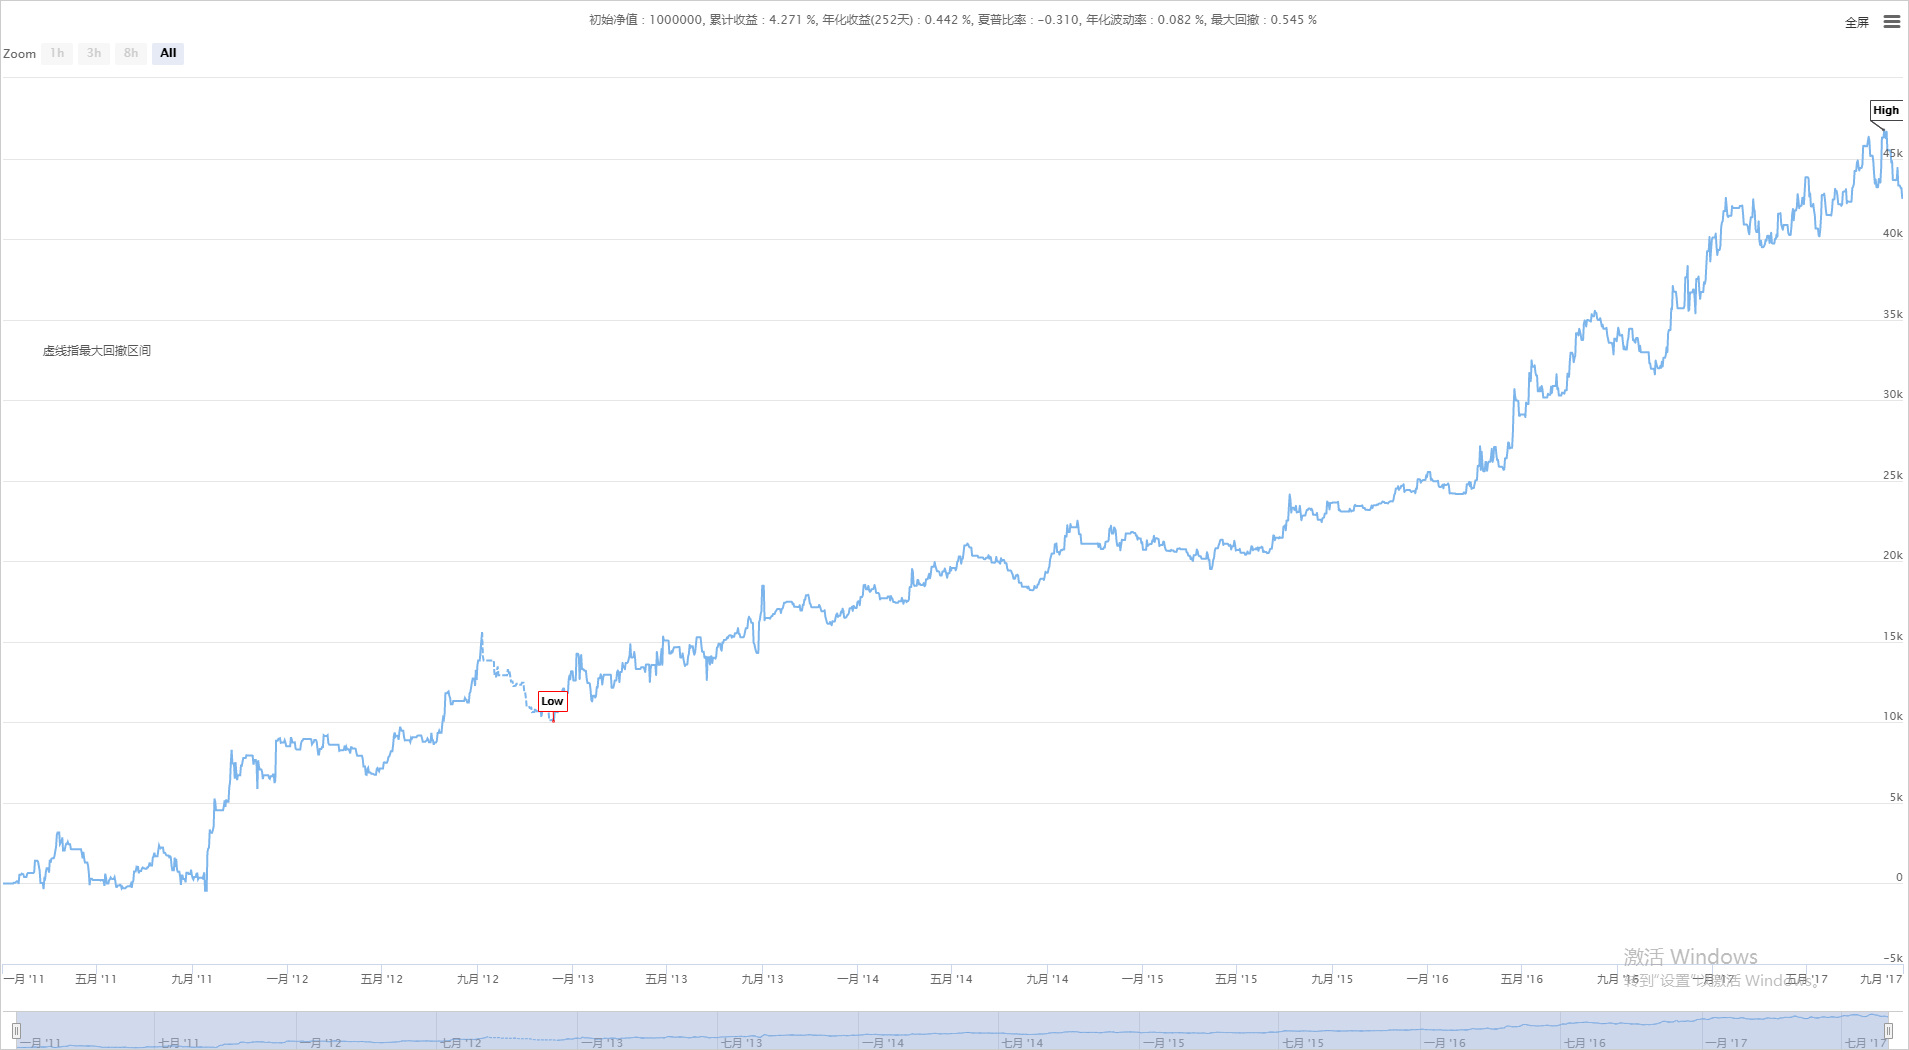 Figure 5 and 6
As illustrated above, a non-slip-point retracement, the capital curve looks good, but the actual transaction price in the live trading is different from the ideal transaction price of the strategy retracement. So to reduce this error, two slippage points can be set up during the strategy retracement, to increase the buy price or reduce the sell price.
Added slider retesting
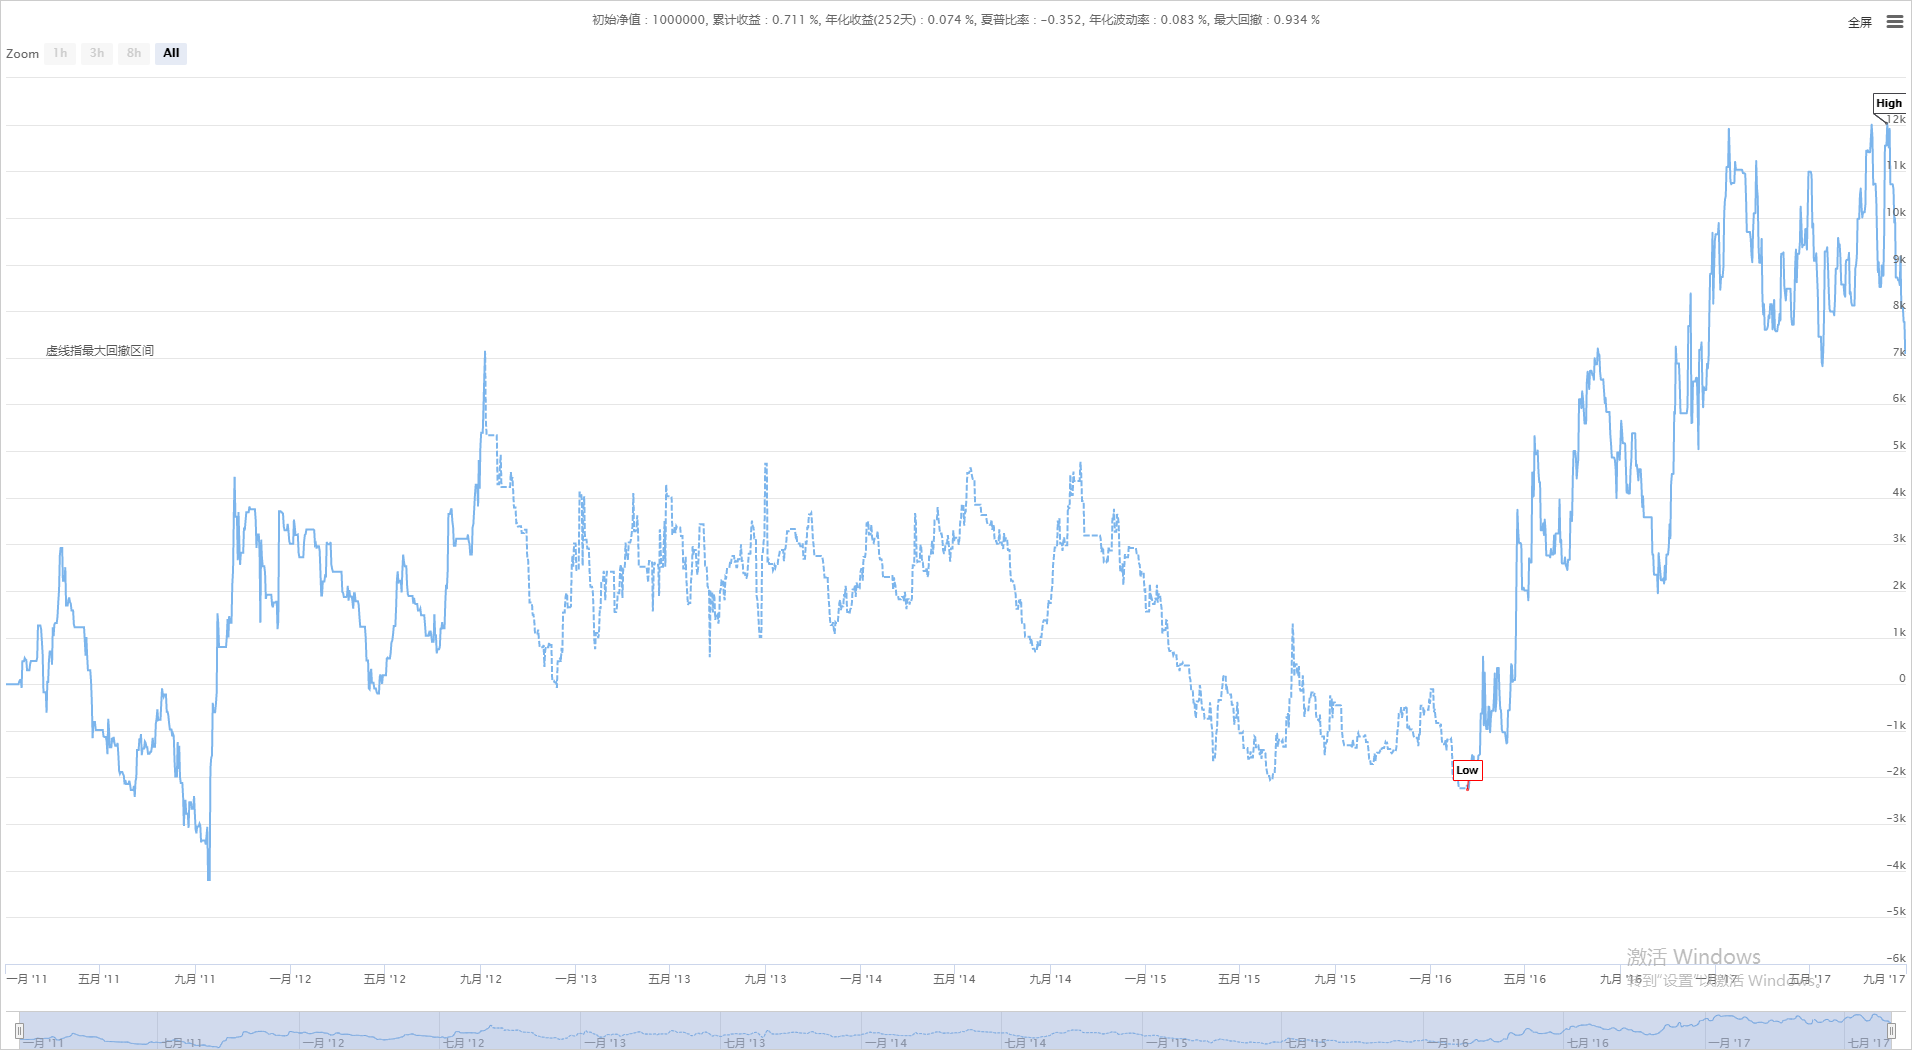 Figure 5 and 7
As shown above, the same strategy, if the result of retesting after adding 2 jumps to the result of retesting without adding slippage points, is very different, then it also represents the need for improvement or elimination of this strategy. In particular, the strategy with a relatively high trading frequency, adding 1-2 jumps to the retesting can make retesting closer to the real trading environment.
Summary
The answer is very simple, it is necessary to simulate the trade for a while before the strategy comes to fruition, if the price of the simulated transaction is not different from the price of the transaction at the time of the retest, then the strategy is not a problem, at least the strategic logic is not a problem.
Regardless, retesting is a must do for an experienced trading system developer; it can tell you whether a strategy idea can be verified to be effective in historical trading; but a lot of times retesting doesn't guarantee future profitability; because there are too many holes in retesting that you won't understand without buying a few lessons; and these lessons are stacked with real gold and silver. I thought reading this article would at least help you avoid a lot of quantified pitfalls and pitfalls.
After-school homework
1 What is overfit and how to avoid it? 2 What are some real-life survivorship biases?
5.2 How to Quantify Transaction Retesting
Summary
The significance and importance of retrospective analysis is undisputed, and when quantitative retrospective analysis is performed, the strategy should be kept as close as possible to the actual context of the history, which can lead to the total ineffectiveness of quantitative retrospective analysis if the details of the historical context are ignored. This article will explain how to do quantitative transactional retrospective analysis.
Retracement is the same as data retracement, which involves buying and selling by retracing historical K-line data and simulating real trading rules, ultimately aggregating data such as Sharpe ratio, maximum retracement rate, annualized yield, capital curve, etc. over a period of time. Currently, there are many software that can do retracement, such as a variety of well-rounded Chinese finance, VNPY that can be flexibly customized, etc.
The inventor quantized as a commercial quantized transaction software, came with a high-performance regression engine, a for-loop regression framework, to perform vector quantization, faster; and unified the code of the regression and the real disk, partly solving the dilemma of easy regression and real disk difficulty.
How to test the interface
We use the inventor's quantified Ma-language strategy as an example to create a website for the developer's quantified trading tools.www.fmz.comClick on Control Center, Policy Library, Select a Policy, and Simulated Retest to go to the following page: Figure 5 to 8
In the retest configuration interface, you can customize according to your actual needs. For example: set retest time, K-line cycle, data type ((analog level data or real disk level data. In comparison, analog level data retest is faster, real disk level data retest is more accurate).
Click on the trading language library, first is the trade setup label, the inventor of the quantified trading tool, the trading language strategy has two methods of retrieval execution, namely: the closing price model and the real-time price model. The closing price model refers to the execution of the model only after the current K line has passed, and the execution of the transaction at the beginning of the lower root K line. The real-time price model refers to the execution of a model for each price change, immediately after the trading signal is formed, as shown below: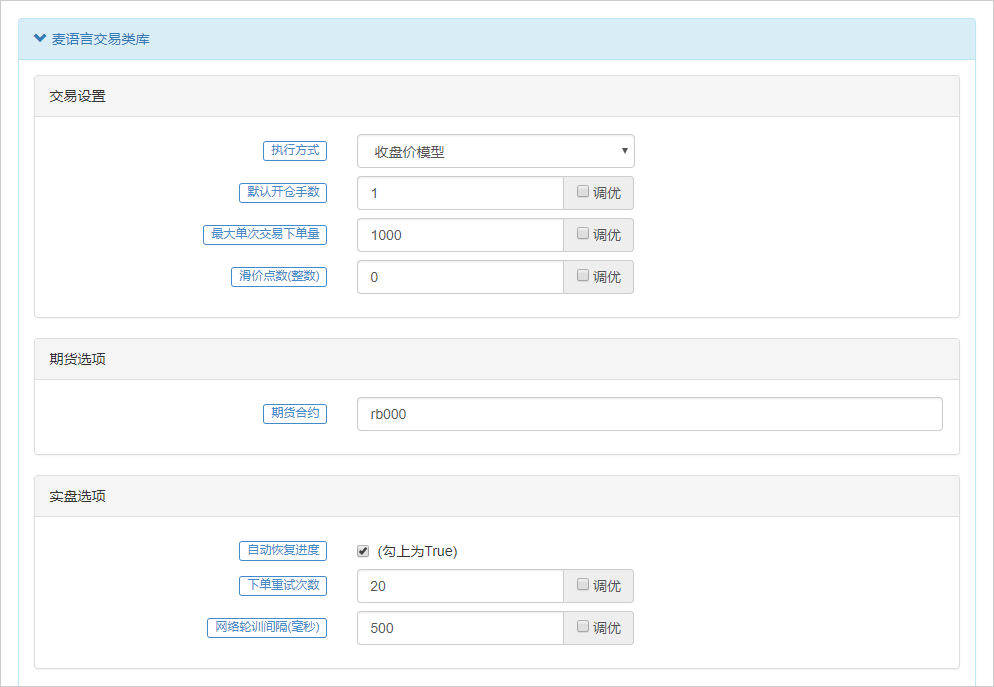 Figure 5 to 9
The default number of open positions refers to the number of open positions at the time of retesting, the maximum single-trading volume is the maximum number of open positions assigned to the retesting engine. A deviation between the transaction price level on the physical disk and the preset transaction price range occurs, which generally moves in the direction unfavorable to the trader, causing the transaction to incur additional losses, so it is necessary to add slippage points, domestic commodity futures are generally added 1-2 jumps, or even more, to simulate the real trading environment.
In the futures option, the contract variety to be retested is filled in, such as rb000 or rb888. The live option is mainly used for live trading, and the default setting can be kept in the retest. If the auto-reset progression is clicked to true, then when the policy stops the robot in real-time, the robot will restart automatically to recover the signal position before it stops, without having to recalculate the signal.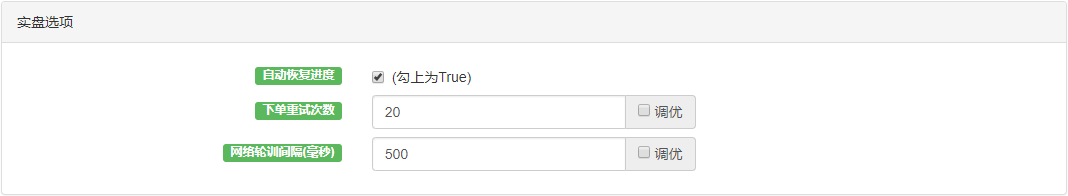 Figure 5 to 10
The spot trading option is mainly aimed at digital currency trading, and the default setting can be kept in retrospect. It is possible to specify single transaction volume, minimum transaction volume, priced currency accuracy, transaction variety accuracy, processing fees, account synchronization time, profit and loss statistical interval, etc., as well as leverage multiplier and other related settings for individual digital currency exchanges.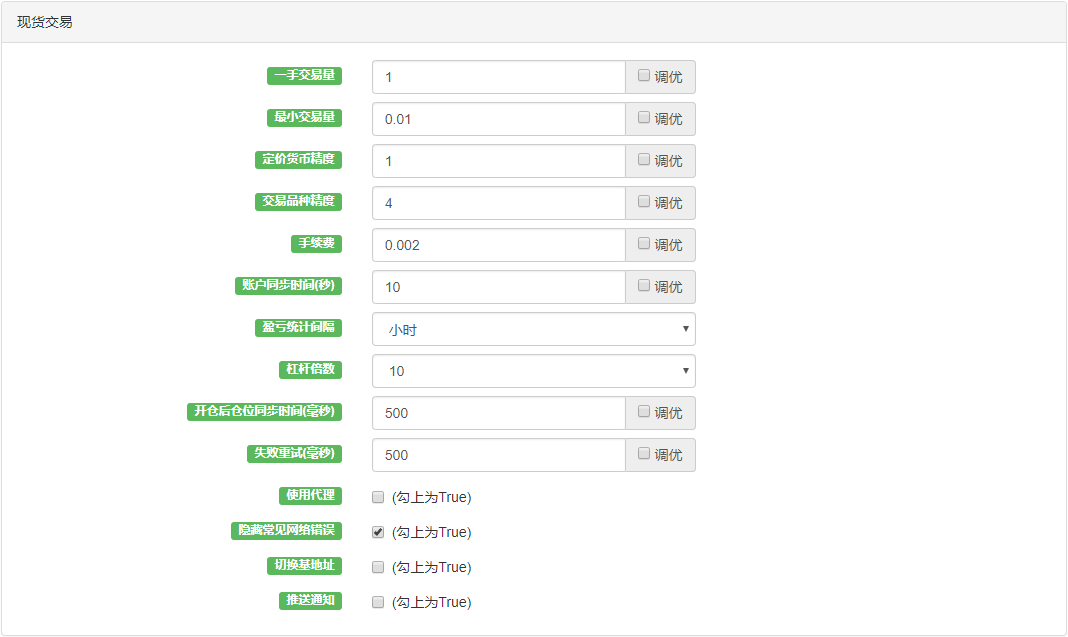 Figure 5 to 11
Strategic retesting
Before retesting, first determine your trading strategy, here we use the thermostat thermostat strategy, which will use a trend strategy in a trending market based on market conditions, and a shock strategy in a shocking market based on market conditions.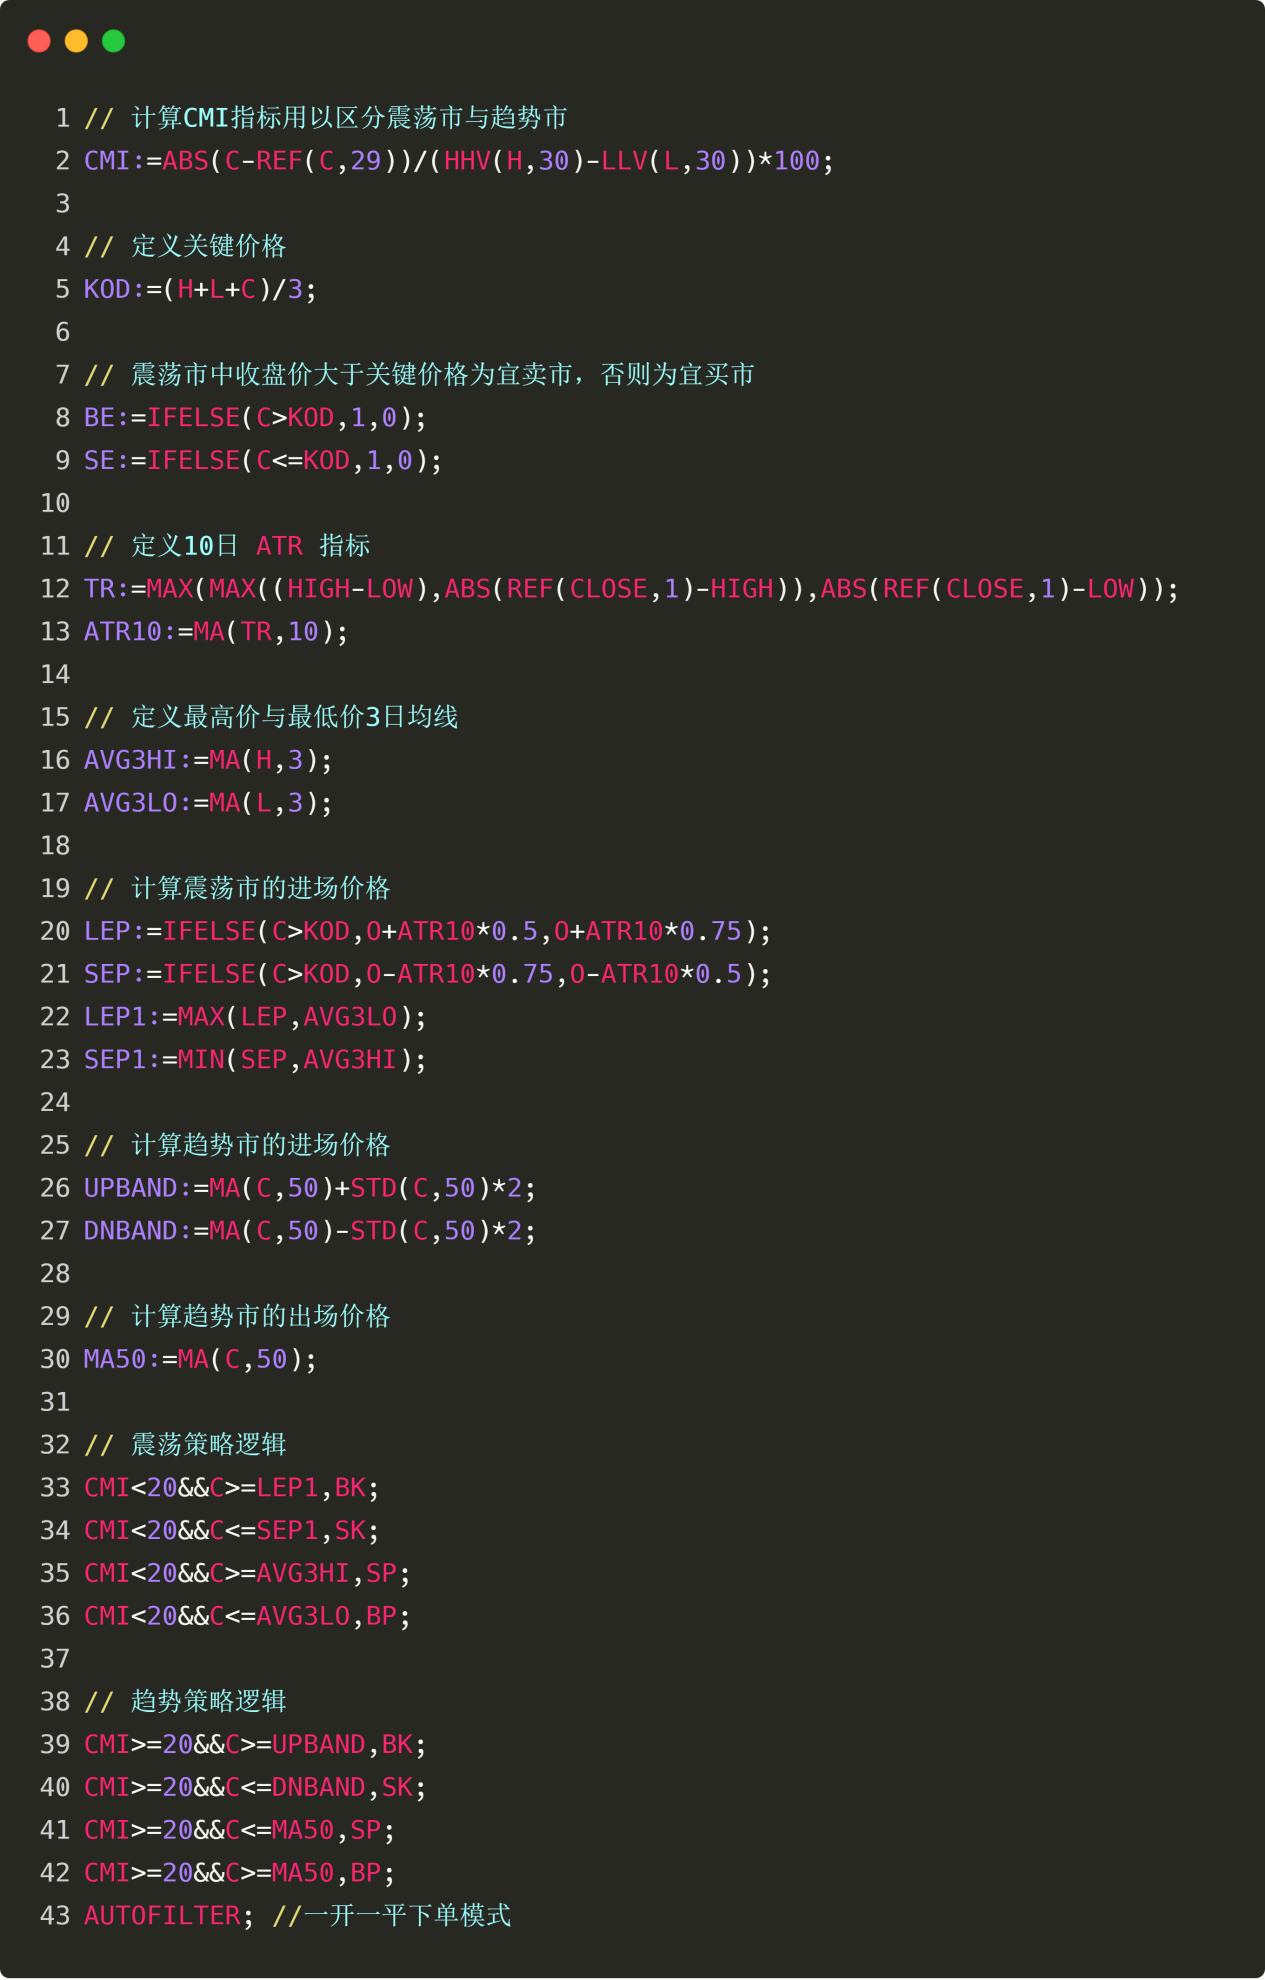 Figure 5 to 12
In the analogue retest interface, after configuring the retest settings, click on the retest start button, and after a few tens of seconds, the retest results are immediately displayed. In the retest log, the number of seconds used for retesting, the total log and the number of transactions are recorded. The account information is printed in the strategy retest final performance results: average profit and loss, holding losses, collateral, handling fees and estimated profit and profit.
Figure 5 to 12
In the analogue retest interface, after configuring the retest settings, click on the retest start button, and after a few tens of seconds, the retest results are immediately displayed. In the retest log, the number of seconds used for retesting, the total log and the number of transactions are recorded. The account information is printed in the strategy retest final performance results: average profit and loss, holding losses, collateral, handling fees and estimated profit and profit.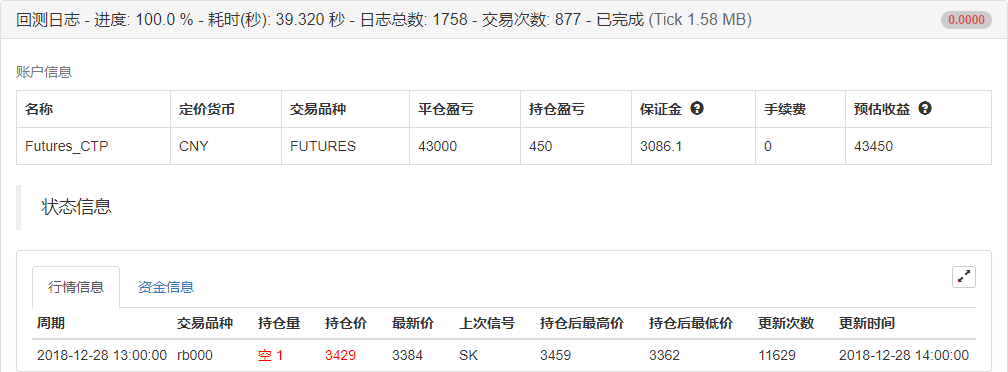 Figure 5 to 13
The status bar records the trade varieties, holdings, holding prices, latest prices, last signal types, highest and lowest prices after holding, number and time of updates, and information on funds. In addition, the floating profit and loss label shows the detailed capital curve of the account, including commonly used performance indicators: yield, annualized yield, sharp ratio, maximum annualized volatility, withdrawal rate, which can basically meet the needs of the vast majority of users.
The most important performance indicator is the Sharpe Ratio. It is a comprehensive indicator that considers both returns and risks, and is also an important reference indicator for measuring a fund's product, colloquially referred to as the amount of money you risk per dollar of investment, so the higher the value of the Sharpe Ratio, the better.
The annual volatility rate, as its name implies, is the daily volatility rate x the number of trading days per year, which measures the risk of the fund, but is definitely not the entire risk. For example, strategy A has a large volatility rate, but has been fluctuating upwards, yields are good, strategy B has a small volatility rate, but has always been flat, can we say strategy B is better than strategy A?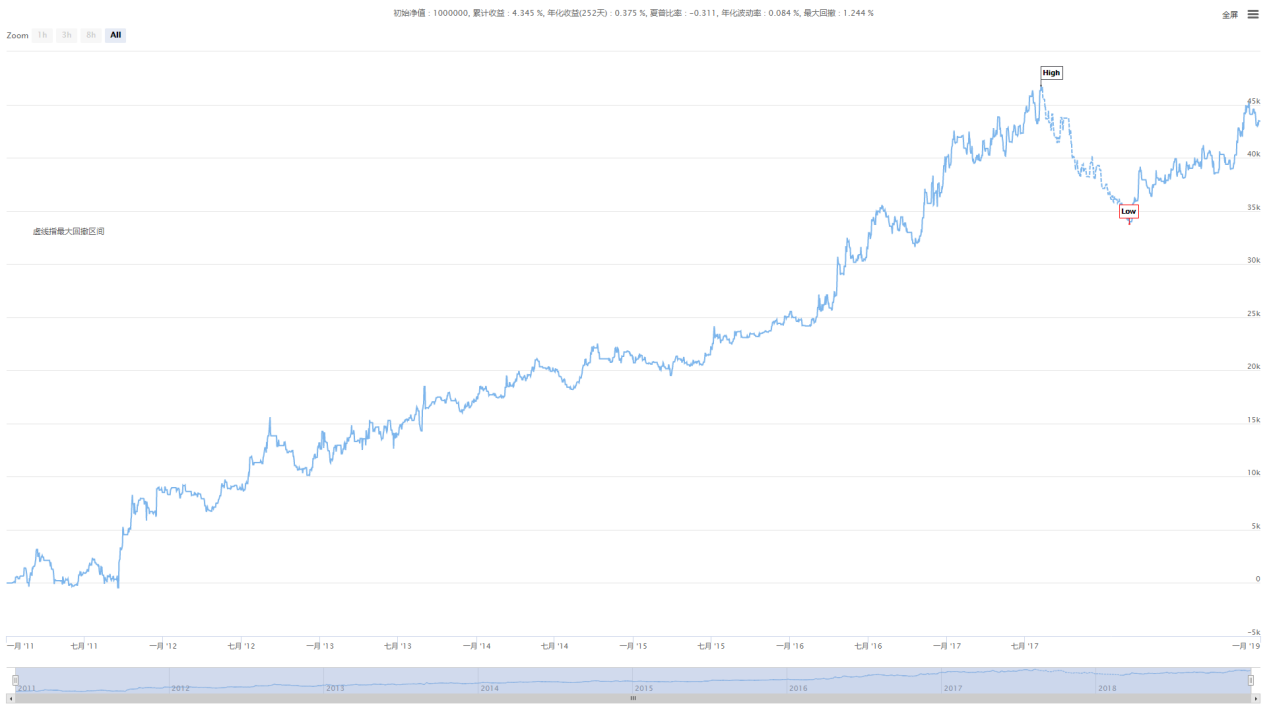 Figure 5 to 14
Finally, in the log information bar, the details of each transaction captured at the time of retesting are recorded, including the specific time of the transaction, the exchange, the buy and sell and the type of opening and closing positions, the transaction price captured by the retesting engine, the number of transactions and the printed information, etc.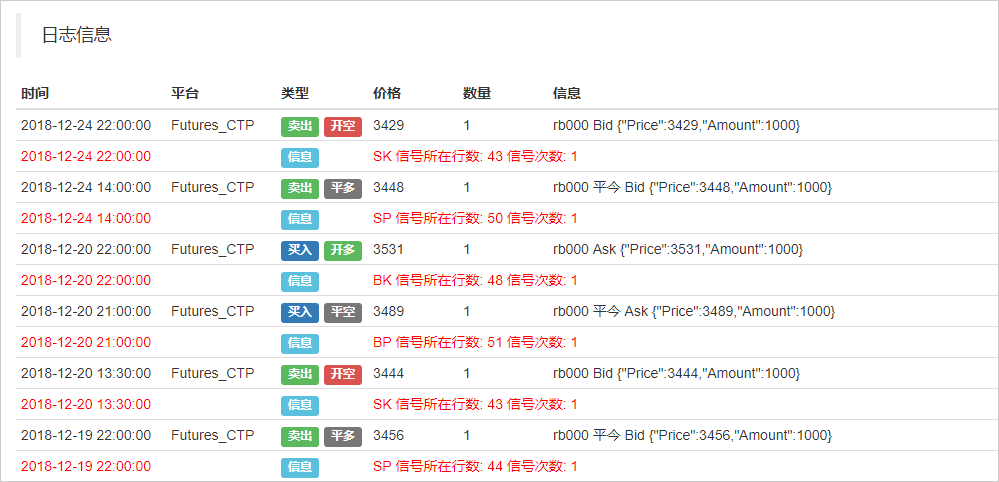 Figure 5 to 15
After the test
Many times, even in the overwhelming majority of cases, the results of retesting are far from what you expect. After all, a strategy that is stable and profitable in the long run is not so easy to achieve, and it requires your market awareness.
If your strategy is losing money, don't be discouraged, it's actually normal. First, see if the strategy logic is written wrong, if extreme parameters are used, if there are too many open conditions, etc. If necessary, you can also re-examine your trading strategy and trading ideas from another angle.
If your strategy retrospects very well, the money curve is perfect, the Sharpe ratio is above 1 or even more. Don't get too excited, most of these problems can be eliminated using off-sample data and simulated real-time trading using future functions, or steal prices, or over-matching, or no slider setup.
Summary
The above is an overview of the entire process of trading strategy retesting, which can be said to be specific to every detail. It should be noted that historical data retesting is, after all, an ideal environment in which all risks are known. Therefore, the best time for strategy retesting is to experience a round of bull and bear markets, and the effective number of trades should not be less than 100 times, so as to avoid partial survivor bias.
The market is always changing and evolving, and a good strategy for historical retrospection does not necessarily mean that it will be good in the future, and it is not possible for a strategy to deal only with known risks in the retrospective environment, but rather with unknown risks in the future.
After-school homework
1, try to replicate the policies in this section and retest the performance report 2. Try to improve and optimize the strategies in this section based on your own trading experience
5.3 How to read a strategy review performance report
Summary
When our strategy review is complete, the inventor of the quantitative trading tool will output a variety of performance indicators, earnings curve charts in the web page. But perhaps because we are not familiar with the meaning and content of these indicators, which leads to the inability to judge the strategy well, this article will start from the main indicator concept to help you read the strategy review performance report, to distinguish the advantages and disadvantages of the strategy.
Objective and comprehensive assessment
Whether it is a record of real-world transaction data or a back-testing report using historical data back-testing, the strengths and weaknesses of the model are evaluated by statistics on the transaction situation.
The key question is, what statistics do we need to compare with? Let's look at an example: if we have two sets of data in the same time period, which model performs better?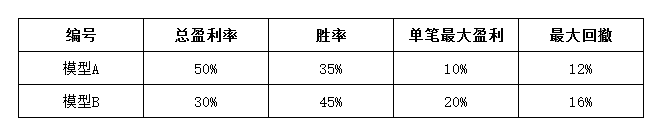 Figure 5 to 16
The answer is no. The one-sidedness of the rating system will lead to the quantitative trading system going into a tailspin.
A trading system must be able to be put into operation through historical retrospection. A trading system that is not able to be put into operation through historical retrospection cannot be profitable in the long term in actual trading. Historical retrospection is a necessary precondition for the trading system to be put into operation in real time.
A trading system that is historically retrospective is not necessarily a useful trading system, but one that is not historically retrospective is not necessarily a useful trading system. Generally, we need to analyze performance reports from the perspective of stability, sustainability, whether they are expected, etc. Figure 5 to 17
As shown above, however, anyone who has been exposed to quantitative trading may have encountered a series of lengthy, confusing data terms for back-testing performance, and even in these performance data, many data are contradictory. Many quantitative beginners, on the contrary, wonder which data to focus on.
The performance indicator terms in the above diagram can generally be divided into several categories: performance ratios, cycle analysis, various curves, extreme trading analysis, etc. Even from the strict point of view of fund products, most of them are only a display of the results of the retrospective calculation, which should not be significant in practice, such as: account balance requirements, holding gains, confidence limits, etc. Even if you only need to focus on a few important ones. Below I have selected the most important ones in the retrospective performance indicators as a detailed explanation.
Key performance indicators
Maximum asset drawdown rate (max drawdown)
The formula for calculating maximum regression is as above, for
- Quantifying Fundamental Analysis in the Cryptocurrency Market: Let Data Speak for Itself!
- Quantified research on the basics of coin circles - stop believing in all kinds of crazy professors, data is objective!
- The inventor of the Quantitative Data Exploration Module, an essential tool in the field of quantitative trading.
- Mastering Everything - Introduction to FMZ New Version of Trading Terminal (with TRB Arbitrage Source Code)
- Get all the details about the new FMZ trading terminal (with the TRB suite source code)
- FMZ Quant: An Analysis of Common Requirements Design Examples in the Cryptocurrency Market (II)
- How to Exploit Brainless Selling Bots with a High-Frequency Strategy in 80 Lines of Code
- FMZ quantification: common demands on the cryptocurrency market design example analysis (II)
- How to exploit brainless robots for sale with high-frequency strategies of 80 lines of code
- FMZ Quant: An Analysis of Common Requirements Design Examples in the Cryptocurrency Market (I)
- FMZ quantification: common demands of the cryptocurrency market design instance analysis (1)
- Nine trading rules that helped a trader go from $1,000 to $46,000 in less than a year
- 5.5 Trading strategy optimization
Hailhydra2Good article!
The vacuum is quantized mark