From quantitative trading to asset management to developing CTA strategies for the ultimate payoff
Author: , Created: 2019-06-26 10:27:41, Updated: 2023-10-30 20:30:50[TOC]
The Foreword
Why study this lesson?What is the benefit of learning this lesson? First of all, the course is based on JavaScript and Python programming languages, the language is just a technology, and finally we have to apply this technology to an industry. Quantitative trading is an emerging industry that is currently in a fast-growing phase, and there is a high demand for talent.
The systematic learning of this course will give you a deeper understanding of the field of quantitative trading. If you are ready to move into the field of quantitative trading, you can also help if you are a stock or futures investor, then quantitative trading can fully support your main trading, by developing trading strategies to be profitable in the financial markets, but also expand the channels and platforms for investing in finance.
Before that, let me tell you about my personal trading experience, I am not from a financial background, I studied statistics. I first started trading stocks in subjective terms when I was a student, and later became a quantitative trader for domestic private equity funds, mainly doing strategy research and strategy development.
I've spent more than a dozen years in the trading circle, before and after, and I've developed all kinds of strategies. My investment philosophy is: control of risk above all else, focus on absolute returns. Our course topic is: from quantitative trading to asset management to developing CTA strategies for absolute returns.
1st, the CTA strategy of the futures market
1.1 Understanding the CTA
CTAs are known abroad as commodity trading advisors, and domestically as investment managers. Traditionally, CTAs have been used to concentrate the funds of large investors, then to entrust them to professional investment firms, and finally to invest in stock futures, commodity futures, and sovereign bond futures through trading advisors (CTAs).
But in reality, as the global futures market continues to grow, the concept of CTA is also expanding, far beyond traditional futures. It can be used not only in the futures market, but also in the interest rate market, stock market, foreign exchange market and options market, etc. As long as the variety has a quantitative amount of historical data, it can be used to develop a corresponding CTA strategy based on these historical data.
Before the 1980s, the technology of electronic discs was not yet fully developed, when most traders were able to judge the future trend of commodity futures by manually drawing technical indicators such as the William Index, KDJ, RSI, MACD, CCI. Later, traders established dedicated CTA funds to help clients manage their assets. Only after the popularity of electronic discs in the 1980s, CTA funds in the true sense began to appear.
Changes in the size of CTA fund management
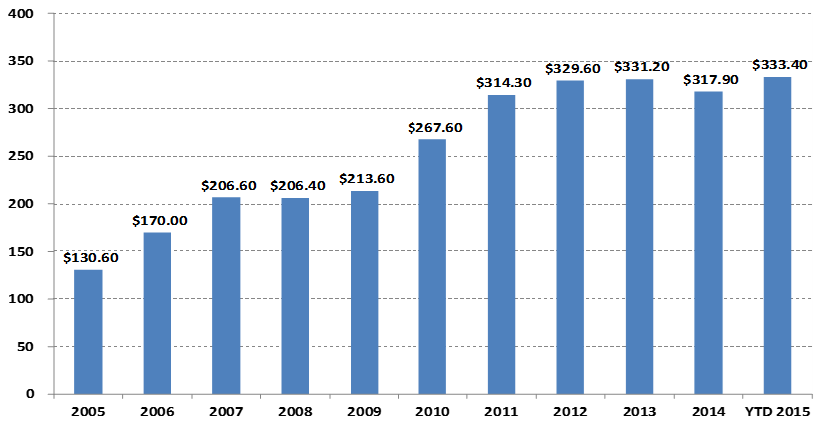 Unit: $1 billion
If we look at the chart above, especially with the rise of quantitative trading, the size of global CTA funds has grown from $130.6 billion in 2005 to more than $300 billion in 2015; and the CTA strategy has also become one of the more mainstream investment strategies of global hedge funds.
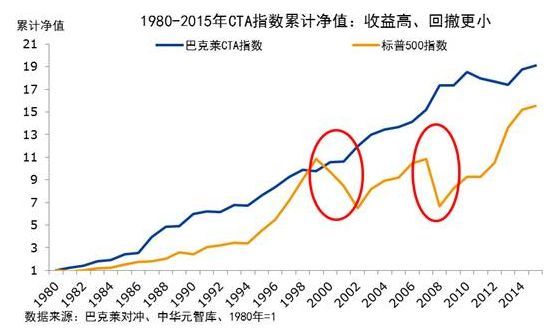
The CTA index, which represents the most representative benchmark of the global commodity trading consultancy industry, is also on the rise. From the end of 1979 to the end of 2016, the CTA index has accumulated 28.95 times the CTA index, with an annualized return of 9.59%, a sharp ratio of 0.37, and a maximum drawdown of 15.66%.
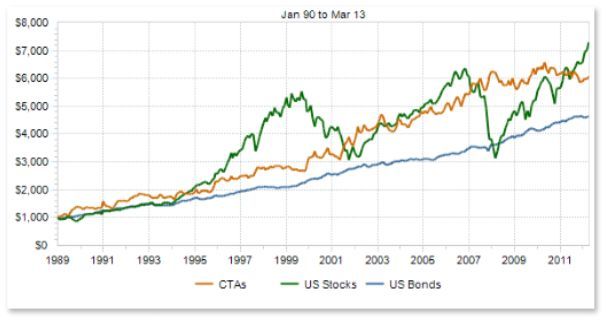
As CTA strategies are usually very low in relation to other strategies in the portfolio of assets allocation. As shown in the red circle, during the global stock bear market of 2000-2002 and the global subprime crisis of 2008, the Barclays CTA Fund Index not only did not fall but also achieved positive returns, and CTA can provide strong returns when the stock and bond markets are in crisis.
China's CTA has only been in development for about a decade, but it is gaining momentum, largely due to the country's relatively open trading environment for commodity futures, lower trading capital thresholds, the adoption of a collateral system that allows for more and more two-way transactions, low transaction fees, the technological architecture of exchanges that are more advanced than stocks and easier to trade systematically, etc.
Since 2010, CTA funds have existed mainly in the form of private equity funds. With the gradual opening of domestic policies to the scope of investment of funds exclusively, CTA funds began to exist in the form of funds exclusively, and their more transparent and public way of operating has also become a necessary tool for allocating the assets of more investors.
As shown above, CTA strategies are also more suitable for individual traders than other trading strategies, regardless of their ease of access, capital thresholds, execution of trading strategies, and API pairing. Domestic futures contracts are very small, such as a few thousand bucks of corn or soybean meal per hand, and there are almost no capital thresholds. Another part of the CTA strategy is relatively easy compared to other strategies because it comes from traditional technical analysis.
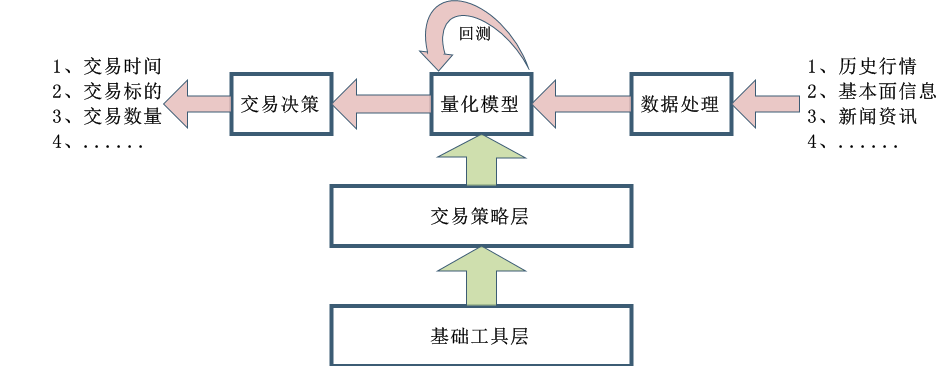
The design process for CTA strategies is also relatively simple, first processing the historical data for initial processing, then inputting it into a quantitative model, a quantitative model that includes trading strategies formed by tools such as mathematical modeling, programming design, etc., and generating trading signals by computationally analyzing these data. Of course, in actual development, it is not as simple as in the diagram above, here just to give everyone an overall concept.
1.2 Types of futures CTA strategies
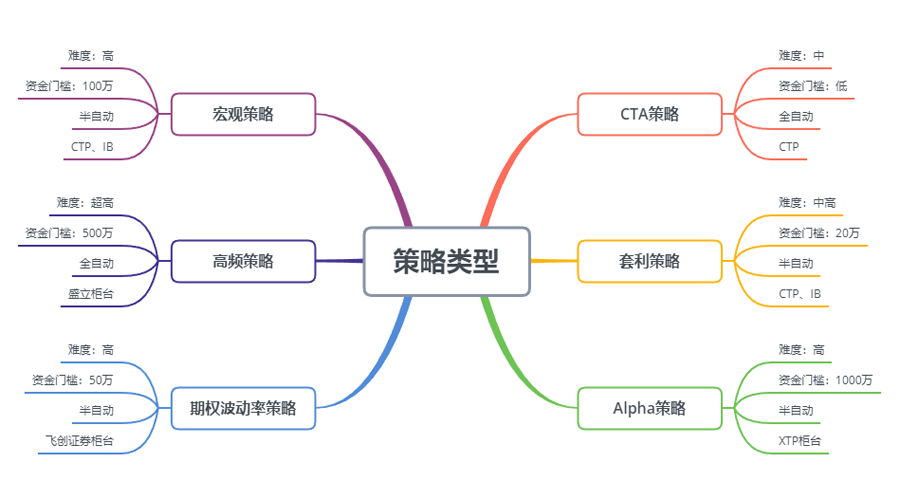
From a trading strategy perspective, the CTA strategy is also diverse: it can be a trend strategy or an arbitrage strategy; it can be a long-term strategy or a short-term strategy; the strategic logic can be based on technical analysis or fundamental analysis; it can be subjective trading or system trading.
CTA strategies have different classification methods, depending on the trading method, can be divided into: subjective trading and systemic trading, the development of foreign CTA strategies is relatively advanced, and the CTA strategy of systemic trading is close to 100%. According to the analytical method, it can be divided into: fundamental analysis and technical analysis. According to the source of income, it can be divided into: trend trading and shock trading.
Overall, CTA strategies account for about 70% of the overall trading market, with average return strategies accounting for about 25% and countertrends or trend reversals accounting for about 5%. The largest trend strategies, depending on the holding cycle, can be divided into: high-frequency trading, intraday trading, medium short-term trading, medium long-term trading.
Highly frequent city strategiesThere are currently two main types of high-frequency trading strategies on the market, one is the high-frequency market strategy and the other is the high-frequency swap strategy. The market strategy is to provide liquidity in the trading market, that is, in the trading market where there are market makers, someone wants to buy and sell a trade, the market maker must ensure that his single can be traded.
High-frequency bidding strategyA high-frequency swap is a trade of two strongly correlated stocks or a combination of ETFs and ETFs. According to the ETF's calculation method, the expected price of an ETF can be calculated using the same method. The ETF price may be subtracted from the expected price of the ETF by an index.
The strategyIf, in the literal sense, it is not held overnight, it can be called a day trading strategy. Since day trading is short in duration, it is usually not immediately profitable after entering the market, and therefore the market risk incurred by this trading method is lower. However, because the market changes quickly in a short period of time, day trading strategies are usually more demanding on traders.
Medium to long-term strategyTheoretically, the longer the holding cycle, the greater the strategic capacity and the lower the risk-reward ratio. Especially in institutional trading, because of the limited capacity of the short-term strategy, large funds cannot enter and exit in a short time, so more medium-term strategies are configured.
CTA policy dataGenerally, CTA strategies use minute, hour, and daytime data, including: opening price, high price, low price, close price, volume, etc.; only a small number of CTA strategies use Tick data, such as in-depth data such as buy, sell, buy, and sell volumes in L2 data.
The basic idea of the CTA strategy is based on traditional technical indicators, since there are more publicly available references, and the logic is usually relatively simple, mostly based on statistical principles. For example, the various technical indicators that we are familiar with: MA, SMA, EMA, MACD, KDJ, RSI, BOLL, W&R, DMI, ATR, SAR, BIAS, OBV, etc.
There are also some classic trading models on the market that can be used and improved, including: multi-equivalent lines, dual thrust, R-breaker, beach trading, grid trading, etc.
These are trading strategies based on traditional technical analysis, the process of which is based on historical data and the correct trading concept, to refine the factors or buying and selling conditions that have a probability advantage, and to assume that the market will continue to exist in the future, and finally to implement the trading strategy with code and fully automate trading. Opening positions, stopping, stopping losses, raising positions, reducing positions, etc., which in general do not require human intervention.
The biggest advantage of the CTA strategy is that it can get absolute gains regardless of whether the current market is up or down, especially when the market is turning into a bull or a bear, or when the market trend is clearly fluid, the advantage of this strategy is very large.
1.3 The profitability of futures CTA strategies
The main reasons why futures CTA strategies make money are as follows:
- The price movement is counter-intuitive, it always continues in a trendy way. When investors observe the price rising, they buy into the wind, which results in the price rising further. The same is true for the price falling.
- The tolerance of each investor for the ratio of profit to loss is asymmetrical, and the risk tolerance is different. For most retailers, they prefer to opt for a more conservative swing trading method, and the market is more susceptible to trends.
- The formation of prices is determined by the transaction, it is true that the transaction is driven by people, but human nature is difficult to change, which leads to the recurrence of fixed forms, the strategy is effective in historical data re-evaluation, but also predicts the future may be effective.
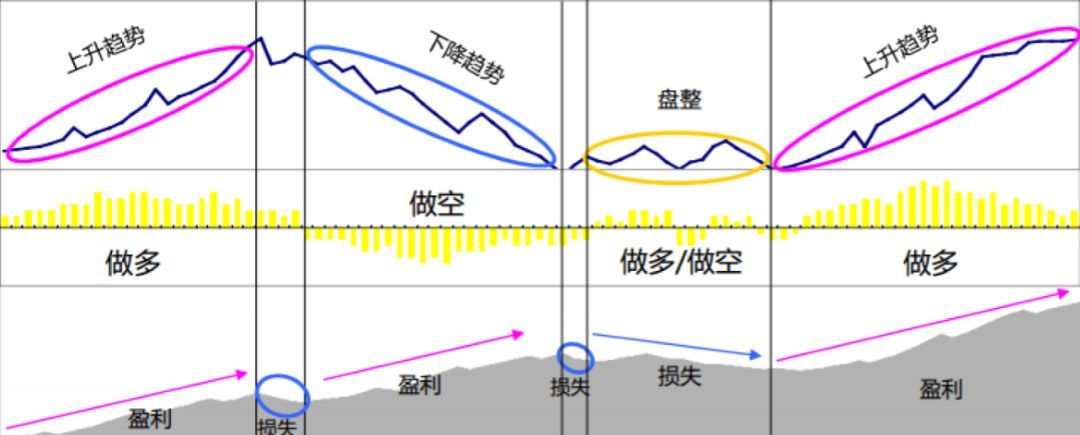
Another characteristic of trend tracking is that it loses money when there is no market and makes a lot of money when the market comes, but those who have traded know that the market is mostly due to volatile markets and only a small amount of time is trendy markets.
Since trend-following strategies are unstable in terms of returns, many investment firms use a variety of strategies to build a portfolio, with a certain amount of reversal strategies in between.
The relevance of CTAs to traditional assets
As we see in the diagram above, theoretically different styles or less relevant strategies will make different trading signals at the same time in the face of various changes in market prices. Since multiple earnings curves overlap each other, making the overall earnings complementary, the earnings curve becomes smoother, thus reducing the volatility of earnings.
It follows from the above that it is better to develop a master-level strategy than to develop a number of intermediate strategies, and how to control these strategies? Here we can draw on the algorithm of the random forest in machine learning, the random forest is not a standalone algorithm, it is a decision framework containing several decision trees.
The next step is to design a parent strategy that can be used to evaluate the liquidity, profitability and stability of the various varieties in the entire commodity futures market, to select a commodity futures portfolio with low volatility in yield, to conduct industry-neutral screening, to further reduce the overall volatility by diversifying the portfolio's industry configuration, and finally to trade a multi-variety commodity futures portfolio to build an actual commodity futures portfolio by matching the market value.
Each variety can also be configured with multiple parameter strategies, choosing a combination of parameters that perform well near the retrospective, and when market trends are apparent, the multiple parameter strategies will usually perform in a consistent manner, equivalent to a bullish position; when the market is in a volatile market, the multiple parameter strategies will often behave inconsistently, resulting in their respective over- or under-doing to hedge the risk, equivalent to a bearish position. This can further reduce the maximum retrospective ratio of the portfolio, while maintaining the overall return unchanged.
2 The classic example of a CTA strategy
Newton once said, "If I can see further than anyone else, it is because I stand on the shoulders of giants".
The CTA strategies that are publicly available on the market include the straight-line strategy, the Blink-belt strategy, the beach trader strategy, the dynamic strategy, the leverage strategy, etc. Quantitative trading strategies all have a characteristic that they die in the blink of an eye, and the strategy will slowly fail once it is publicly available. But this does not affect our learning these strategies, drawing on the essence of them, so as to stand on the shoulders of the giants to see the problem.
2.1 Fundamental analysis of futures (inventories, basis differences and prices)
Fundamental analysis does not need to be concerned with short-term price movements, believing that the value will ultimately be reflected in the price, but rather analyzes the factors behind the price and determines how much the variety is worth.
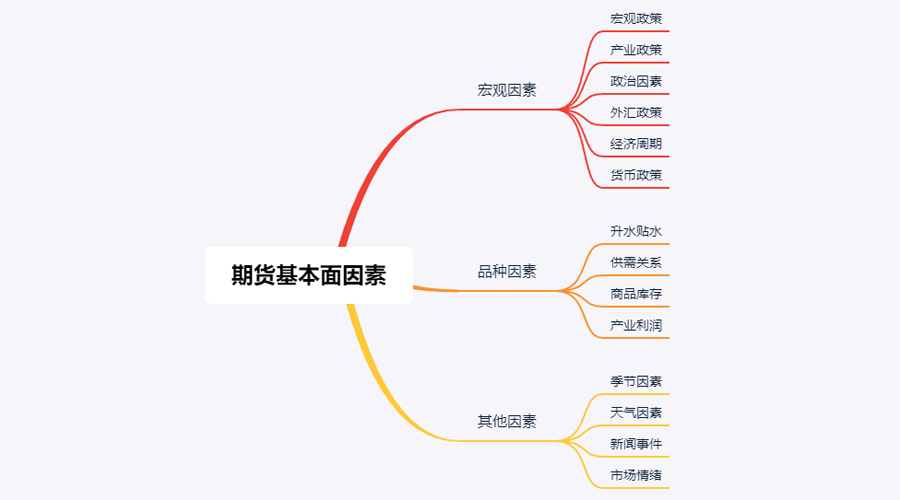
We can see in the graph above that there are many factors that influence the price of goods, ranging from dozens of items in total, to dozens more in detail, and that the data is constantly changing.
In fact, the fundamental analysis of commodity futures does not analyze all the factors, we only need to grasp the core elements of the fundamental analysis to sift through the complexity of the information and find the patterns.
Macro factorsMacroeconomic data is complex and varies, every day at every moment, there are many economic data published, all over the world, politicians, central banks, central banks, official and unofficial. Except for political and economic crises, macroeconomic analysis is a good material for conversation and is not very practical.
Variety factorsIn the fundamental analysis, variety analysis is mainly to analyze the rise of water, supply and demand relations, commodity inventories, industrial profits, etc. It can be said that mastering the commodity futures variety factor analysis, basically can judge most of the market trend.
Friends who are interested in futures know that domestic commodity futures can be simply divided into: industrial and agricultural products. The analysis of industrial and agricultural products is different, we explain from both the supply and demand aspects. In industrial products, supply is relatively stable, unless there is a major technological breakthrough, otherwise production capacity is unlikely to change significantly in a short period of time, so the factors affecting the prices of industrial products are mainly demand.
Therefore, according to the laws of economics, the ultimate determinant of the price of a commodity is the supply-demand relationship, and theoretically, the future price of a commodity can be determined as long as supply and demand data are available. For industrial products, supply data is easier to obtain, but data on demand is difficult to obtain.
In fact, we can also do further reduction, supply and demand in the economic market is the mutual result of inventory, we can judge the strength and weakness of the relationship between supply and demand in the market through inventory data. If a commodity stock is high, indicates that the market supply is greater than the demand, assuming that the external conditions do not change, the price of the commodity is about to fall.
In addition to analyzing commodity stocks, it is also necessary to analyze the price difference between the spot market and the futures market, which is called the key difference. If the futures price is greater than the spot price, we call it a futures raise; if the futures price is less than the spot price, we call it a futures dip. According to the futures delivery system, the futures price should be equal to the spot price on the date of the futures delivery.
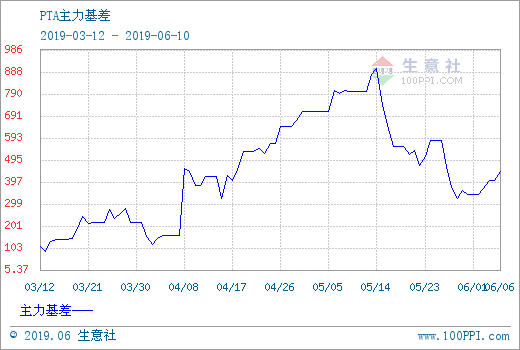
Whether raised or lower, due to the constraints of the futures delivery system, the delivery date futures price should theoretically be equal to the spot price. As the delivery date approaches, the spot price and the futures price tend to coincide, one is the return of the futures to the spot price, the other is the return of the spot to the futures price.
Based on the above principles, we can judge the future futures price by using both the inventory and the benchmark. If a commodity has a lower stock, and if the futures price is much lower than the spot price, then we can judge: the force of demand in the spot market is greater than the force of supply, and the future spot price is more likely to rise; also, due to the futures delivery system, the futures price will be compensated as the delivery date approaches, and the futures price is more likely to rise.
Finally, we use inventory and a key to determine the probability direction of future prices, but there is no more precise selling point, so we need to work with technical analysis to give clear input and output signals. The whole structure of the basic analysis is: low inventory + deep drainage + technical analysis Multi-head signal = do more; high inventory + significantly increase water + technical analysis Airhead signal = do nothing.
2.2 Trading at the Beach
Speaking of trading strategies, we have to mention the representative law of the shark. The law of the shark comes from one of the most famous experiments in the history of trading, when commodity speculator Richard Dennis wanted to find out whether great traders were born or later developed. To this end, in 1983 he recruited 13 people to teach them the basic concepts of futures trading, as well as his own trading methods and principles. These practitioners are called shark sharks.
In the four years that followed, the Mid-Atlantic Pigeons achieved an average annual return of 80%. Dennis also demonstrated that a simple set of systems and rules can make people with little or no trading experience excellent traders. However, there are individual Pigeons that sell Pigeon Trading Rules profitably on their website. To prevent this from happening, the two original Pigeons, Curtis Feith and Arthur Madock, decided to make the Pigeon Trading Rules free to the public on their website.
After the truth came out, it was discovered that the shark trading rules used an optimized Dongjian channel and used the ATR indicator for position management. After decades of historical testing, it became a trading method that can be easily earned by ordinary retailers and is still valid today in some varieties.
The core principles of the beach
- Take advantage: find a trading strategy that is expected to be positive because it will create positive returns in the long run.
- Risk management: Controlling risk, holding your ground, otherwise you may not be able to wait until the day you create results.
- You can only get the real results of the system if you stick to your strategy and stick to it.
- It's clear: in the long run, simple systems are more viable than complex ones.
So, next, let's see what the law on shark trading actually says. 1, the market -- what to buy and sell, essentially what markets to trade in, the seagulls are futures traders, they only choose markets with high volume of transactions and high liquidity, because choosing markets that are not active, will increase the additional slippage of entry and exit prices, and will miss many trend opportunities. 2, position size - how much to buy and sell is a very important part of the overall strategy, which is often overlooked or misunderstood. The ATR is used to calculate open positions, raise signals, stop loss signals. It is a very clever design, intended to adjust position size by the absolute volatility of the market, reducing holdings when market volatility is high, increasing holdings when market volatility is low. It first defines a unit, the formula for this unit is: ((total assets*1%) / ATR. The initial position is 1 unit, even if the decline in the number of items on the day reaches the ATR level, the loss of the day can be controlled within 1% of the total production level. 3, Market entry -- The entry of the beaches is based on the Dongjian channel, when the price rises above the highest price of the first 20 or 55 K line, it is more to enter, when the price falls below the lowest price of the first 20 or 55 K line, it is to enter empty. Stop-loss - A trade that does not stop losses will not be successful in the long run, but most traders are holding a losing position, hoping for a market reversal. The beach strictly stipulates when to exit a losing position, if you hold multiple orders and the price falls by 2 units, many heads will break even. If you hold empty orders and the price rises by 2 units, empty heads will stop losing the position. 5, stop-loss -- the stop-loss of the shark means losing a lot of buoyancy, which is also a difficult part for many traders to accept. If you currently hold a lot of orders and the price falls below the 10th Dongguan channel trajectory, you will flatten all the orders; if you currently hold a lot of blank orders and the price rises above the 10th Dongguan channel trajectory, you will flatten all the blank orders.
From this we can see that the rules of shark trading, while seemingly simple, have in fact formed a deformed trading system in the true sense of the word, covering all aspects of a complete trading system without leaving any room for subjective imaginative decision-making to traders, which allows the advantages of programmatic operation of the system to be realized.
The biggest advantage of the shadow trading method is that it helps us to build an efficient trading method, it is a combination of batch build, dynamic stop loss and trend following strategies, especially the use of ATR values and position management. Of course, it also has a common problem with trend tracking strategies, which is to bounce back.
3 CTA strategy for real-world development of the futures
3.1 Developing CTA trending strategies based on Ma
At the end of the last century, a magical method of trading became popular in the financial investment field in the United States, which after being practiced by thousands of people, was found to be effective and of great practical value, and was recognized by many investment experts and professional traders, and until now can be perfectly applied to almost all areas of financial investment, whether it is foreign exchange, gold, stocks, futures, crude oil, indices and bonds.
The term chaos originally referred to a description of a chaotic state of the universe, the idea of which was: the outcome is inevitable, but because of existing knowledge it is not possible to calculate the outcome, because the calculation itself is also changing the outcome, and in the end there may be the largest or smallest outcome, but no inevitable outcome. This is very similar to the trading market, where participants analyze the market and also change the market when buying and selling trades. The market has perpetual variability, when the participants learn about the market's new form, the market also learns that it occurs as soon as it is known by the participants, so it is variable.
Chaos Operating Method is a complete set of investment ideas, trading strategies and entry-exit signals, invented by Bill Williams. Currently, there are many investors internationally engaged in market trading using Chaos Operating Method, due to the lag in the development of our financial market, and Chaos Theory is also a relatively new idea, so there are few people who study Chaos Operating Method domestically.
As the name implies, the theoretical basis of chaos operations is chaos theory, which was proposed by meteorologist Edward Lorenz and is one of the greatest scientific discoveries of the late 20th century. Bill Williams creatively applied chaos theory to the field of financial investing, and combined disciplines such as differential geometry and nonlinear dynamics to create a series of very effective technical analysis indicators.
The entire Chaos Operating System is made up of five dimensions (technical indicators):
-
Alligator whale
-
The Fractal
-
The Momentum
-
Acceleration
-
The Balance Line
We can see in the diagram above that the finite difference equation is a set of equations using differential geometry and nonlinear dynamics, which is essentially an exponential expansion of the weighted moving average of the equation, but with a slightly more complicated computation than the normal equation.
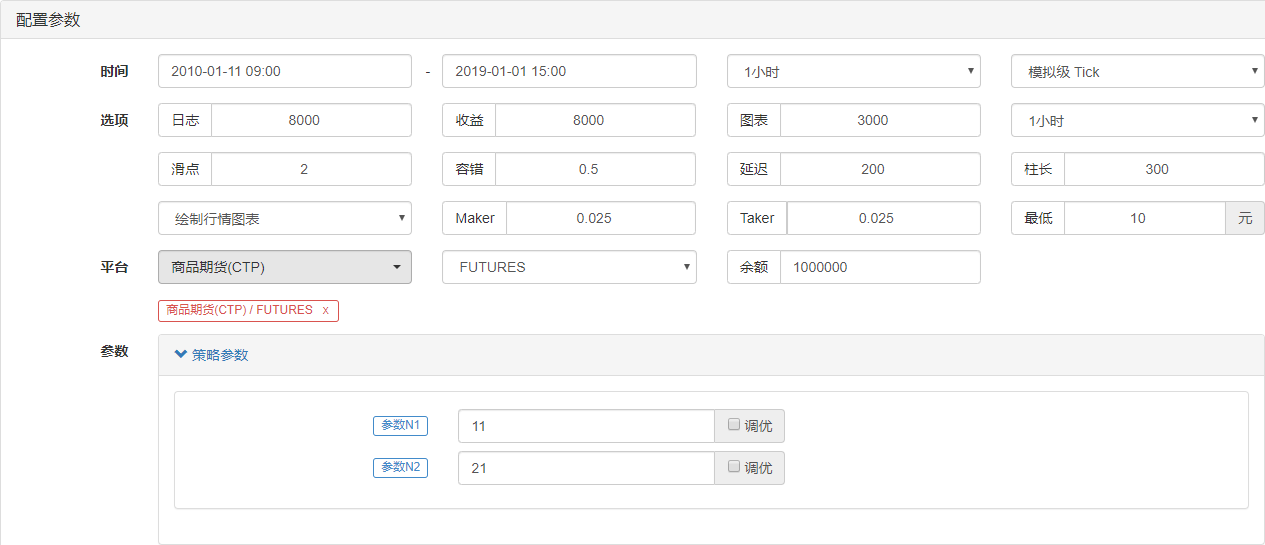
// 参数
N1:=11;
N2:=21;

// 定义价格中线
N3:=N1+N2;
N4:=N2+N3;
HL:=(H+L)/2;

// 鳄鱼线
Y^^SMA(REF(HL,N3),N4,1);
R:=SMA(REF(HL,N2),N3,1);
G:=SMA(REF(HL,N1),N2,1);
First, we define the two external parameters N1 and N2, and then calculate the average of the highest and lowest price HL based on the external parameters, and then calculate the average of HL using different parameters, respectively, for the lip kiss is the small cycle of the midline again average, the tooth is the middle cycle of the midline again average, the hip is the large cycle of the midline again average.
A very graphic definition of the concept of a segmentation in the Chaos Operating System is given by the following analogy: the palm is open, the fingers are pointing upwards, the middle finger is the segmentation upwards, the thumb and index finger on the left, the index and middle fingers on the right, respectively, represent the uninnovated high K-line. A basic segmentation is made up of these 5 K-lines.
// 分形
TOP_N:=BARSLAST(REF(H,2)=HHV(H,5))+2;
BOTTOM_N:=BARSLAST(REF(L,2)=LLV(L,5))+2;

TOP:=REF(H,TOP_N);
BOTTOM:=REF(L,BOTTOM_N);

MAX_YRG^^MAX(MAX(Y,R),G);
MIN_YRG^^MIN(MIN(Y,R),G);

TOP_FRACTAL^^VALUEWHEN(H>=MAX_YRG,TOP);
BOTTOM_FRACTAL^^VALUEWHEN(L<=MIN_YRG,BOTTOM);
By calculating the whale line and the fracture, we can write a simple chaos operation strategy based on these two conditions, using a set of index-weighted moving averages as the benchmark price for calculating the whale line and fracture indicators. Of course, the original chaos operation strategy would be more complicated. The code is as follows:
// 如果当前无多单,并且收盘价升破上分形,并且上分形在鳄鱼线上方时,多头开仓
BKVOL=0 AND C>=TOP_FRACTAL AND TOP_FRACTAL>MAX_YRG,BPK(1);
// 如果当前无空单,并且收盘价跌破下分形,并且下分形在鳄鱼线下方时,空头开仓
SKVOL=0 AND C<=BOTTOM_FRACTAL AND BOTTOM_FRACTAL<MIN_YRG,SPK(1);

// 如果收盘价跌破鳄鱼的下巴时,多头平仓
C<Y,SP(BKVOL);
// 如果收盘价升破鳄鱼的下巴时,空头平仓
C>Y,BP(SKVOL);
For the sake of simplicity, I've written a detailed explanation directly into the code, and we can summarize the trading logic of this strategy as follows:
- Multiple openings: If there are no multiple orders at the time, and the closing price rises above the split, and the split is above the whale line.
- Opening empty: If there is no current empty order, and the closing price falls below the clearing, and the clearing is below the sharks line.
- Multi-head placement: If the closing price breaks the jaw of the shark.
- The first is that the market will be in a state of recession.
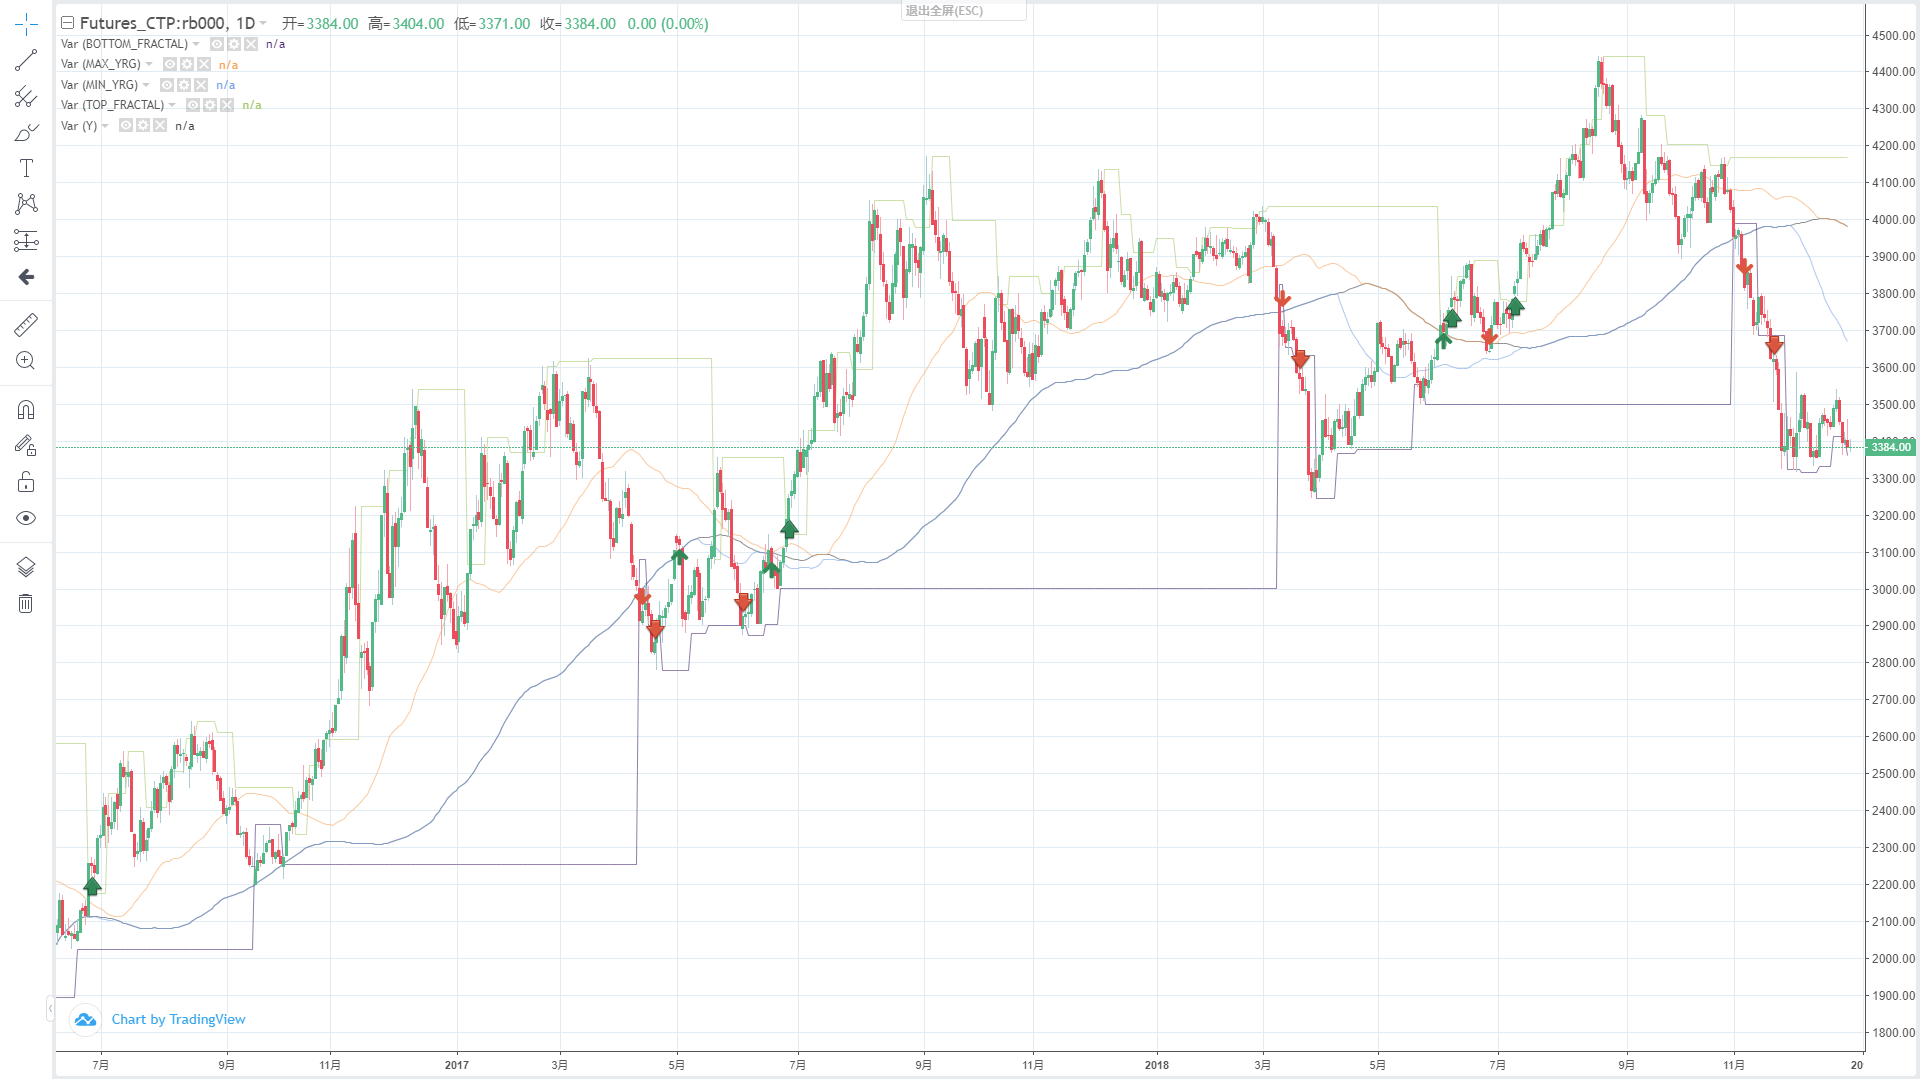
Next, let's see what the outcome of this simple chaotic strategy retest is. To bring the retest closer to the real-world environment, here the transaction fee is set to twice that of the exchange, opening and closing positions plus 2 jump slips.
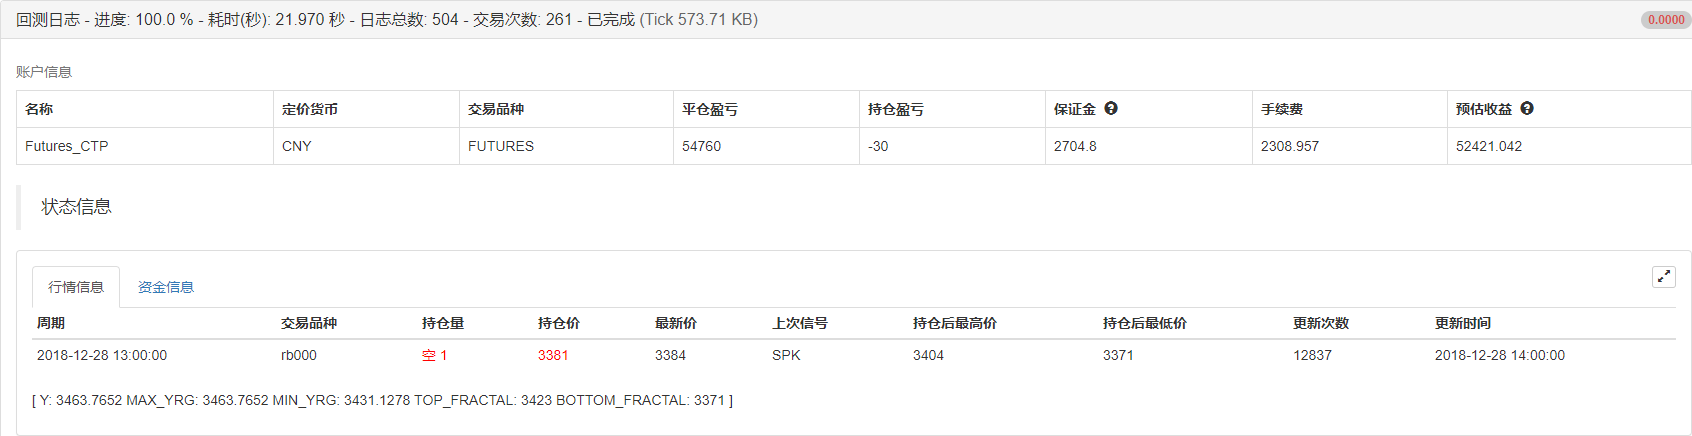
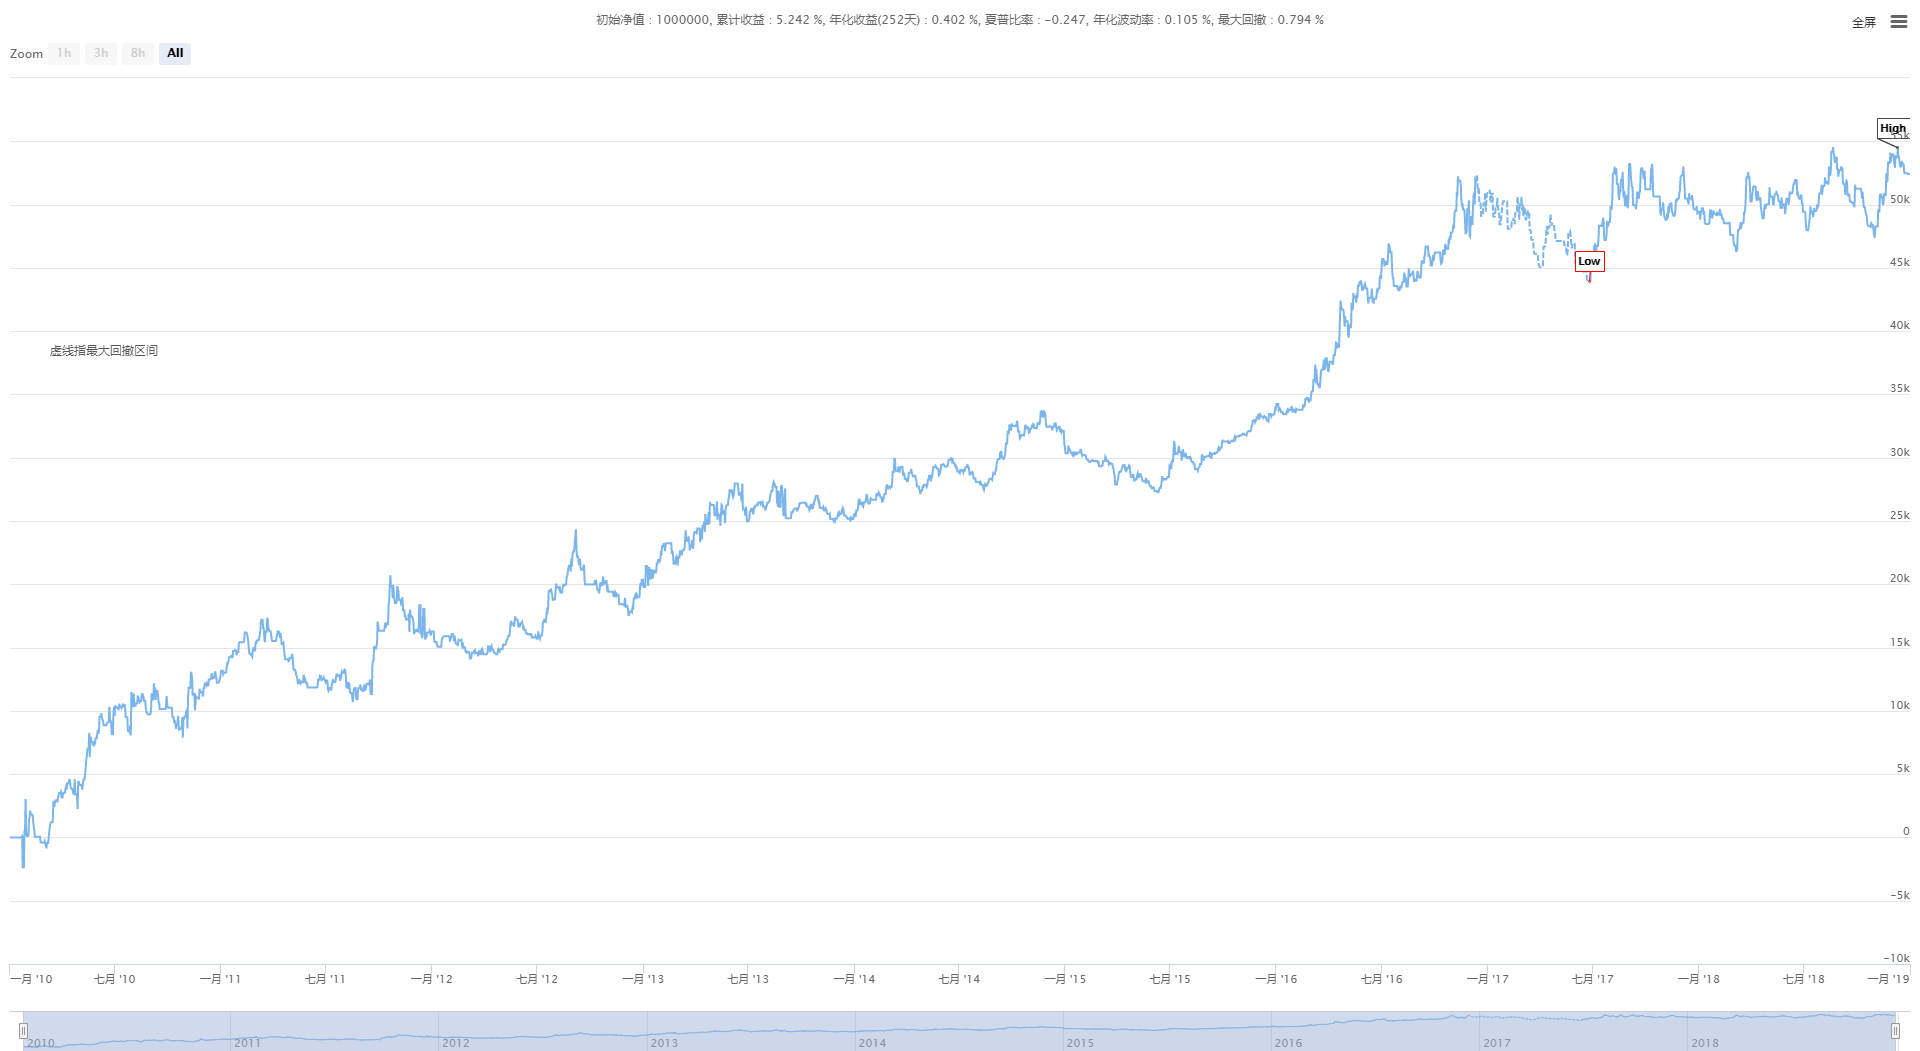
The strategy performed well on the capital curve and the back-tested performance data, and the overall capital curve was steadily upwards. However, after the end of 2016, the market characteristics of the screw steel variety have changed, from the previous one-sided trend of high volatility to a broad-based volatility.
In short, the essence of Chaos Operating is to find a turning point, without worrying about how the market will turn out, without worrying about a false breakthrough, and if it breaks the divide, then go straight in. Never try to predict the market, but be an observer and follower.
3.2 Developing a CTA suite based on JavaScript
In his 1987 book, The Alchemist of Silicon Finance, Soros made an important proposition: I believe that market prices are always wrong in the sense that they are biased towards the future. He argued that the market effectiveness hypothesis is only a theoretical hypothesis, that in reality market participants are not always rational, and that it is impossible for participants to fully access and objectively interpret all information at every point in time, and that even if it is the same information, everyone's feedback is not the same. That is, prices themselves already contain market participants' erroneous expectations, so market prices are always inherently wrong. This may be the source of the profiteers' profits.
Based on the above principles, we also know that in an inefficient futures market, the market influence between the different period swap contracts is not always synchronous, and its pricing is not completely effective. So, based on the price of the different period swap contracts for the same trade mark, if two prices have a large price spread, it is possible to buy and sell futures contracts of different periods at the same time, making cross-term leverage.
As with commodity futures, digital currencies also have associated cross-term leverage packs such as: ETC that week, ETC next week, ETC quarter, etc. For example, suppose that the price difference between ETC that week and ETC quarter is maintained at around 5 over the long term. If a one-day price difference reaches 7, we expect the price difference to return to 5 at some point in the future.
Although such a price difference exists, there is often a lot of uncertainty in artificial leverage, due to the time-consuming, inaccurate and price-changing effects of artificial manipulation. The attraction of quantitative leverage is to capture leverage opportunities and formulate leverage trading strategies through quantitative models, as well as programmatic algorithms that automatically place trading orders on exchanges, quickly and accurately capture opportunities, and efficiently and steadily earn returns.
This course will teach you how to use inventor quantified trading platforms and ETC futures contracts on the OkEX exchange in digital currency trading to demonstrate a simple strategy of leverage, which can be used to capture the visible profits from every moment of leverage while hedging the potential risks.
Creating a digital currency cross-currency strategyDifficulty: AverageStrategic environment
- This is the first time that the ETC has traded on ETH since its inception.
- Price difference data: ETC during the week - ETC quarter (except for the co-integration check)
- Trading cycle: 5 minutes
- 头寸匹配:1:1
- Type of transaction: cross-section of the same variety
Strategic logic
- If the current account does not hold stock and the price is less than boll down, then the price is overbought.
- If the current account does not hold stock and the price is higher than the boll, then the short position is open.
- If the current account holds more ETC on a weekly basis and holds more ETC on a quarterly basis, and the price difference is greater than the boll, then the price difference is flat; i.e. sell ETC on a weekly basis and buy ETC on a quarterly basis.
- If the current account holds ETC on a weekly basis and holds multiple ETC orders on a quarterly basis, and the price is less than the boll in the middle of the track, then the spot price is the difference; i.e. buy ETC on a weekly basis and sell ETC on a quarterly basis.
The above is a simple description of the logic of the digital currency cross-term arbitrage strategy, so how do you implement your ideas in the program?
function Data() {}  // 基础数据函数
Data.prototype.mp = function () {}  // 持仓函数
Data.prototype.boll = function () {}  // 指标函数
Data.prototype.trade = function () {}  // 下单函数
Data.prototype.cancelOrders = function () {}  // 撤单函数
Data.prototype.isEven = function () {}  // 处理单只合约函数
Data.prototype.drawingChart = function () {}  // 画图函数

function onTick() {
    var data = new Data(tradeTypeA, tradeTypeB);  // 创建一个基础数据对象
    var accountStocks = data.accountData.Stocks;  // 账户余额
    var boll = data.boll(dataLength, timeCycle);  // 计算boll技术指标
    data.trade();  // 计算交易条件下单
    data.cancelOrders();  // 撤单
    data.drawingChart(boll);  // 画图
    data.isEven();  // 处理持有单个合约
}

//入口函数
function main() {
    while (true) {  // 进入轮询模式
        onTick();  // 执行onTick函数
        Sleep(500);  // 休眠0.5秒
    }
}
Imagine what the transaction process would be like in a master transaction. In a system transaction, there is no essential difference except: data acquisition, calculation data, order transaction, post-order processing. So it is also the case in a program, first the program executes the 20th line main function, a conventionally accepted rule, when the program executes the transaction strategy processing, it enters an infinite loop mode, i.e. rounding mode, and in the rounding mode, the onTick function will be executed repeatedly.
So in the onTick function, that's the process we use in subjective trading: first we get the basic price data, then we get the account balance, then we calculate the indicator, then we start to calculate the terms of the transaction and place the order, and finally the post-order processing, including: withdrawal, drawing, processing of individual contracts.
It is easy to build a strategic framework by comparing strategic ideas and the trading process. The whole strategy can be simplified into three steps:
- The transaction was pre-processed.
- It's a great way to get and calculate data.
- The order is then processed.
Once the trading strategy framework has been built, it is necessary to fill in the necessary detail code in the strategy framework based on the actual trading process and transaction details.
A. Pre-processing before the transaction
1. Declare the necessary global variables
- Declare a chart object for a configured chart
var chart = {} - Call the Chart function, initialize the chart
var ObjChart = Chart ( chart ) - Declare an empty array for storing price difference sequences
var bars = [] - Declare a recording of historical data as a timestamp variable
var oldTime = 0
2. External parameters of the configuration policy
var tradeTypeA = "this_week"; // 套利A合约
var tradeTypeB = "quarter"; // 套利B合约
var dataLength = 10; //指标周期长度
var timeCycle = 1; // K线周期
var name = "ETC"; // 币种
var unit = 1; // 下单量
3. Define the data processing function
- Basic data function: Data () Create a constructor function Data and define its internal properties. These include: account data, holding data, K-line data time frames, bid/ask spread, positive/negative bid/ask spread.
function Data(tradeTypeA, tradeTypeB) { // 传入套利A合约和套利B合约
    this.accountData = _C(exchange.GetAccount); // 获取账户信息
    this.positionData = _C(exchange.GetPosition); // 获取持仓信息
    var recordsData = _C(exchange.GetRecords); //获取K线数据
    exchange.SetContractType(tradeTypeA); // 订阅套利A合约
    var depthDataA = _C(exchange.GetDepth); // 套利A合约深度数据
    exchange.SetContractType(tradeTypeB); // 订阅套利B合约
    var depthDataB = _C(exchange.GetDepth); // 套利B合约深度数据
    this.time = recordsData[recordsData.length - 1].Time; // 获取最新数据时间
    this.askA = depthDataA.Asks[0].Price; // 套利A合约卖一价
    this.bidA = depthDataA.Bids[0].Price; // 套利A合约买一价
    this.askB = depthDataB.Asks[0].Price; // 套利B合约卖一价
    this.bidB = depthDataB.Bids[0].Price; // 套利B合约买一价
    // 正套价差(合约A卖一价 - 合约B买一价)
    this.basb = depthDataA.Asks[0].Price - depthDataB.Bids[0].Price;
    // 反套价差(合约A买一价 - 合约B卖一价)
    this.sabb = depthDataA.Bids[0].Price - depthDataB.Asks[0].Price;
}
- Obtain the holding function:mp () Goes through the entire holding array, returns the number of holdings for the specified contract, the number of holdings for the specified direction, if none, returns false
Data.prototype.mp = function (tradeType, type) {
    var positionData = this.positionData; // 获取持仓信息
    for (var i = 0; i < positionData.length; i++) {
        if (positionData[i].ContractType == tradeType) {
            if (positionData[i].Type == type) {
                if (positionData[i].Amount > 0) {
                    return positionData[i].Amount;
                }
            }
        }
    }
    return false;
}
- K-line and indicator function:boll () New K-line sequences are synthesized based on positive/counter-setting price difference data. The uptrend, midtrend, and downtrend data calculated by the Boll indicator are returned.
Data.prototype.boll = function (num, timeCycle) {
    var self = {}; // 临时对象
    // 正套价差和反套价差中间值
    self.Close = (this.basb + this.sabb) / 2;
    if (this.timeA == this.timeB) {
        self.Time = this.time;
    } // 对比两个深度数据时间戳
    if (this.time - oldTime > timeCycle * 60000) {
        bars.push(self);
        oldTime = this.time;
    } // 根据指定时间周期,在K线数组里面传入价差数据对象
    if (bars.length > num * 2) {
        bars.shift(); // 控制K线数组长度
    } else {
        return;
    }
    var boll = TA.BOLL(bars, num, 2); // 调用talib库中的boll指标
    return {
        up: boll[0][boll[0].length - 1], // boll指标上轨
        middle: boll[1][boll[1].length - 1], // boll指标中轨
        down: boll[2][boll[2].length - 1] // boll指标下轨
    } // 返回一个处理好的boll指标数据
}
- The following function:trade () Enter the name of the order and the type of the order, and then enter the price of the order and return the result. Since it requires two different orders to be placed at the same time, the buy/sell price is converted within the function according to the name of the order.
Data.prototype.trade = function (tradeType, type) {
    exchange.SetContractType(tradeType); // 下单前先重新订阅合约
    var askPrice, bidPrice;
    if (tradeType == tradeTypeA) { // 如果是A合约下单
        askPrice = this.askA; // 设置askPrice
        bidPrice = this.bidA; // 设置bidPrice
    } else if (tradeType == tradeTypeB) { // 如果是B合约下单
        askPrice = this.askB; // 设置askPrice
        bidPrice = this.bidB; // 设置bidPrice
    }
    switch (type) { // 匹配下单模式
        case "buy":
            exchange.SetDirection(type); // 设置下单模式
            return exchange.Buy(askPrice, unit);
        case "sell":
            exchange.SetDirection(type); // 设置下单模式
            return exchange.Sell(bidPrice, unit);
        case "closebuy":
            exchange.SetDirection(type); // 设置下单模式
            return exchange.Sell(bidPrice, unit);
        case "closesell":
            exchange.SetDirection(type); // 设置下单模式
            return exchange.Buy(askPrice, unit);
        default:
            return false;
    }
}
- Cancel Orders () can be used to cancel orders. Retrieves the array of all outstanding orders and cancels them one by one. Returns false if there are any outstanding orders, and true if there are no outstanding orders.
Data.prototype.cancelOrders = function () {
    Sleep(500); // 撤单前先延时,因为有些交易所你懂的
    var orders = _C(exchange.GetOrders); // 获取未成交订单数组
    if (orders.length > 0) { // 如果有未成交的订单
        for (var i = 0; i < orders.length; i++) { //遍历未成交订单数组
            exchange.CancelOrder(orders[i].Id); //逐个取消未成交的订单
            Sleep(500); //延时0.5秒
        }
        return false; // 如果取消了未成交的单子就返回false
    }
    return true; //如果没有未成交的订单就返回true
}
- Processing of single contracts: isEven ()) One-legged trading occurs in the processing of leveraged trades, where all positions are directly dealt with by simply flattening them. Of course, it can also be changed to a tracking method.
Data.prototype.isEven = function () {
    var positionData = this.positionData; // 获取持仓信息
    var type = null; // 转换持仓方向
    // 如果持仓数组长度余2不等于0或者持仓数组长度不等于2
    if (positionData.length % 2 != 0 || positionData.length != 2) {
        for (var i = 0; i < positionData.length; i++) { // 遍历持仓数组
            if (positionData[i].Type == 0) { // 如果是多单
                type = 10; // 设置下单参数
            } else if (positionData[i].Type == 1) { // 如果是空单
                type = -10; // 设置下单参数
            }
            // 平掉所有仓位
            this.trade(positionData[i].ContractType, type, positionData[i].Amount);
        }
    }
}
- DrawingChart () Use the ObjChart.add () method to plot the necessary market data and indicator data in the chart: up, down, up, down, positive/negative.
Data.prototype.drawingChart = function (boll) {
    var nowTime = new Date().getTime();
    ObjChart.add([0, [nowTime, boll.up]]);
    ObjChart.add([1, [nowTime, boll.middle]]);
    ObjChart.add([2, [nowTime, boll.down]]);
    ObjChart.add([3, [nowTime, this.basb]]);
    ObjChart.add([4, [nowTime, this.sabb]]);
    ObjChart.update(chart);
}
4. Execute transaction preprocessing code inside the input function main (), which runs only once after the program starts; these include:
- Filter controls are not important information.
SetErrorFilter ( ) - Set up the digital currency to trade
exchange.IO ( ) - Graphs drawn before the program starts
ObjChart.reset ( ) - Status bar information before the program starts
LogProfitReset ( )
After defining the above transaction preprocessing, the next step is to enter the consultation mode, repeat the onTick () function, and set the sleep time during the consultation, since the API of some digital currency exchanges has built-in limitations on the number of visits in a certain time.
function main() {
    // 过滤控制台中不是很重要的信息
    SetErrorFilter("429|GetRecords:|GetOrders:|GetDepth:|GetAccount|:Buy|Sell|timeout|Futures_OP");
    exchange.IO("currency", name + '_USDT'); //设置要交易的数字货币币种
    ObjChart.reset(); //程序启动前清空之前绘制的图表
    LogProfitReset(); //程序启动前清空之前的状态栏信息
    while (true) { // 进入轮询模式
        onTick(); // 执行onTick函数
        Sleep(500); // 休眠0.5秒
    }
}
Second, get and calculate data.
- Obtain basic data objects, account balances, and Boll indicator data for use in trading logic.
function onTick() {
    var data = new Data(tradeTypeA, tradeTypeB); // 创建一个基础数据对象
    var accountStocks = data.accountData.Stocks; // 账户余额
    var boll = data.boll(dataLength, timeCycle); // 获取boll指标数据
    if (!boll) return; // 如果没有boll数据就返回
}
Third, order and follow-up
- According to the above strategic logic, the buy and sell operation is executed. First, the price and indicator conditions are determined, then the holding conditions are determined, and finally the trade () sub-order function is executed.
// 价差说明
// basb = (合约A卖一价 - 合约B买一价)
// sabb = (合约A买一价 - 合约B卖一价)
if (data.sabb > boll.middle && data.sabb < boll.up) { // 如果sabb高于中轨
    if (data.mp(tradeTypeA, 0)) { // 下单前检测合约A是否有多单
        data.trade(tradeTypeA, "closebuy"); // 合约A平多
    }
    if (data.mp(tradeTypeB, 1)) { // 下单前检测合约B是否有空单
        data.trade(tradeTypeB, "closesell"); // 合约B平空
    }
} else if (data.basb < boll.middle && data.basb > boll.down) { // 如果basb低于中轨
    if (data.mp(tradeTypeA, 1)) { // 下单前检测合约A是否有空单
        data.trade(tradeTypeA, "closesell"); // 合约A平空
    }
    if (data.mp(tradeTypeB, 0)) { // 下单前检测合约B是否有多单
        data.trade(tradeTypeB, "closebuy"); // 合约B平多
    }
}
if (accountStocks * Math.max(data.askA, data.askB) > 1) { // 如果账户有余额
    if (data.basb < boll.down) { // 如果basb价差低于下轨
        if (!data.mp(tradeTypeA, 0)) { // 下单前检测合约A是否有多单
            data.trade(tradeTypeA, "buy"); // 合约A开多
        }
        if (!data.mp(tradeTypeB, 1)) { // 下单前检测合约B是否有空单
            data.trade(tradeTypeB, "sell"); // 合约B开空
        }
    } else if (data.sabb > boll.up) { // 如果sabb价差高于上轨
        if (!data.mp(tradeTypeA, 1)) { // 下单前检测合约A是否有空单
            data.trade(tradeTypeA, "sell"); // 合约A开空
        }
        if (!data.mp(tradeTypeB, 0)) { // 下单前检测合约B是否有多单
            data.trade(tradeTypeB, "buy"); // 合约B开多
        }
    }
}
- Once the order has been completed, it is necessary to deal with anomalies such as outstanding orders, holding a single contract, and draw a chart.
data.cancelOrders(); // 撤单
data.drawingChart(boll); // 画图
data.isEven(); // 处理持有单个合约
We have created a simple strategy for a digital currency's long-term leverage, complete with over 200 lines of code.
// 全局变量
// 声明一个配置图表的 chart 对象
var chart = {
__isStock: true,
tooltip: {
xDateFormat: '%Y-%m-%d %H:%M:%S, %A'
},
title: {
text: '交易盈亏曲线图(详细)'
},
rangeSelector: {
buttons: [{
type: 'hour',
count: 1,
text: '1h'
}, {
type: 'hour',
count: 2,
text: '3h'
}, {
type: 'hour',
count: 8,
text: '8h'
}, {
type: 'all',
text: 'All'
}],
selected: 0,
inputEnabled: false
},
xAxis: {
type: 'datetime'
},
yAxis: {
title: {
text: '价差'
},
opposite: false,
},
series: [{
name: "上轨",
id: "τ║┐1,up",
data: []
}, {
name: "中轨",
id: "τ║┐2,middle",
data: []
}, {
name: "下轨",
id: "τ║┐3,down",
data: []
}, {
name: "basb",
id: "τ║┐4,basb",
data: []
}, {
name: "sabb",
id: "τ║┐5,sabb",
data: []
}]
};
var ObjChart = Chart(chart); // 画图对象
var bars = []; // 存储价差序列
var oldTime = 0; // 记录历史数据时间戳
// 参数
var tradeTypeA = "this_week"; // 套利A合约
var tradeTypeB = "quarter"; // 套利B合约
var dataLength = 10; //指标周期长度
var timeCycle = 1; // K线周期
var name = "ETC"; // 币种
var unit = 1; // 下单量
// 基础数据
function Data(tradeTypeA, tradeTypeB) { // 传入套利A合约和套利B合约
this.accountData = _C(exchange.GetAccount); // 获取账户信息
this.positionData = _C(exchange.GetPosition); // 获取持仓信息
var recordsData = _C(exchange.GetRecords); //获取K线数据
exchange.SetContractType(tradeTypeA); // 订阅套利A合约
var depthDataA = _C(exchange.GetDepth); // 套利A合约深度数据
exchange.SetContractType(tradeTypeB); // 订阅套利B合约
var depthDataB = _C(exchange.GetDepth); // 套利B合约深度数据
this.time = recordsData[recordsData.length - 1].Time; // 获取最新数据时间
this.askA = depthDataA.Asks[0].Price; // 套利A合约卖一价
this.bidA = depthDataA.Bids[0].Price; // 套利A合约买一价
this.askB = depthDataB.Asks[0].Price; // 套利B合约卖一价
this.bidB = depthDataB.Bids[0].Price; // 套利B合约买一价
// 正套价差(合约A卖一价 - 合约B买一价)
this.basb = depthDataA.Asks[0].Price - depthDataB.Bids[0].Price;
// 反套价差(合约A买一价 - 合约B卖一价)
this.sabb = depthDataA.Bids[0].Price - depthDataB.Asks[0].Price;
}
// 获取持仓
Data.prototype.mp = function (tradeType, type) {
var positionData = this.positionData; // 获取持仓信息
for (var i = 0; i < positionData.length; i++) {
if (positionData[i].ContractType == tradeType) {
if (positionData[i].Type == type) {
if (positionData[i].Amount > 0) {
return positionData[i].Amount;
}
}
}
}
return false;
}
// 合成新K线数据和boll指标数据
Data.prototype.boll = function (num, timeCycle) {
var self = {}; // 临时对象
// 正套价差和反套价差中间值
self.Close = (this.basb + this.sabb) / 2;
if (this.timeA == this.timeB) {
self.Time = this.time;
} // 对比两个深度数据时间戳
if (this.time - oldTime > timeCycle * 60000) {
bars.push(self);
oldTime = this.time;
} // 根据指定时间周期,在K线数组里面传入价差数据对象
if (bars.length > num * 2) {
bars.shift(); // 控制K线数组长度
} else {
return;
}
var boll = TA.BOLL(bars, num, 2); // 调用talib库中的boll指标
return {
up: boll[0][boll[0].length - 1], // boll指标上轨
middle: boll[1][boll[1].length - 1], // boll指标中轨
down: boll[2][boll[2].length - 1] // boll指标下轨
} // 返回一个处理好的boll指标数据
}
// 下单
Data.prototype.trade = function (tradeType, type) {
exchange.SetContractType(tradeType); // 下单前先重新订阅合约
var askPrice, bidPrice;
if (tradeType == tradeTypeA) { // 如果是A合约下单
askPrice = this.askA; // 设置askPrice
bidPrice = this.bidA; // 设置bidPrice
} else if (tradeType == tradeTypeB) { // 如果是B合约下单
askPrice = this.askB; // 设置askPrice
bidPrice = this.bidB; // 设置bidPrice
}
switch (type) { // 匹配下单模式
case "buy":
exchange.SetDirection(type); // 设置下单模式
return exchange.Buy(askPrice, unit);
case "sell":
exchange.SetDirection(type); // 设置下单模式
return exchange.Sell(bidPrice, unit);
case "closebuy":
exchange.SetDirection(type); // 设置下单模式
return exchange.Sell(bidPrice, unit);
case "closesell":
exchange.SetDirection(type); // 设置下单模式
return exchange.Buy(askPrice, unit);
default:
return false;
}
}
// 取消订单
Data.prototype.cancelOrders = function () {
Sleep(500); // 撤单前先延时,因为有些交易所你懂的
var orders = _C(exchange.GetOrders); // 获取未成交订单数组
if (orders.length > 0) { // 如果有未成交的订单
for (var i = 0; i < orders.length; i++) { //遍历未成交订单数组
exchange.CancelOrder(orders[i].Id); //逐个取消未成交的订单
Sleep(500); //延时0.5秒
}
return false; // 如果取消了未成交的单子就返回false
}
return true; //如果没有未成交的订单就返回true
}
// 处理持有单个合约
Data.prototype.isEven = function () {
var positionData = this.positionData; // 获取持仓信息
var type = null; // 转换持仓方向
// 如果持仓数组长度余2不等于0或者持仓数组长度不等于2
if (positionData.length % 2 != 0 || positionData.length != 2) {
for (var i = 0; i < positionData.length; i++) { // ΘüìσÄåµîüΣ╗ôµò░τ╗- Quantifying Fundamental Analysis in the Cryptocurrency Market: Let Data Speak for Itself!
- Quantified research on the basics of coin circles - stop believing in all kinds of crazy professors, data is objective!
- The inventor of the Quantitative Data Exploration Module, an essential tool in the field of quantitative trading.
- Mastering Everything - Introduction to FMZ New Version of Trading Terminal (with TRB Arbitrage Source Code)
- Get all the details about the new FMZ trading terminal (with the TRB suite source code)
- FMZ Quant: An Analysis of Common Requirements Design Examples in the Cryptocurrency Market (II)
- How to Exploit Brainless Selling Bots with a High-Frequency Strategy in 80 Lines of Code
- FMZ quantification: common demands on the cryptocurrency market design example analysis (II)
- How to exploit brainless robots for sale with high-frequency strategies of 80 lines of code
- FMZ Quant: An Analysis of Common Requirements Design Examples in the Cryptocurrency Market (I)
- FMZ quantification: common demands of the cryptocurrency market design instance analysis (1)
- Creating a Bitcoin trading robot that won't lose money
- Nine trading rules that helped a trader go from $1,000 to $46,000 in less than a year
dianwan99Learning to learn
DadyLearning
xunfeng91Learning