Application of technical indicators in quantitative trading
Author: , Created: 2019-06-29 14:42:04, Updated: 2023-10-26 20:03:24[TOC]

Aaron's index is brief.
In technical analysis, Aroon is a very unique technical indicator. The word Aroon is derived from Sanskrit and means "dawn glow". Unlike MA, MACD, and KDJ, it is not as well known and was not introduced until 1995 by Tushar Chande, who also invented CMOs and IMIs.
Aaron indicator in the graph
The Aron indicator helps traders predict price movements in relation to the relative position of the trend area by calculating the number of K lines between the current K line and the previous high and low prices. It consists of two parts, namely: the Aron Up and the Aron Down, which move up and down between 0 and 100.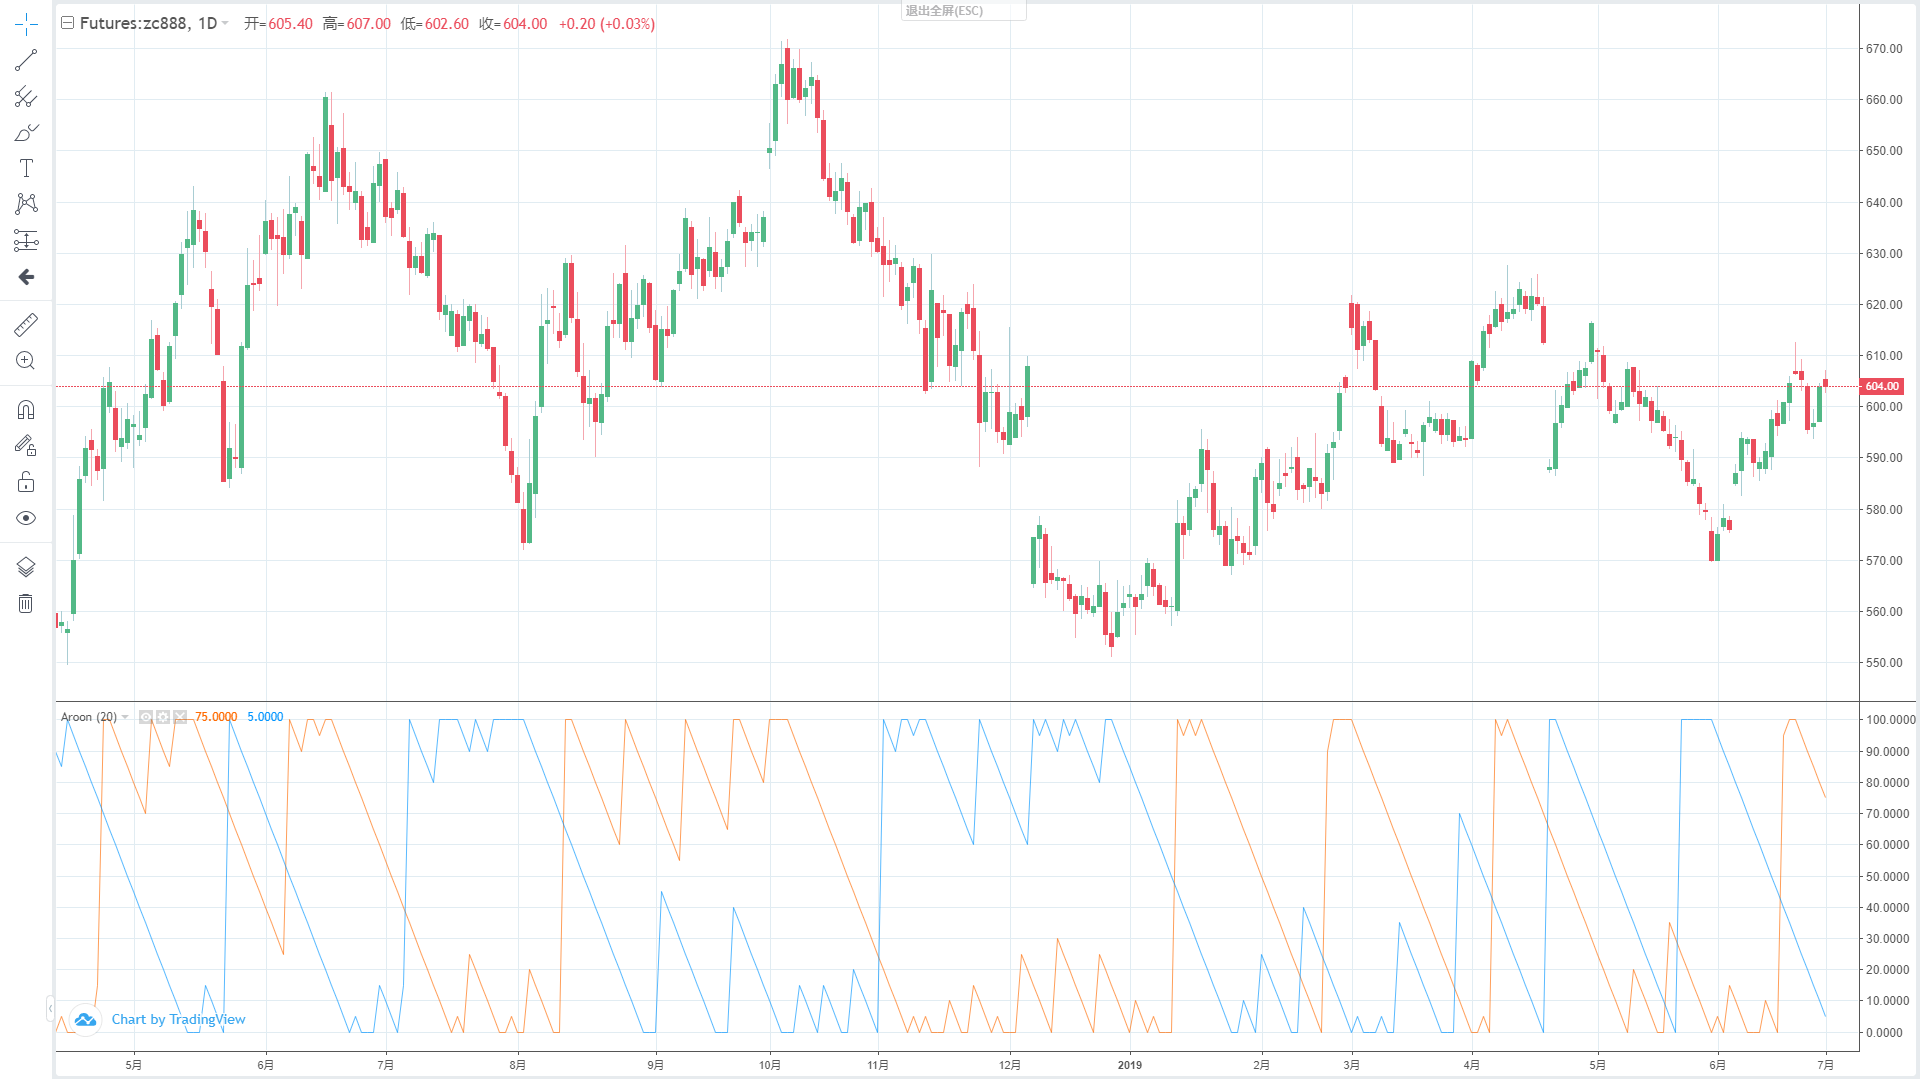
Calculation of the Aron indicator
The Aron indicator requires that you first set a time cycle parameter, just like setting a straight-line cycle parameter. In traditional trading software, this number of cycles is 14, of course this cycle parameter is not fixed, you can also set it to 10 or 50, etc. For ease of understanding, we define this time cycle parameter as: N. After determining N, we can calculate the Aron upline ((AroonUp)) and Aaron downline ((AroonDown)) and the specific calculation formula is as follows:
- AroonUp = [ (Cycle parameter set - number of cycles after the highest price) / number of cycles calculated ] * 100
- Aaron Down = [ (Cycle parameter set - number of cycles after lowest price) / number of cycles calculated ] * 100
From this formula, we can roughly see the idea of the Aron indicator. That is, how many cycles are there, the price below the recent high / low, the auxiliary prediction of whether the current trend will continue, while measuring the strength and weakness of the current trend. If we classify this indicator, it is obvious that it belongs to the trend-following type.
How to use the Aron indicator
AroonUp and AroonDown reflect that the current time is very close to the previous high or low price, and the higher the nearer value if the time is, the smaller the farther value if the time is. And when the two lines intersect, it predicts a possible change in price direction, and future prices may rise further if the AroonUp above the AroonDown indicates that the price is in an uptrend; if the AroonDown indicates that the price is in a downtrend, the future prices may fall further.
We can also set several fixed values to accurately enter the time. We know that the Aron indicator is always running up and down between 0 and 100, so when the market is in an uptrend, i.e. when the AronUp is above the AronDown, when the AronUp is greater than 50, the uptrend has formed, and future prices may continue to rise; when the AronUp drops below 50, the uptrend momentum is weakening, and future prices may shake and fall.
Conversely, when the market is in a downtrend, i.e. when the AroonDown is above the AroonUp, when the AroonDown is greater than 50, the market downtrend has formed and the future price may continue to fall; when the AroonDown is below the 50, the downward momentum is weakening and the future price may move up and upwards.
- When AroonUp is larger than AroonDown, and AroonUp is larger than 50, multiple positions are opened;
- When AroonUp is less than AroonDown, or AroonUp is less than 50, multiple heads are tied;
- When AroonDown is larger than AroonUp, and AroonDown is larger than 50, the empty position is opened;
- When AroonDown is less than AroonUp, or AroonDown is less than 50, the blank heads flat;
Build trading strategies based on the Aron indicator
After clearing the transaction logic, we can implement it in code, and this article we continue to use JavaScript language, variety or commodity futures.fmz.com> Login > Control Center > Policy Library > Create a new policy to start writing a policy, see the notes in the code below.
Step one: Use the CTA frameworkPlease note: Please click on the link below:商品期货交易类库If you want to convert it to a digital currency, click:数字货币现货交易类库。
function main() {
    // ZC000/ZC888 指用指数做为行情源但交易映射到主力连续合约上
    $.CTA("ZC000/ZC888", function(st) {

    })
}
Step two: Get the data
function main() {
    $.CTA("ZC000/ZC888", function(st) {
        var r = st.records;  // 获取K线数组
        var mp = st.position.amount;  // 获取持仓数量
    })
}
Step three: Calculate the Aron indicator
function main() {
    $.CTA("ZC000/ZC888", function(st) {
        var r = st.records;  // 获取K线数组
        var mp = st.position.amount;  // 获取持仓数量
        if (r.length < 21) {  // 判断K线数据是否足够
            return;
        }
        var aroon = talib.AROON(r, 20);  // 阿隆指标
        var aroonUp = aroon[1][aroon[1].length - 2];  // 阿隆指标上线倒数第2根数据
        var aroonDown = aroon[0][aroon[0].length - 2];  // 阿隆指标下线倒数第2根数据
    })
}
Step 4: Calculate the terms of the transaction and place an order
function main() {
    $.CTA("ZC000/ZC888", function(st) {
        var r = st.records;  // 获取K线数组
        var mp = st.position.amount;  // 获取持仓数量
        if (r.length < 21) {  // 判断K线数据是否足够
            return;
        }
        var aroon = talib.AROON(r, 20);  // 阿隆指标
        var aroonUp = aroon[1][aroon[1].length - 2];  // 阿隆指标上线倒数第2根数据
        var aroonDown = aroon[0][aroon[0].length - 2];  // 阿隆指标下线倒数第2根数据
        if (mp == 0 && aroonUp > aroonDown && aroonUp > 50) {
            return 1;  // 多头开仓
        }
        if (mp == 0 && aroonDown > aroonUp && aroonDown > 50) {
            return -1;  // 空头开仓
        }
        if (mp > 0 && (aroonUp < aroonDown || aroonUp < 50)) {
            return -1;  // 多头平台
        }
        if (mp < 0 && (aroonDown < aroonUp || aroonDown < 50)) {
            return 1;  // 空头平台
        }
    })
}
// 以上代码就是基于JavaScript语言完整的策略。

// --------------------分割线--------------------

// 为了照顾伸手党,顺便也把这个策略翻译成My语言。同时该也可以用于数字货币,以下是完整的策略代码:
AROONUP := ((N - HHVBARS(H, N)) / N) * 100;  // 阿隆指标上线
AROONDOWN := ((N - LLVBARS(L, N)) / N) * 100;  // 阿隆指标下线
AROONUP > AROONDOWN && AROONUP > BKV, BK;  // 多头开仓
AROONDOWN > AROONUP && AROONDOWN > SKV, SK;  // 空头开仓
AROONUP < AROONDOWN || AROONUP < SPV, SP;  // 多头平台
AROONDOWN < AROONUP || AROONDOWN < BPV, BP;  // 空头平台
AUTOFILTER;
Strategic retesting
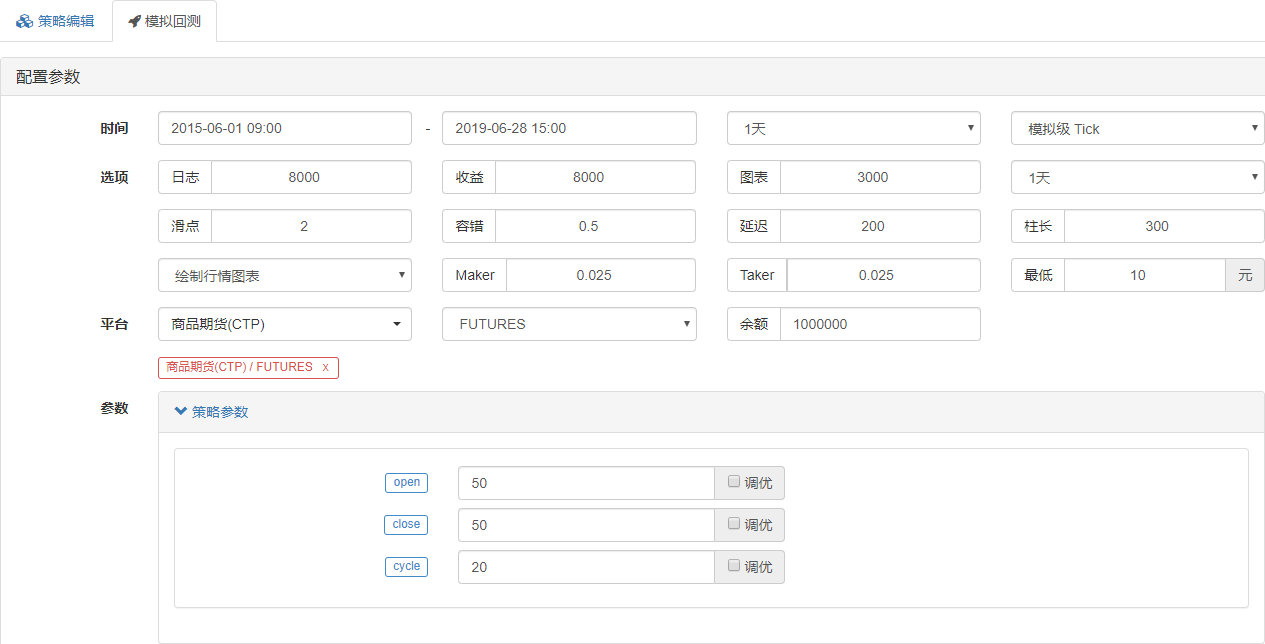
In order to get closer to the real trading environment, we used a stress test with 2 jumps in the open position and 2 times the transaction fees in the retest, testing the environment as follows:
- Industry varieties: index of power coal
- Trade varieties: powered mainly by coal
- Time: from 01 June 2015 to 28 June 2019
- Cycle: daylight
- Slide point: 2 jumps to the open position
- Fee: Exchange doubled
Testing environment
 Benefits are clear
 The funding curve
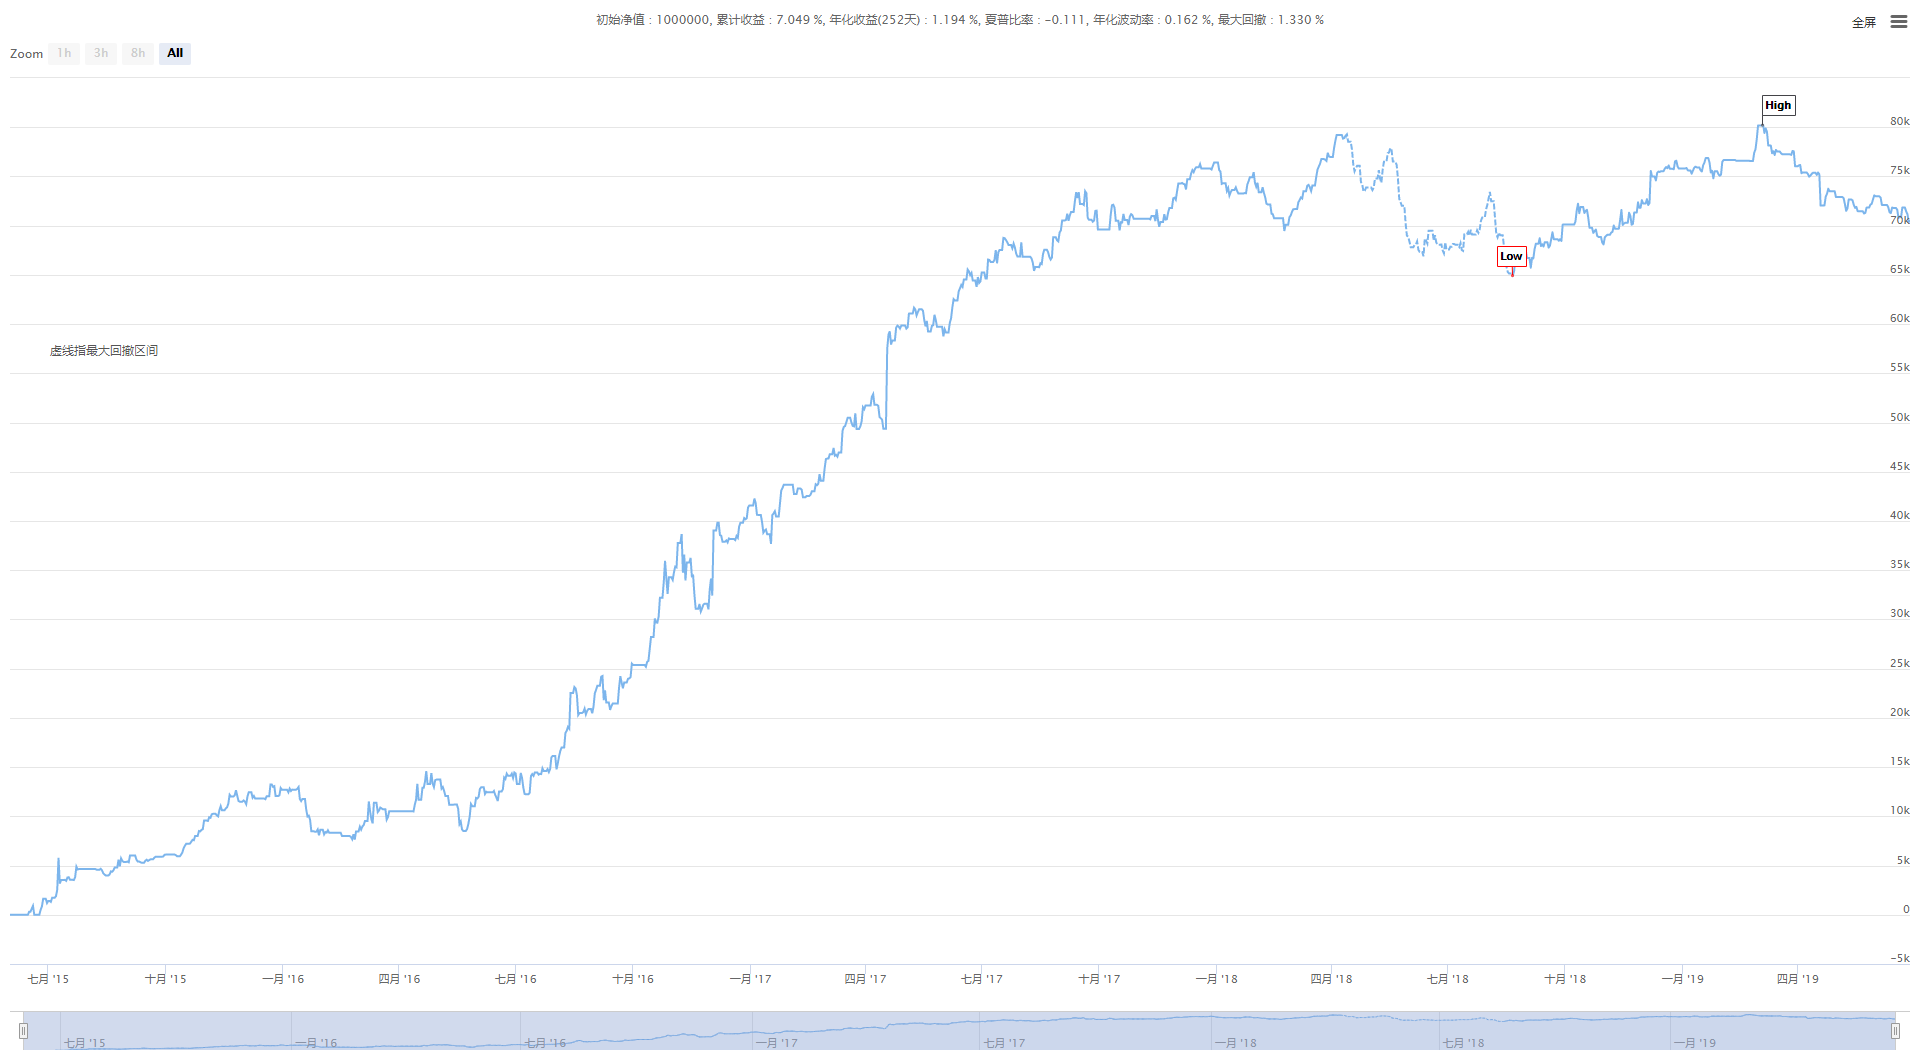 From the above retrospective results, the strategy performs well when the market trend is fluid, and the Aron indicator can be fully tracked to the market, whether up or down. The capital curve also moves upwards overall, with no significant pullback.
The strengths and weaknesses of the Aron Index
- Advantages: The Aron indicator can judge the state of trending markets, combine the ability to detect trending markets and determine price movements, and help traders improve the utilization of funds, which is especially important in volatile markets.
- Disadvantages: The Aron indicator is only one of a series of trend-tracking indicators, and it also has the disadvantage of being a trend-tracking indicator. It only determines the number of cycles of the highest or lowest price at a given time, but sometimes the highest or lowest price will be random in the entire market trend, which will interfere with the Aron indicator itself, causing false signals.
Click on the copy policy source code
Summary
In the strategy, we fixed a number of parameters, such as: AaroonUp or AaroonDown greater than or less than 50, causing a lag in the strategy, in many cases the market rises or falls for a period of time before opening a trade. This, while increasing the win rate and reducing the maximum drawdown rate, also misses a lot of benefits, which also confirms the truth of the win-loss synergy.
- Quantifying Fundamental Analysis in the Cryptocurrency Market: Let Data Speak for Itself!
- Quantified research on the basics of coin circles - stop believing in all kinds of crazy professors, data is objective!
- The inventor of the Quantitative Data Exploration Module, an essential tool in the field of quantitative trading.
- Mastering Everything - Introduction to FMZ New Version of Trading Terminal (with TRB Arbitrage Source Code)
- Get all the details about the new FMZ trading terminal (with the TRB suite source code)
- FMZ Quant: An Analysis of Common Requirements Design Examples in the Cryptocurrency Market (II)
- How to Exploit Brainless Selling Bots with a High-Frequency Strategy in 80 Lines of Code
- FMZ quantification: common demands on the cryptocurrency market design example analysis (II)
- How to exploit brainless robots for sale with high-frequency strategies of 80 lines of code
- FMZ Quant: An Analysis of Common Requirements Design Examples in the Cryptocurrency Market (I)
- FMZ quantification: common demands of the cryptocurrency market design instance analysis (1)
- An intraday trading strategy using the mean value return between SPY and IWM
- Use JavaScript to implement a quantification policy while running the Go function in a wrapper.
momoxThank you, it's a bit of fun.