Linear hang single-stream strategy based on data playback feature development
Author: , Created: 2019-12-13 17:13:07, Updated: 2023-10-17 21:21:36
The Foreword
It is often said that trading is an art, and art is inspired. So today I want to share with you how inventors can use the quantified data playback function to find their own trading inspiration.
Inspiration and a sense of place
Usually, when we talk about inspiration, we are referring to the instantaneous creative state that people experience in the process of thinking. For traders, the left hemisphere of our brain completes a set of rules for strategy writing, allocation of funds, setting parameters, etc. While those trading inspirations and discernment come from the right hemisphere.
Many people have heard of the term "disc sensation", which is a feeling of being confused, as if the current situation is familiar. In trading, this kind of sixth sense intuition, although without logical reasoning and analysis, anticipates the future trend of the market, prompting the trader to make a decision to buy or sell.
How to Get Inspired
In the eyes of outsiders, discernment is a strange and uncanny, a mysterious talent that can be established in the market; in fact, discernment is a summary of the brain's subjective trading experience, a kind of preconceived sense realized through years of discernment.
Although strictly speaking, inspiration is not quite the same as feeling, but I believe that after thousands of times of market exercises, people have a deeper understanding of the market, they will be able to develop their strategies. So if you want to acquire this talent, if you want to develop more trading strategies, no one else, only a handyman.
However, domestic commodity futures and stocks have only a few hours of trading time per day, and it is not easy to improve your trading experience from real-time trading, to form your own profit patterns and trading rules, and to train your own conditioned reflexes in the subconscious. In addition to paying longer time costs, most traders also bear the cost of capital losses. To solve this problem, inventors have quantified the development of data playback functions.
How to use data playback
The data playback functionality can be trained without trading time restrictions on the exchange, supports a variety of commodity futures and digital currency varieties, the market can be manually played back or automatically played back, and can also freely set the historical market start time and playback speed. Compared to other software that generally uses K-line data playback, the inventors quantified the data playback using Tick-level data playback, which is very close to the real-world trading environment, and reproduces the market price data, allowing traders to experience it.
This is the first time I have seen a website that quantifies developers.fmz.comClick on the data exploration page of the Control Center to view the data playback function. There are four options boxes and a selection button, first click on the selection button to see only the varieties that support disk playback, then select the varieties to be played at the top left, then select the start time of the data in the two boxes behind, then select the time period of the data for disk playback, and finally click on the Go button on the far right to turn on the data playback function.
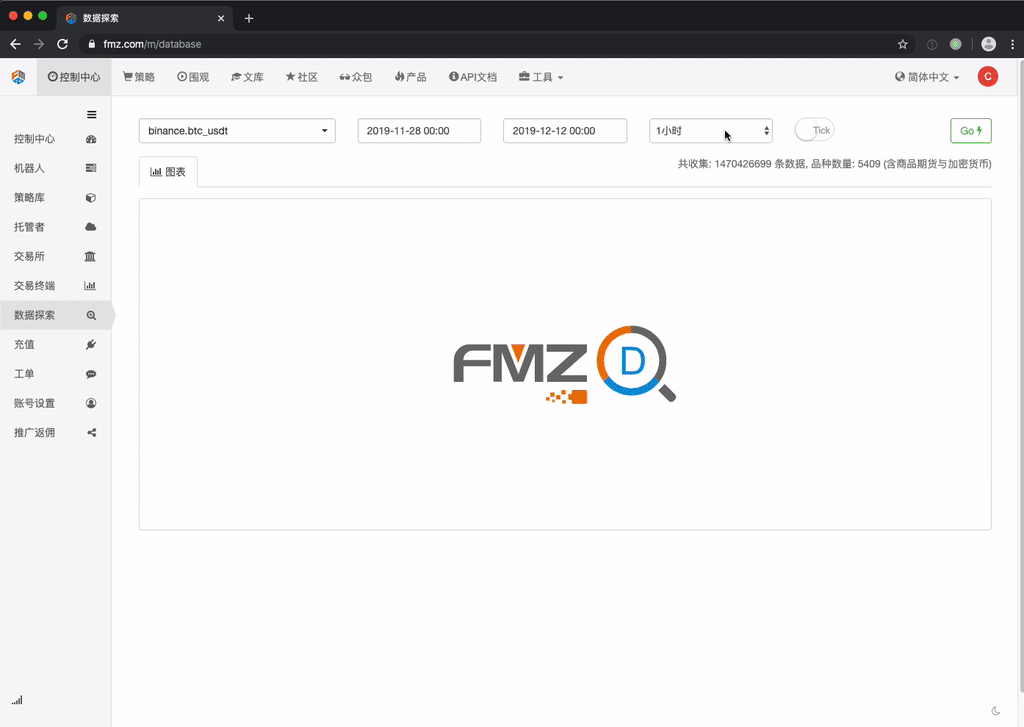
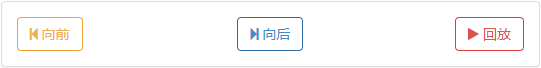
Below the data tag, there are three blocks; on the left is the transaction history, which shows all orders that have been placed in chronological order; in the middle is the purchase and sale listing data with a depth of 20 frames; on the right is the control area for data playback, where you can choose between manual and automatic data playback, which is as simple as using a media player.
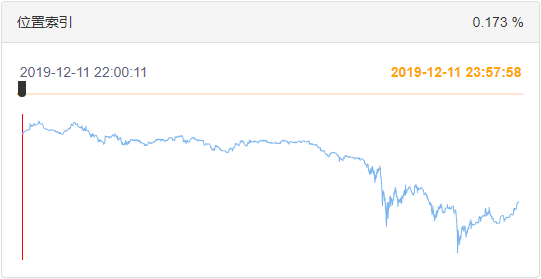
Location indexes can drag and drop tags, allowing quick selection of the start time of data playback.
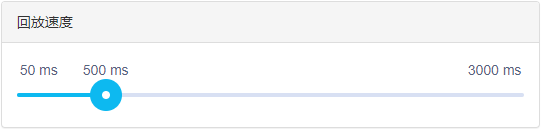
At the bottom, you can also control the speed of the data playback in milliseconds, both accelerating and decelerating when the data playback.
Building strategic logic
Although there are many factors that influence the price decline, including: global economic environment, national macroeconomic policies, related industrial policies, supply and demand relations, international events, interest rates and exchange rates, inflation and deflation, market psychology, unknown factors, etc., the price on the final plate is the result of a multi-party competition with the sky. If there are more buyers than sellers, the price will rise; on the contrary, if there are more sellers than buyers, the price will fall. Then we just need to analyze the price and make a trading strategy.
By quantifying the inventor's return to the most recent monthly BTC_USDT trading pair, we found that the order volume of the Tick data was significantly asymmetric on both sides of the bullish and bearish markets. When the market is bullish, the number of pending orders is significantly greater than the number of pending orders; when the market is bearish, the number of pending orders is significantly less than the number of pending orders.
The answer is yes.
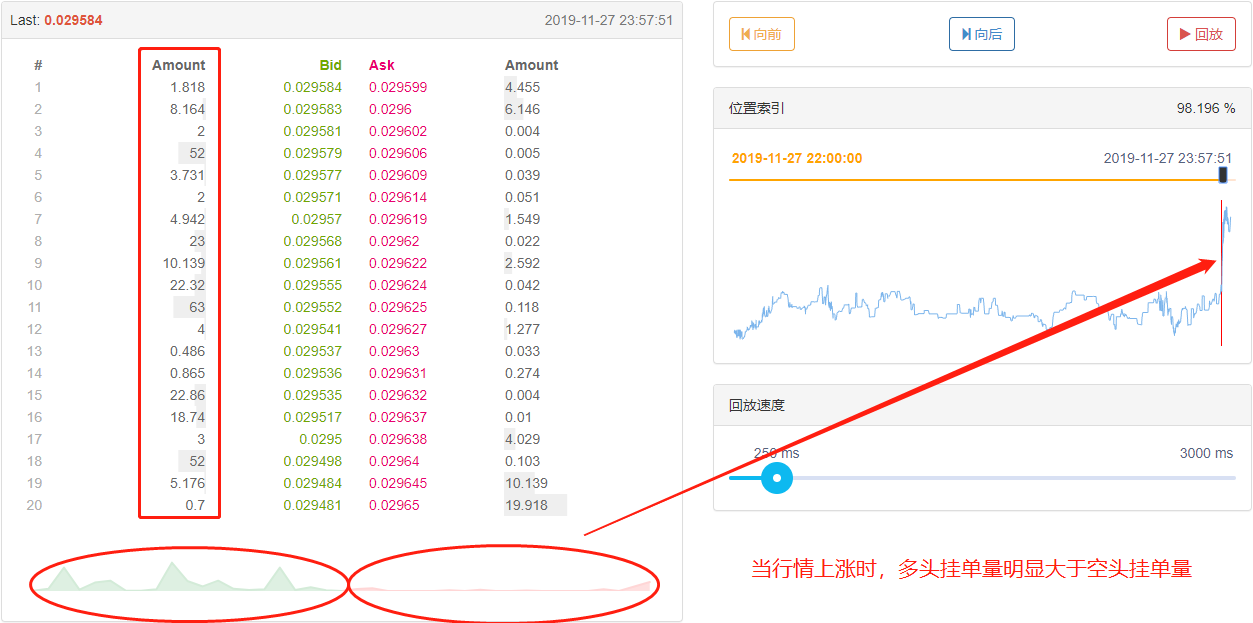
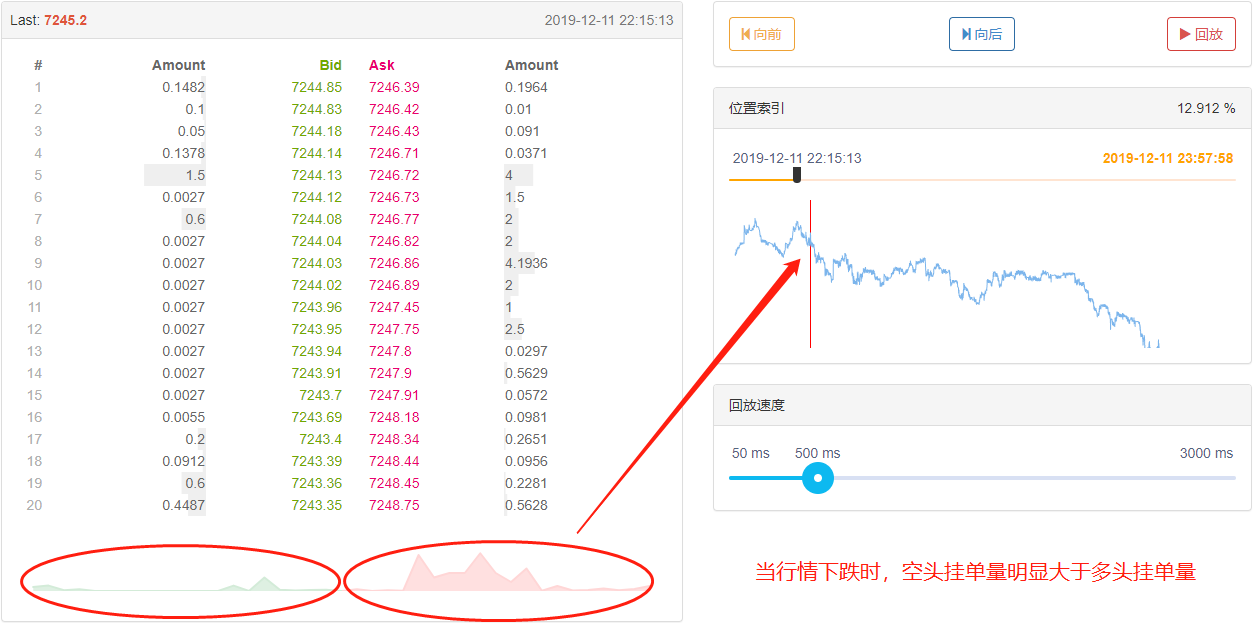
By collecting deep Tick data, we can calculate and compare the number of pending orders on both sides of the multi-head and the potential opportunity to sell if the multi-head combined pending order spread is large. For example, when the multi-head pending order is N times the multi-head pending order, we can assume that most people in the market are watching more, and the probability of price increases in the near future increases; when the multi-head pending order is N times the multi-head pending order, we can assume that most people in the market are watching more, and the probability of price decreases in the near future increases.
Writing a trading strategy
Following the logic of the above strategy, start implementing with the code. Open the following: fmz.com website > Login > Control Center > Policy Library > New policies > Click the drag-down menu in the upper right corner, select the Python language, and start writing the policy.
The first step: drafting a strategic framework
# 策略主函数
def onTick():
    pass


# 程序入口
def main():
    while True:  # 进入无限循环模式
        onTick()  # 执行策略主函数
        Sleep(1000)  # 休眠1秒
We should write the policy in upper case, like a roof, with the frame covered and the wall covered. In this framework, we use two functions: the main function and the onTick function. The main function is the input of the program, which means that the program will execute from here, and then go into infinite loop mode, repeating the onTick function.
Step two: Write global variables
vol_ratio_arr = []  # 多空挂单比率数组
mp = 0  # 虚拟持仓
The reason for defining vol_ratio_arr as a global variable is that my strategy requires collecting a multivariate hanging ratio of a piece of Tick data, and if we put the vol_ratio_arr variable into the onTick function, as loop running is obviously irrational, we need to change the value of the variable in loop mode only when a certain condition is reached, the most reasonable way is to put this variable outside the loop.
Holding management is very necessary because it relates to the logic of buying and selling, which we usually do in spot trading, where we calculate the currency pair held by accessing the account. Here, to simplify the code, we directly define a global virtual holding variable to control the logic of buying and selling.
Step 3: Calculate the current over space ratio
depth = exchange.GetDepth()  # 获取深度数据
asks = depth['Asks']  # 获取卖价数组
bids = depth['Bids']  # 获取买价数组
asks_vol = 0  # 所有卖价挂单
bids_vol = 0  # 所有买价挂单
for index, ask in enumerate(asks):  # 遍历卖价数组
    # 线性计算所有卖价挂单
    asks_vol = asks_vol + ask['Amount'] * (20 - index)
for index, bid in enumerate(bids):  # 遍历买价数组
    # 线性计算所有买价挂单
    bids_vol = bids_vol + bid['Amount'] * (20 - index)
bidask_ratio = bids_vol / asks_vol  # 计算多空比率
It is well known that digital currencies are usually 20 grades of depth data, so we can add up the number of multiple heads and blank heads to calculate the ratio of multiple heads to blank heads. When this value is greater than 1, it indicates that more people see more than those who see less, which predicts that the price will rise in the near future; when this value is less than 1, it indicates that those who see more than those who see more, which predicts that the price will fall in the near future.
However, one thing that needs to be distinguished is that when the hanging lists are closer to the displays, it indicates that the willingness to read more or less is stronger, for example, the payment hanging in one row is certainly more willing to see than the payment hanging in 20 rows.
Step 4: Linear calculation of the ratio of polyspaces over time
global vol_ratio_arr, mp  # 引入全局变量
vol_ratio_arr.insert(0, bidask_ratio)  # 把多空比率放到全局变量数组里面
if len(vol_ratio_arr) > 20:  # 如果数组超过指定长度
    vol_ratio_arr.pop()  # 删除最旧的元素
all_ratio = 0  # 临时变量,所有多空挂单比率
all_num = 0  # 临时变量,所有线性乘数
for index, vol_ratio in enumerate(vol_ratio_arr):  # 变量全局变量数组
    num = 20 - index  # 线性乘数
    all_num = all_num + num  # 线性乘数累加
    all_ratio = all_ratio + vol_ratio * num  # 所有多空挂单比率累加
ratio = all_ratio / all_num  # 线性多空挂单比率
Multiple heads can be added to a list by dividing by a blank, but this is only when one Tick data is used. If only one Tick data is used to decide a trade, it may not be a wise choice, because in a market that changes instantly, one Tick data is not convincing.
Step 5: Order the deal
last_ask_price = asks[0]['Price']  # 最新卖一价,用于买入的价格
last_bid_price = bids[0]['Price']  # 最新买一价,用于卖出的价格
if mp == 0 and ratio > buy_threshold:  # 如果当前无持币,并且比率大于指定值
    exchange.Buy(last_ask_price, 0.01)  # 买入
    mp = 1  # 设置虚拟持仓的值
if mp == 1 and ratio < sell_threshold:  # 如果当前持币,并且比率小于指定值
    exchange.Sell(last_bid_price, 0.01)  # 卖出
    mp = 0  # 重置虚拟持仓的值
Since a price needs to be specified at the time of placing the order, we can use the latest sell price directly at the time of purchase; at the time of sale, we can use the latest buy price directly. Finally, at the end of the order transaction, reset the value of the virtual holding.
The End
The above is the linear hanging one-stream strategy code analysis developed based on the data playback function. If you are a trading novice, the data playback function can learn the trade at zero cost, shorten the cognitive time of the trade, real or simulated trading usually takes several years to see the first results, the same effect can be achieved in a few weeks on the data playback function, with the assumption of minimizing the loss of learning the trade without wasting time.
- Quantifying Fundamental Analysis in the Cryptocurrency Market: Let Data Speak for Itself!
- Quantified research on the basics of coin circles - stop believing in all kinds of crazy professors, data is objective!
- The inventor of the Quantitative Data Exploration Module, an essential tool in the field of quantitative trading.
- Mastering Everything - Introduction to FMZ New Version of Trading Terminal (with TRB Arbitrage Source Code)
- Get all the details about the new FMZ trading terminal (with the TRB suite source code)
- FMZ Quant: An Analysis of Common Requirements Design Examples in the Cryptocurrency Market (II)
- How to Exploit Brainless Selling Bots with a High-Frequency Strategy in 80 Lines of Code
- FMZ quantification: common demands on the cryptocurrency market design example analysis (II)
- How to exploit brainless robots for sale with high-frequency strategies of 80 lines of code
- FMZ Quant: An Analysis of Common Requirements Design Examples in the Cryptocurrency Market (I)
- FMZ quantification: common demands of the cryptocurrency market design instance analysis (1)
- Handshake teaches you how to add support for multiple charts to a policy
- Hands-on to teach you how to transplant a Macanese language strategy (progress)
xaifer48Is the playback function off now?
This is just a simple introduction to the process, and there are a lot of details that need to be optimized, and I'm currently reviewing some of the losses, haha