Handshake teaches you how to add support for multiple charts to a policy
Author: The Little Dream, Created: 2019-12-14 10:12:26, Updated: 2023-10-17 21:24:56
Handshake teaches you how to add support for multiple charts to a policy
Especially when writing a trend strategy, sometimes a fog of conditions triggered by various indicators, at this time it is urgent to make the data visually and analytically easy to view. When adding a single chart to the strategy, you can directly use the "Draw Line Library" template chart. However, sometimes more charts are needed, and different K-line cycles, even the indicator to use the Y-coordinate axis separately. This requires the implementation of the chart code separately.
The following is an example that I can use as a reference, and I'll give you a line-by-line commentary on the example code, so that when you finish reading the code, you'll have a new understanding of adding chart support to the given policy.
/*backtest
start: 2019-07-01 00:00:00
end: 2019-08-24 00:00:00
period: 1h
exchanges: [{"eid":"Futures_OKCoin","currency":"BTC_USD"}]
args: [["IsSynthesisDayKL",true]]
*/

var chart0 = {
    __isStock: true,
    // /*
    extension: {
            layout: 'single',
            height: 300,
    },
    // */
    title : { text : '日K线图'},
    xAxis: { type: 'datetime'},
    series : [
        {
            type: 'candlestick',
            name: 'r',
            id: 'r',
            data: []
        }
    ]
}

var chart1 = {
    __isStock: true,
    // /*
    extension: {
            layout: 'single',
            height: 300,
    },
    // */
    title : { text : 'EMA'},
    xAxis: { type: 'datetime'},
    series : [
        {
            type: 'candlestick',
            name: 'r1',
            id: 'r1',
            data: []
        }, {
            type: 'line',
            name: 'chart1_EMA1',
            data: [],
        }, {
            type: 'line',
            name: 'chart1_EMA2',
            data: []
        }
    ]
}

var chart2 = {
    __isStock: true,
    // /*
    extension: {
            layout: 'single',
            height: 300,
    },
    // */
    title : { text : 'MACD'},
    xAxis: { type: 'datetime'},
    yAxis : [
        {
            title: {text: '价格'},
            opposite: false
        }, {
            title:{text: "指标轴"},
            opposite: true,
        }
    ],
    series : [
        {
            type: 'candlestick',
            name: 'r2',
            id: 'r2',
            data: []
        }, {
            type: 'line',
            yAxis: 1,
            name: 'dif',
            data: []
        }, {
            type: 'line',
            yAxis: 1,
            name: 'dea',
            data: []
        }
    ]
}

function CreatePlotter (e, chart) {
    var obj = {}                      // 声明一个空对象,用于以下代码中添加方法,最后返回这个对象,即构造的绘图对象。

    obj.e = e                         // 参数传来的交易所对象引用,赋值给obj对象的一个属性
    obj.params = {}                   // 构造参数
    obj.params.EMA_param1 = 5         // 我们预设一些图表上指标的参数,用于指标计算时使用 ,比如一条EMA指标线参数
    obj.params.EMA_param2 = 20        // 第二条EMA指标线参数,通常参数小的叫块线,参数大的叫慢线
    obj.params.MACD_fast = 12         // MACD 参数
    obj.params.MACD_slow = 26         // MACD 参数
    obj.params.MACD_sig = 9           // MACD 参数

    obj.runTime = {}                  // 用于储存运行时的一些数据
    obj.runTime.arrPreBarTime = [0, 0, 0]    // 储存每个K线数据的前一个bar 的时间戳,用于对比

    obj.GetAllRecords = function () {              // 绘图对象的一个方法,用于获取K线数据,我们这个例子是用了三个图表同时显示,所以,这个函数同时获取三种不同周期的K线数据
        obj.r = _C(obj.e.GetRecords, PERIOD_H1)    // 第一个图表的K线数据,是1小时级别的K线数据
        Sleep(1000)
        obj.r1 = _C(obj.e.GetRecords, PERIOD_M15)  // 第二个图表的K线数据,是15分钟级别的K线数据
        Sleep(1000)
        obj.r2 = _C(obj.e.GetRecords, PERIOD_D1)   // 第三个图表的K线数据,是日K线数据
    }

    obj.Run = function () {                        // 执行绘图对象的功能
        obj.Plot()                                 // 执行具体的绘图代码
    }

    obj.CalcMACD = function (r, fast, slow, sig) {       // MACD 指标计算函数,返回MACD指标数据
        if (r.length <= Math.max(fast, slow, sig)) {
            return false
        }
        return TA.MACD(r, fast, slow, sig)
    }


    obj.Plot = function () {                   // 重点部分,具体的绘图代码。
        obj.GetAllRecords()                    // 每次绘图前,首先更新所有的K线数据
        var arr = [obj.r, obj.r1, obj.r2]      // 把所有K线数据放在一个数组中,遍历。
        var arrKIndex = [0, 1, 4]              // 图表对象中K线数据系列的索引
        for (var i = 0; i < arr.length; i++) { // 遍历操作
            for (var j = 0; j < arr[i].length; j++) {
                if (arr[i][j].Time == obj.runTime.arrPreBarTime[i]) {    // 当K线数据最后一bar没有更新时,我们只更新数据,不添加,可以注意看 chart.add 函数调用时,最后一个参数使用了 -1 ,意思就是更新数据,不添加。
                    chart.add(arrKIndex[i], [arr[i][j].Time, arr[i][j].Open, arr[i][j].High, arr[i][j].Low, arr[i][j].Close], -1)

                   if (i == 1) {    // 更新第二个图表中的 EMA指标数据
                        var nowR = arr[i].slice(0, j + 1)
                        var ema1 = TA.EMA(nowR, obj.params.EMA_param1)
                        var ema2 = TA.EMA(nowR, obj.params.EMA_param2)
                        if (obj.r2.length <= obj.params.EMA_param1 || obj.r2.length <= obj.params.EMA_param2 || isNaN(ema1[j]) || isNaN(ema2[j])) {
                            continue
                        }

                        chart.add(2, [arr[i][j].Time, ema1[ema1.length - 1]], -1)
                        chart.add(3, [arr[i][j].Time, ema2[ema2.length - 1]], -1)
                    } else if (i == 2) {     // 更新第三个图表中的 MACD 指标数据
                        var nowR = arr[i].slice(0, j + 1)
                        var macd = obj.CalcMACD(nowR, obj.params.MACD_fast, obj.params.MACD_slow, obj.params.MACD_sig)
                        if (!macd) {
                            continue
                        }

                        var dif = macd[0]
                        var dea = macd[1]
                        chart.add(5, [arr[i][j].Time, dif[dif.length - 1]], -1)
                        chart.add(6, [arr[i][j].Time, dea[dea.length - 1]], -1)
                    }
                } else if (arr[i][j].Time > obj.runTime.arrPreBarTime[i]) {   // 当前K线数据最后一bar比之前记录的最后bar时间戳大时,说明K线有新的bar生成,这个时候要添加新bar,并且添加新指标数据点。
                    obj.runTime.arrPreBarTime[i] = arr[i][j].Time             // 更新最后一bar时间戳的记录,用于接下来的对比,接下来的时间戳又一样了,就不会导致再添加数据,除非有新bar再产生。
                    chart.add(arrKIndex[i], [arr[i][j].Time, arr[i][j].Open, arr[i][j].High, arr[i][j].Low, arr[i][j].Close])
                    if (i == 1) {
                        var nowR = arr[i].slice(0, j + 1)
                        var ema1 = TA.EMA(nowR, obj.params.EMA_param1)
                        var ema2 = TA.EMA(nowR, obj.params.EMA_param2)
                        if (nowR.length <= obj.params.EMA_param1 || nowR.length <= obj.params.EMA_param2 || isNaN(ema1[ema1.length - 1]) || isNaN(ema2[ema2.length - 1])) {
                            continue
                        }

                        chart.add(2, [arr[i][j].Time, ema1[ema1.length - 1]])
                        chart.add(3, [arr[i][j].Time, ema2[ema2.length - 1]])
                    } else if (i == 2) {
                        var nowR = arr[i].slice(0, j + 1)
                        var macd = obj.CalcMACD(nowR, obj.params.MACD_fast, obj.params.MACD_slow, obj.params.MACD_sig)
                        if (!macd) {
                            continue
                        }

                        var dif = macd[0]
                        var dea = macd[1]
                        chart.add(5, [arr[i][j].Time, dif[dif.length - 1]])
                        chart.add(6, [arr[i][j].Time, dea[dea.length - 1]])
                    }
                }
            }
        }
    }
    obj.Plot()

    return obj
}

function main () {
    var chart = Chart([chart0, chart1, chart2])
    chart.reset()

    exchange.SetContractType("quarter")
    var plotter = CreatePlotter(exchange, chart)
    while (true) {
        plotter.Run()
        Sleep(1000)
    }
}
Let's see first.mainThe function:
function main () {                                  // 策略入口函数,当然本策略什么也不做,没有任何交易,只是画图
    var chart = Chart([chart0, chart1, chart2])     // chart0,chart1,chart2 是预先声明好的图表配置对象,调用Chart函数,就是把图表配置载入,返回一个图表控制对象 chart
    chart.reset()                                   // 调用图表控制对象chart的reset方法,重置图表。

    exchange.SetContractType("quarter")             // 回测配置 选择的是OKEX期货,所以这里要设置一下合约,合约设置为季度(quarter)
    var plotter = CreatePlotter(exchange, chart)    // 调用 CreatePlotter 函数生成绘图对象 plotter
    while (true) {
        plotter.Run()                               // 执行绘图对象 plotter 成员函数 Run 绘图
        Sleep(1000)                                 // 绘图对象 plotter 是负责“如何画”,图表控制对象chart是负责具体画图,这两者中前者是我们代码实现的,后者是系统底层API函数返回的控制对象。
    }
}
We'll see about that later.CreatePlotterHow functions construct graph objects is implemented in graph functions, as can be seen in the code.var plotter = CreatePlotter(exchange, chart)In the middle, when constructing a graph object plotter, the exchange, chart, is passed. The former is used to obtain K-line data (by calling exchange.GetRecords), while the latter is used to manipulate the graph and add data to the graph.
The main part of the drawing isPlotFunctions, annotations are already written in the code.
Re-testing is running: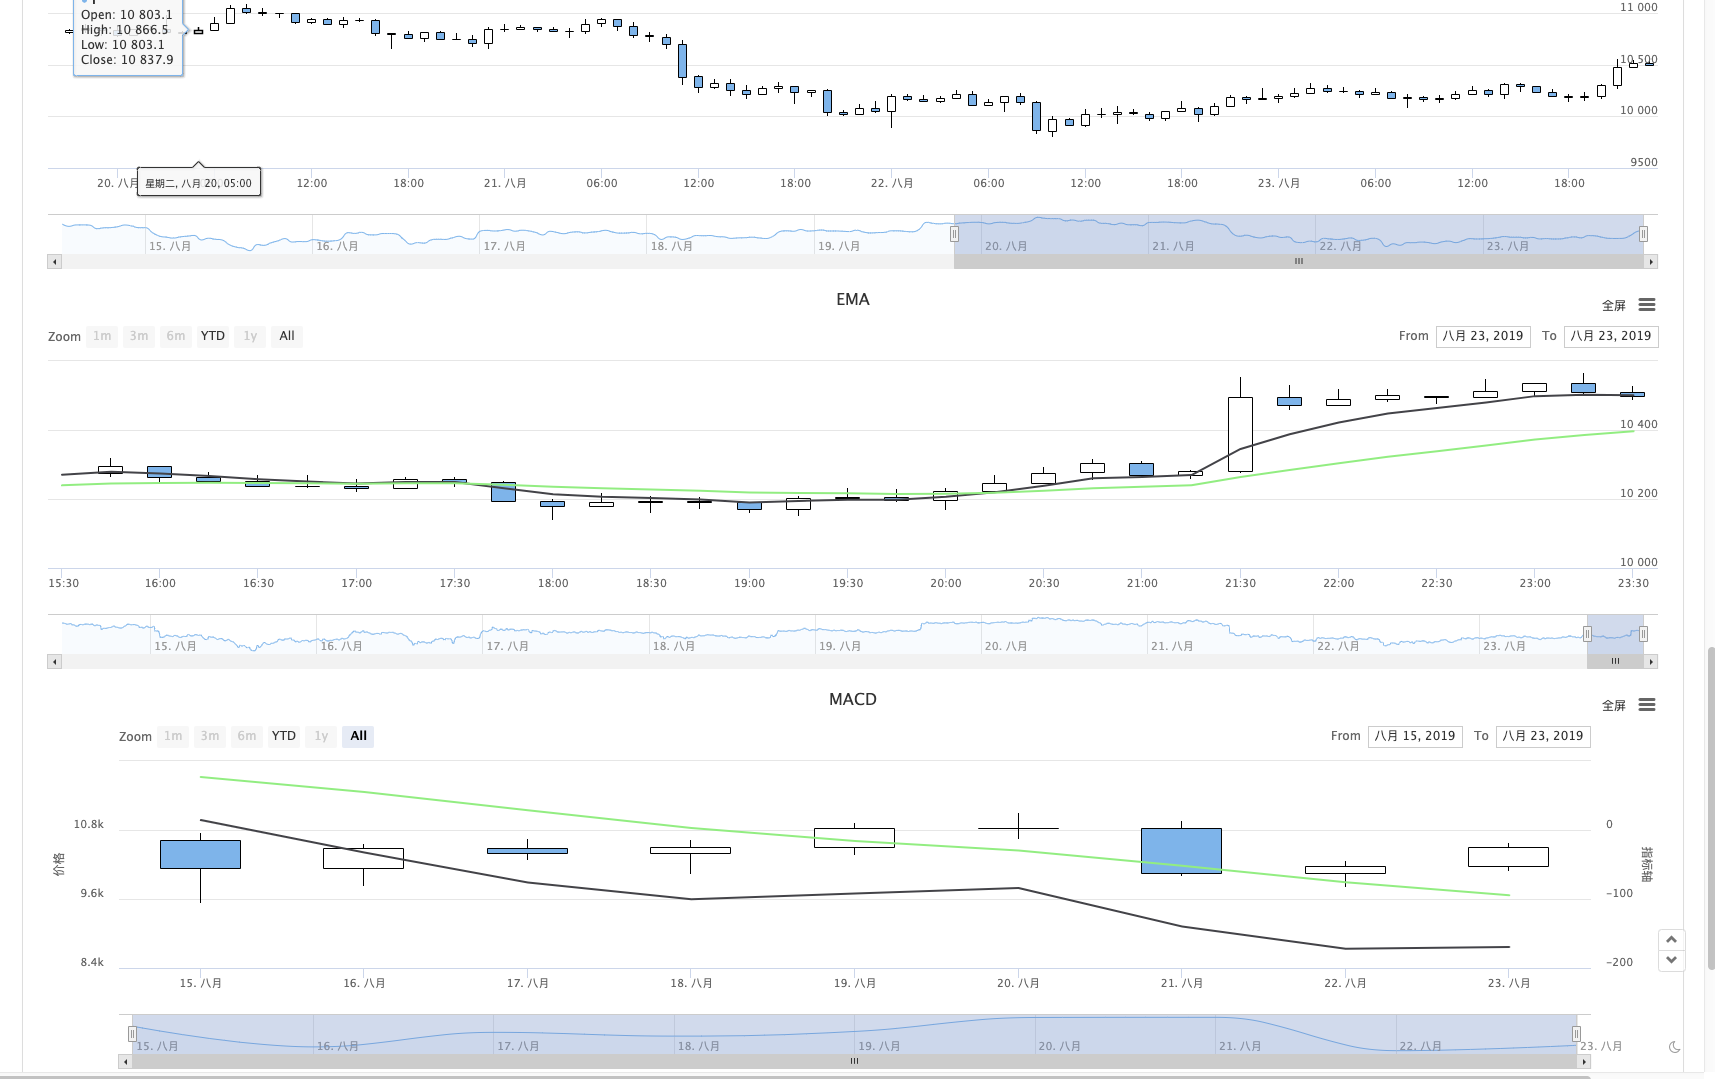
This allows the strategy to display multiple charts.
- Quantifying Fundamental Analysis in the Cryptocurrency Market: Let Data Speak for Itself!
- Quantified research on the basics of coin circles - stop believing in all kinds of crazy professors, data is objective!
- The inventor of the Quantitative Data Exploration Module, an essential tool in the field of quantitative trading.
- Mastering Everything - Introduction to FMZ New Version of Trading Terminal (with TRB Arbitrage Source Code)
- Get all the details about the new FMZ trading terminal (with the TRB suite source code)
- FMZ Quant: An Analysis of Common Requirements Design Examples in the Cryptocurrency Market (II)
- How to Exploit Brainless Selling Bots with a High-Frequency Strategy in 80 Lines of Code
- FMZ quantification: common demands on the cryptocurrency market design example analysis (II)
- How to exploit brainless robots for sale with high-frequency strategies of 80 lines of code
- FMZ Quant: An Analysis of Common Requirements Design Examples in the Cryptocurrency Market (I)
- FMZ quantification: common demands of the cryptocurrency market design instance analysis (1)
- Handshake teaches you how to write a K-line syntax in Python
- Linear hang single-stream strategy based on data playback feature development
MAIKEOThank you for your guidance and sharing!!!