Larry Connors Larry Connors RSI2 mean return strategy
Author: homily, Created: 2020-05-13 16:14:29, Updated: 2023-10-08 19:50:34
Derived from
My good friend Jago asked me several times last year if I could write a daily strategy. Many friends have also asked me to write a grid, to do marketing strategies. But I usually say no. You have to have a strong mathematical background and at least a PhD in mathematics to be able to do these things. In addition, a high frequency ratio is more of a financial factor, such as the amount of funding and the speed of the broadband network. Most importantly, these contradict my understanding of the transaction.
I'm not sure if there are other ways to do high-frequency trading, of course there are. Today we're going to introduce you to the RSI mean return strategy developed by Larry Connors.
I'm going to introduce myself.
The RSI2 strategy is a fairly simple mean return trading strategy developed by Larry Connors. The price of the product is also lower than the price of the product. When the RSI2 drops below 10, it is considered oversold and traders should look for buying opportunities. When the RSI2 breaks above 90, it is considered overbought and traders should look for opportunities to sell. This is a fairly radical short-term strategy designed to engage in a sustained trend; it is not designed to identify major tops or bottoms.
The Strategy
This strategy has four steps. 1, the use of long-term moving averages to determine the main trends; Connors suggests a 200-day moving average. The long-term trend rises above the 200-day moving average and declines below it. Traders should look for opportunities to buy above the 200-day midline and to sell below the 200-day midline.
2, Choose the RSI range to determine the opportunity to buy or sell. The RSI level tested by Connors is bought between 0 and 10, and sold between 90 and 100. He found that when the RSI drops below 5, the buy-in yield is higher than when it drops below 10. The lower the RSI, the higher the yield on subsequent multi-head positions. Correspondingly, short selling gains when the RSI is above 95 are higher than gains when the RSI is above 90.
3, involves the actual purchase or short sale order and its time of arrival. Connors advocates the use of the "close-close" approach. Waiting for closing gives traders more flexibility and can improve entry levels.
4, set the exit position.
Where should I put the stop? Connors does not advocate stop loss. In a quantitative test of hundreds of thousands of transactions, Connors found that the performance of using stops actually damaged performance.
However, in the example, Connors suggests stopping a multi-head position above the 5-day average and stopping a blank position below the 5-day average. Obviously, this is a short-term trading strategy and a quick exit. Or consider setting up a tracking stop loss or using a SAR synthetic stop loss strategy. Sometimes the market does indeed have a phenomenon of upward drift, and failure to use stop loss can lead to excess losses and large losses. This requires the user to consider and decide for himself.
Verification of transactions Trading examples
The chart below shows the Dow Jones Industrial Average SPDR (DIA) as well as the 200-day SMA (red), 5-cycle SMA (pink) and 2-cycle RSI.
When the DIA is above the 200-day SMA and the RSI (2) falls to 5 or lower, a bullish signal is shown.
When the DIA is below the 200-day SMA and the RSI (2) rises to 95 or higher, a bearish signal is seen.
In the last 12 months, there have been 7 signals, 4 bulls and 3 losses.
Of the four bullish signals, the DIA was up three out of four times, meaning that the signals could be profitable.
In the four bearish signals, the DIA fell only once.
After a bearish sign in October, the DIA broke the 200-day average.
Once above the 200-day average, the RSI2 does not drop to 5 or lower to generate another buy signal.
As for the loss, it will depend on the level of stop loss and profit.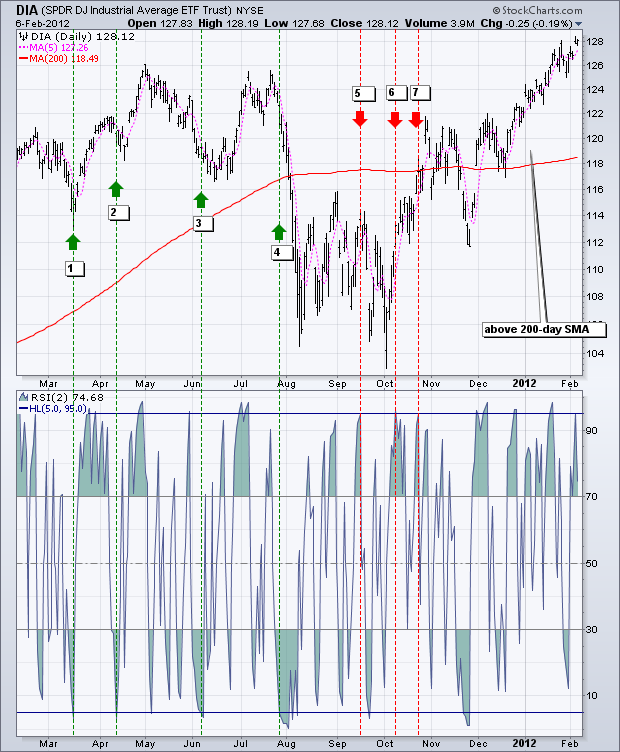
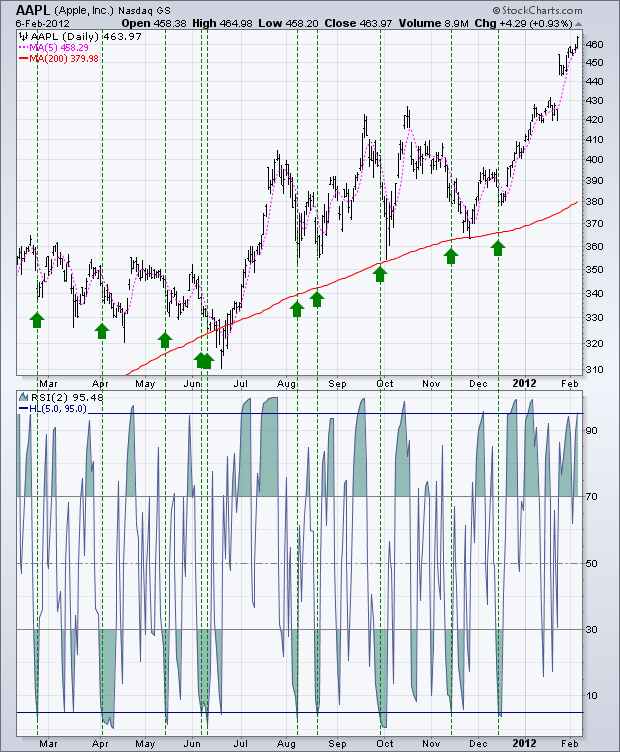
The second example shows Apple (APL), which has been above the 200-day average for most of the time. In the meantime, at least ten buy signals have been received. As the APL has been slumping from late February to mid-June 2011, it is difficult to avoid losing the top five indicators. The last five signals performed much better as the APL rose from August to January. As you can see from this graph, many of the signals are early. In other words, Apple fell to a new low after an initial buy signal, then rebounded.
Conclusion
The RSI2 strategy provides traders with an opportunity to participate in the ongoing trend. Connors pointed out that traders should buy a pullback, not a breakthrough. Instead, traders should sell the oversold rebound, not support the breakout. This strategy is in line with his philosophy. Even if the Connors test shows that stop losses affect performance, it is prudent for traders to develop exit and stop loss strategies for any trading system. When the situation becomes overbought or a stop loss is set, the trader can exit the multi-head. Similarly, when conditions oversell, traders can exit empty-handed. Use these ideas to enhance your trading style, risk-return preferences, and personal judgment.
FMZ source code is shown
Connors' strategy is simple: he writes in Macanese language only. Since the original strategy was designed for US stocks, the 200-day average line was used as a reference. In the field of more volatile digital currencies, it just so happens to be a short-cycle value return. So we adjusted the time range to 15 minutes, and ma cycles take 70. This is the first time that a transaction has been re-tested with a leverage of 1x.
(*backtest
start: 2019-01-01 00:00:00
end: 2020-05-12 00:00:00
period: 15m
basePeriod: 5m
exchanges: [{"eid":"Futures_OKCoin","currency":"BTC_USD"}]
args: [["TradeAmount",5000,126961],["MaxAmountOnce",5000,126961],["ContractType","quarter",126961]]
*)

liang:=INTPART(1*MONEYTOT*REF(C,1)/100);
//使用一倍杠杆
LC := REF(CLOSE,1);
RSI2: SMA(MAX(CLOSE-LC,0),2,1)/SMA(ABS(CLOSE-LC),2,1)*100;
//RSI2值
ma1:=MA(CLOSE,70);
//MA值

CLOSE>ma1 AND RSI2>90,SK(liang);
CLOSE>ma1 AND RSI2<10,BP(SKVOL);
//大于均线的情况下,rsi>90 开空,rsi<10 平空


CLOSE<ma1 AND RSI2<10,BK(liang);
CLOSE<ma1 AND RSI2>90,SP(BKVOL);
//小于均线的情况下,rsi<10 开多,rsi>90 平多

AUTOFILTER;
The following is a copy of the policy: https://www.fmz.com/strategy/207157
Repeated effects
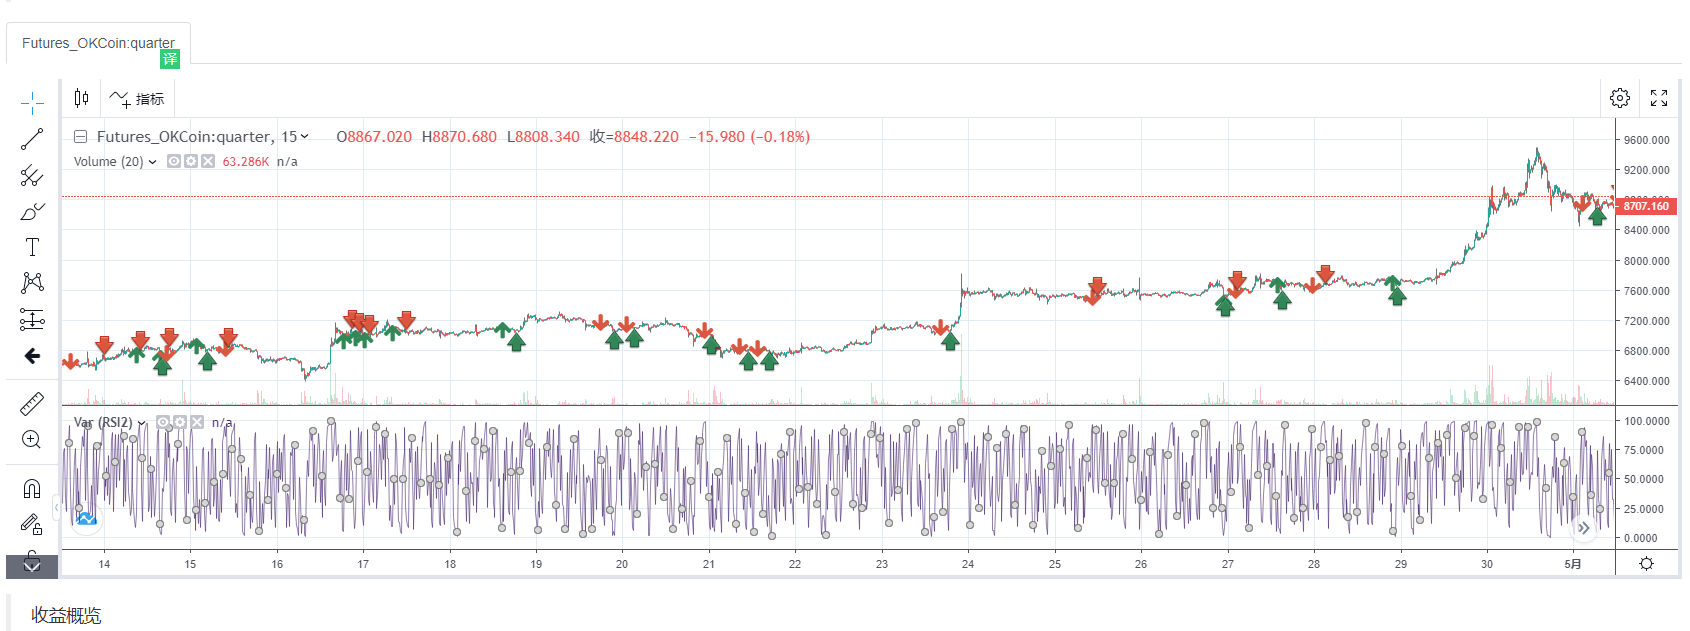
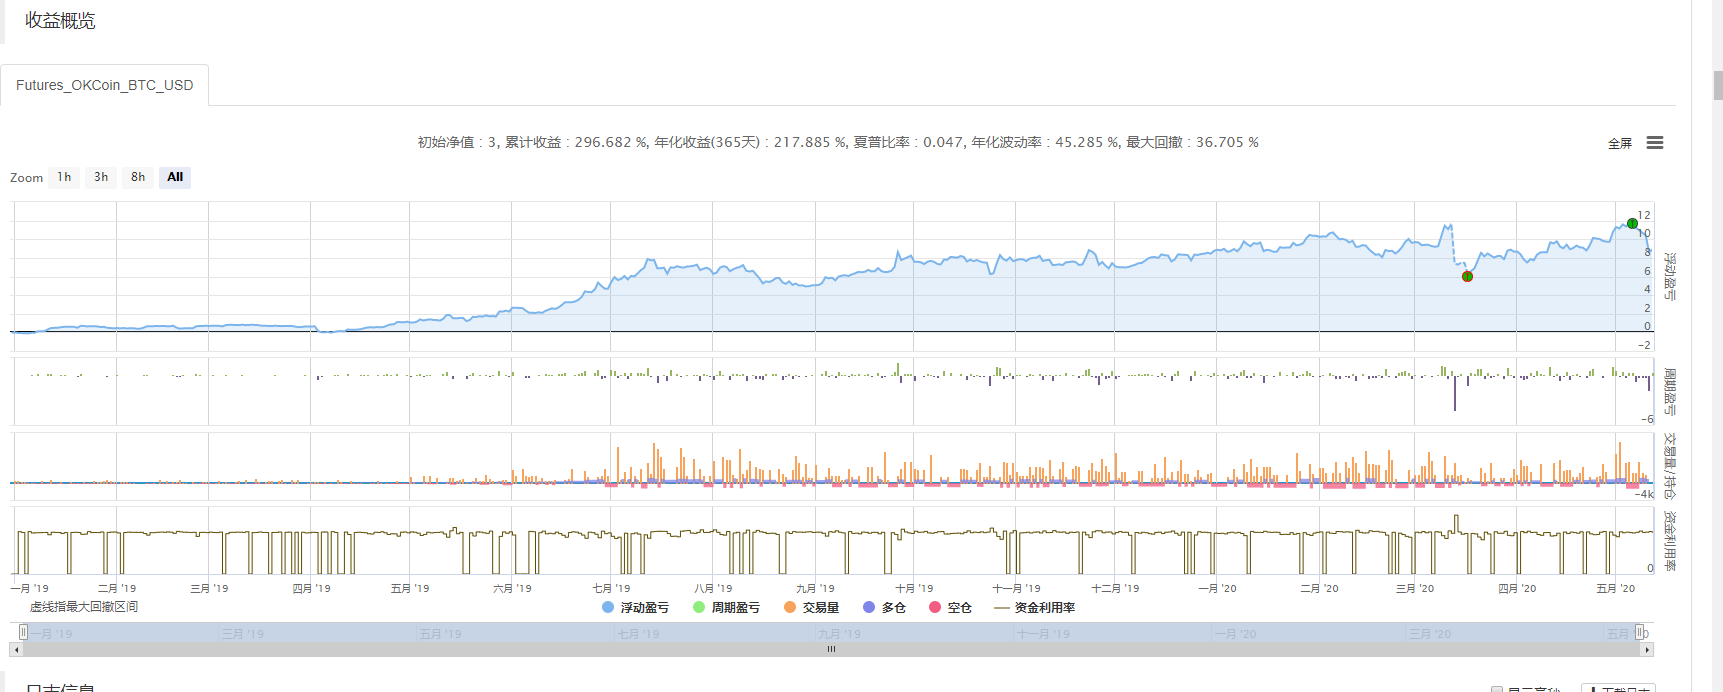 After systematic re-testing, we found that the rsi strategy had a higher overall winning rate.
The biggest pullback occurred in 312, and extreme markets would be more damaging to a strategy of shock reversal.
After systematic re-testing, we found that the rsi strategy had a higher overall winning rate.
The biggest pullback occurred in 312, and extreme markets would be more damaging to a strategy of shock reversal.
Adjusting and thinking about tweaking
After the RSI 2 rises above 95, the market can continue to rise; After the RSI2 drops below 5, the market can continue to fall. In order to correct this, we may have to engage in OHLCV analysis, daily chart formats, other dynamic indicators, etc.
After the RSI2 rises above 95, the market can continue to rise, and it is dangerous to build a short position. Traders can consider filtering this signal by waiting for the RSI2 to return below the heartline of 50.
References
https://school.stockcharts.com https://www.tradingview.com/ideas/connorsrsi/ https://www.mql5.com/zh/code/22421
- Quantifying Fundamental Analysis in the Cryptocurrency Market: Let Data Speak for Itself!
- Quantified research on the basics of coin circles - stop believing in all kinds of crazy professors, data is objective!
- The inventor of the Quantitative Data Exploration Module, an essential tool in the field of quantitative trading.
- Mastering Everything - Introduction to FMZ New Version of Trading Terminal (with TRB Arbitrage Source Code)
- Get all the details about the new FMZ trading terminal (with the TRB suite source code)
- FMZ Quant: An Analysis of Common Requirements Design Examples in the Cryptocurrency Market (II)
- How to Exploit Brainless Selling Bots with a High-Frequency Strategy in 80 Lines of Code
- FMZ quantification: common demands on the cryptocurrency market design example analysis (II)
- How to exploit brainless robots for sale with high-frequency strategies of 80 lines of code
- FMZ Quant: An Analysis of Common Requirements Design Examples in the Cryptocurrency Market (I)
- FMZ quantification: common demands of the cryptocurrency market design instance analysis (1)