Defects in high-frequency echo systems based on pen-to-pen transaction and K-line echoes
Author: The grass, Created: 2020-06-04 16:48:02, Updated: 2023-10-08 19:46:18
I'm in theBinance is a hedging strategy for overvaluation and overvaluationA retesting engine was released at the same time; and the first report based on one-hour K-line retesting verified the effectiveness of the strategy. However, the actual public strategy of sleep time of 1s, a fairly high-frequency strategy, was not able to produce accurate results with hourly K-line retesting.Minutes line retrospectionAs a result, retesting gains are greatly improved, but it is still impossible to determine which parameters should be used in the secondary situation, and the understanding of the overall strategy is not very clear. The main reason is the important disadvantage of retesting based on the K line.
Problems based on K-line regression
First of all, what is a historical K-line? A K-line data contains four prices, two start times, and interval transactions. Most quantification platforms and frameworks are based on K-line retesting, and FMZ quantification platforms also provide tick-level retesting.
First of all, the problem of time, the time of the highest and lowest price of the K-line data is not given, not to be considered, but the most important opening and closing price is not the opening and closing time. Even the less cool trading varieties are often not traded for ten seconds, and when we retest multi-variety strategies, we often default to their opening and closing prices at the same time, which is also the basis for retesting.
Imagine using a minute line to trace the spread of two varieties, which are usually priced at $10 each, and now find at 10:01 a contract closes at $100, a contract closes at $112, and the spread is $12, so the strategy starts hedging, and at some point the spread returns, and the strategy earns a $2 return profit.
The actual situation may be that at 10:00:45, A contract generates a $100 transaction, after which there is no transaction, B contract at 10:00:58 generates a $112 transaction, at this moment at 10:01, both prices do not exist, what is the spot price at this time, how much spread can the hedge eat?
Then there is the shooting problem, where the real shooting is price first, time first. If the buyer exceeds the selling price, they generally deal directly with the selling price, instead of going into the order book waiting. The K-line data is obviously not a buy-sell-price, it is a shooting that cannot simulate the level of detail.
Finally, the strategy itself is the effect of the transaction on the market, if it is a small amount of money, the impact is not great. But if the proportion of transactions is large, it will have a shock to the market. Not only is the immediate transaction the price slippage point will be large, if the reverse of your order is completed, it actually seizes the transaction of other traders who were originally going to buy, the butterfly effect will have an impact on the market.
Real-time depth and tick-based retesting
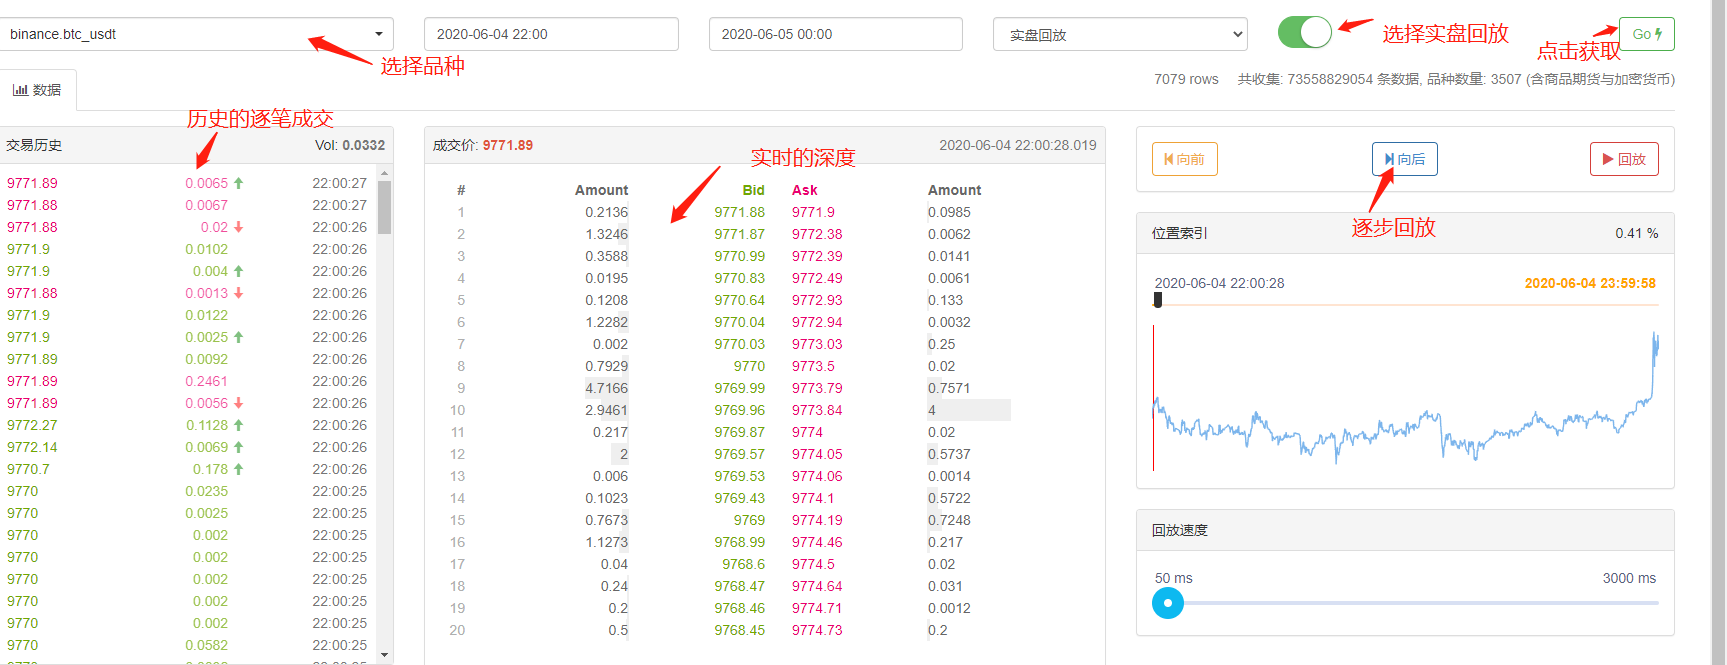
FMZ provides real-time disk retracement, which allows for real-time historical 20 frame depth, real-time tick-seconds, transaction-by-penny data, and so on.Playback of discsSuch retrospective data is extremely large and slow, and generally only takes two days to retrieve. For relatively high frequency or time-critical strategies, real-disc retrospective is necessary. FMZ collects transaction pairs and time is not long, but there are also more than 70 billion historical data. The current capture mechanism is that if a bid is larger than a sale, it will not be immediately fully captured, and less than a sale enters the queue.
Mechanism of retrospection based on order flow by transaction
There is very little information on the K-line, and the depth can also be false depth, but there is a data that is the real willingness of the market to trade, which reflects the most real trading history. This article will propose a high-frequency retesting system based on order flow, which will greatly reduce the amount of data retested at the real level, and to some extent the impact of analogue trading on the market.
I downloaded the most recent one-to-one transaction on the XTZ 5T permanent contract (download address:https://www.fmz.com/upload/asset/1ff487b007e1a848ead.csvThe data is based on a total of 213,000 data points, which is not a very popular variety.
[['XTZ', 1590981301905, 2.905, 0.4, 'False\n'],
 ['XTZ', 1590981303044, 2.903, 3.6, 'True\n'],
 ['XTZ', 1590981303309, 2.903, 3.7, 'True\n'],
 ['XTZ', 1590981303738, 2.903, 238.1, 'True\n'],
 ['XTZ', 1590981303892, 2.904, 0.1, 'False\n'],
 ['XTZ', 1590981305250, 2.904, 0.1, 'False\n'],
 ['XTZ', 1590981305643, 2.903, 197.3, 'True\n'],
The data is a two-dimensional list, ordered by transaction time. The specific meaning is: variety name, transaction price, transaction time frame, number of transactions, whether the order was actively executed. There is a buy or sell, each transaction includes a buyer and a seller.
First of all, according to the direction of the transaction, it is possible to fairly accurately guess the buy and sell price in the market, if it is an active sell order, then the buy and sell price at this time is the transaction price, if the active buy and sell order, then the sell price is the transaction price, if there is a new transaction, the new discount is updated, the unupdated results are retained.
Depending on the order flow, it can be captured as follows: for example, a purchase price is price, the amount ordered is amount, at this time the buy and sell order is bid, ask. If the price is lower than the ask price is higher than the bid, then the maker is judged first, and the transaction can be pre-filmed, then all transactions with a price less than or equal to the price of the order must be captured with this order in the time available to the order. If the price is lower than or equal to the bid, the transaction cannot be pre-filmed, the transaction price is lower than the price of the order is captured with this order, the shot is price, the transaction amount is successive transactions until the order is fully traded or withdrawn.
It is easy to see a problem with this kind of shooting, if the order is the taker, the actual situation is to be able to transact immediately, rather than waiting for new orders to be taken. First of all, we do not take into account the number of orders on the list, even if there are data, and directly judge the transaction changes in depth, affecting the market. And the shooting based on new orders, which is equivalent to replacing the real order in history with your order, in any case will not exceed the limit of the transaction in the market itself, and the final profit cannot exceed the maximum profit generated by the sentiment.
There are also some small details, if the order buy price is equal to buy one, there is actually still a certain probability to buy one price is taken, need to consider the priority of the listing and the probability of transaction, etc., which is more complex, not considered here.
Shot the code
Exchange objects can refer to the introduction at the beginning, basically unchanged, only adding the difference between maker and taker fees, and optimizing the speed of retesting.
    symbol = 'XTZ'
    loop_time = 0
    intervel = 1000 #策略的休眠时间为1000ms
    init_price = data[0][2] #初始价格
    e = Exchange([symbol],initial_balance=1000000,maker_fee=maker_fee,taker_fee=taker_fee,log='') #初始化交易所
    depth = {'ask':data[0][2], 'bid':data[0][2]} #深度
    order = {'buy':{'price':0,'amount':0,'maker':False,'priority':False,'id':0},
             'sell':{'price':0,'amount':0,'maker':False,'priority':False,'id':0}} #订单
    for tick in data:
        price = int(tick[2]/tick_sizes[symbol])*tick_sizes[symbol] #成交价格
        trade_amount = tick[3] #成交数量
        time_stamp = tick[1] #成交时间戳
        if tick[4] == 'False\n':
            depth['ask'] = price
        else:
            depth['bid'] = price

        if depth['bid'] < order['buy']['price']:
            order['buy']['priority'] = True
        if depth['ask'] > order['sell']['price']:
            order['sell']['priority'] = True
        if price > order['buy']['price']:
            order['buy']['maker'] = True
        if price < order['sell']['price']:
            order['sell']['maker'] = True

        #订单网络延时也可以作为撮合条件之一,这里没考虑
        cond1 = order['buy']['priority'] and order['buy']['price'] >= price and order['buy']['amount'] > 0
        cond2 = not order['buy']['priority'] and order['buy']['price'] > price and order['buy']['amount'] > 0
        cond3 = order['sell']['priority'] and order['sell']['price'] <= price and order['sell']['amount'] > 0
        cond4 = not order['sell']['priority'] and order['sell']['price'] < price and order['sell']['amount'] > 0

        if cond1 or cond2:
            buy_price = order['buy']['price'] if order['buy']['maker'] else price
            e.Buy(symbol, buy_price, min(order['buy']['amount'],trade_amount), order['buy']['id'], order['buy']['maker'])
            order['buy']['amount'] -= min(order['buy']['amount'],trade_amount)
            e.Update(time_stamp,[symbol],{symbol:price})
        if cond3 or cond4:
            sell_price = order['sell']['price'] if order['sell']['maker'] else price
            e.Sell(symbol, sell_price, min(order['sell']['amount'],trade_amount), order['sell']['id'], order['sell']['maker'])
            order['sell']['amount'] -= min(order['sell']['amount'],trade_amount)
            e.Update(time_stamp,[symbol],{symbol:price})

        if time_stamp - loop_time > intervel:
            order = get_order(e,depth,order) #交易逻辑,这里未给出
            loop_time += int((time_stamp - loop_time)/intervel)*intervel
A few details to note:
- 1.当有新成交时,要先去撮合订单,再去根据最新的价格去下单。
- 2.每个订单都有两个属性:maker——是否为maker,priority——撮合优先级,以买单为例,当买价小于卖一,标记为maker,当买价大于买一是标记为优先撮合,priority决定了价格等于买价是是否撮合,maker决定了手续费。
- 3.订单的maker和priority是更新的,如下了一笔很大的超过盘口的买单,当出现一个价格大于买价时,此时剩余的成交量将是maker。
- 4.策略的intervel是必须的,它可以代表行情的延时。
Retesting the grid strategy
Finally, at the actual retest stage, we're going to review one of the most classic grid strategies here to see if it's achieving the expected effect. The strategy is that for every 1% price increase, we hold a blank list of a certain value (instead of holding multiple orders), calculate the sales order and hang it up in advance.Grid('XTZ',100,0.3,1000,maker_fee=-0.00002,taker_fee=0.0003)In the function, the parameters are: trade pair, price deviation of 1% of the holding value, hanging order density 0.3%, sleep interval ms, hanging order fee, eating order fee.
The XTZ market has been in a turbulent phase for the past five days, which is good for the grid.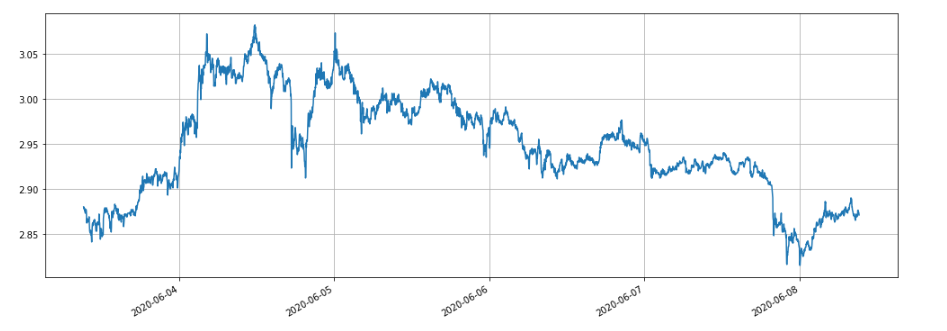
We first retest the impact of different holdings on earnings, and the traditional retesting mechanism is sure to increase the returns as the holdings increase.
e1 = Grid('XTZ',100,0.3,1000,maker_fee=-0.00002,taker_fee=0.0003)
print(e1.account['USDT'])
e2 = Grid('XTZ',1000,0.3,1000,maker_fee=-0.00002,taker_fee=0.0003)
print(e2.account['USDT'])
e3 = Grid('XTZ',10000,0.3,1000,maker_fee=-0.00002,taker_fee=0.0003)
print(e3.account['USDT'])
e4 = Grid('XTZ',100000,0.3,1000,maker_fee=-0.00002,taker_fee=0.0003)
print(e4.account['USDT'])
Four sets were retested, holding values of 100, 1000, 10000, 100000, respectively. The total retest time was 1.3s. The results were as follows:
{'realised_profit': 28.470993031132966, 'margin': 0.7982662957624465, 'unrealised_profit': 0.0104554474048441, 'total': 10000028.481448, 'leverage': 0.0, 'fee': -0.3430967859046398, 'maker_fee': -0.36980249726699727, 'taker_fee': 0.026705711362357405}
{'realised_profit': 275.63148945320177, 'margin': 14.346335829979132, 'unrealised_profit': 4.4382117331794045e-14, 'total': 10000275.631489, 'leverage': 0.0, 'fee': -3.3102045933457784, 'maker_fee': -3.5800688964477048, 'taker_fee': 0.2698643031019274}
{'realised_profit': 2693.8701498889504, 'margin': 67.70120400534114, 'unrealised_profit': 0.5735269329348516, 'total': 10002694.443677, 'leverage': 0.0001, 'fee': -33.984021415250744, 'maker_fee': -34.879233866850974, 'taker_fee': 0.8952124516001403}
{'realised_profit': 22610.231198585603, 'margin': 983.3853688758861, 'unrealised_profit': -20.529965947304365, 'total': 10022589.701233, 'leverage': 0.002, 'fee': -200.87094000385412, 'maker_fee': -261.5849078470078, 'taker_fee': 60.71396784315319}
It can be seen that the final realized profit is 28.4%, 27.5%, 26.9%, 22.6% of the holding value respectively. This is also in line with the actual situation, the greater the value of the holding, the greater the value of the listing, the more likely it is that there will be a partial transaction, and the final realized income is also smaller relative to the number of listings.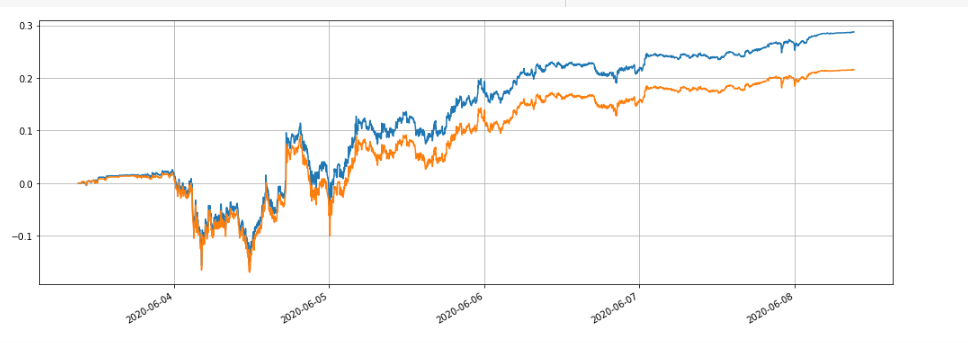
We can also retest the effect of different parameters on retest gain, such as hanging density, sleep time, procedure fees, etc. For example, change the sleep time to 100 ms, versus the sleep time to 1000 ms to see the gain. The retest results are as follows:
{'realised_profit': 29.079440803790423, 'margin': 0.7982662957624695, 'unrealised_profit': 0.0104554474048441, 'total': 10000029.089896, 'leverage': 0.0, 'fee': -0.3703702128662524, 'maker_fee': -0.37938946377435134, 'taker_fee': 0.009019250908098965}
Increases in earnings are somewhat due to the strategy of hanging only one set of orders, and there will be some orders that will not be able to eat the fluctuating prices due to the lack of change, reducing the sleep time improves this problem. This also illustrates the importance of the network strategy of hanging multiple sets of orders.
Summary
The present innovation proposes a new order flow-based feedback system that partially simulates the shooting of pending orders, orders, transactions, delays, etc. It partially reflects the impact of the amount of strategic capital on earnings, has important reference values for high-frequency strategies and hedging strategies, high-precision feedback points the way for optimizing strategic parameters. It has also been validated in practice for a long time.
- Quantifying Fundamental Analysis in the Cryptocurrency Market: Let Data Speak for Itself!
- Quantified research on the basics of coin circles - stop believing in all kinds of crazy professors, data is objective!
- The inventor of the Quantitative Data Exploration Module, an essential tool in the field of quantitative trading.
- Mastering Everything - Introduction to FMZ New Version of Trading Terminal (with TRB Arbitrage Source Code)
- Get all the details about the new FMZ trading terminal (with the TRB suite source code)
- FMZ Quant: An Analysis of Common Requirements Design Examples in the Cryptocurrency Market (II)
- How to Exploit Brainless Selling Bots with a High-Frequency Strategy in 80 Lines of Code
- FMZ quantification: common demands on the cryptocurrency market design example analysis (II)
- How to exploit brainless robots for sale with high-frequency strategies of 80 lines of code
- FMZ Quant: An Analysis of Common Requirements Design Examples in the Cryptocurrency Market (I)
- FMZ quantification: common demands of the cryptocurrency market design instance analysis (1)
- Teach you to upgrade the market collector backtest the custom data source
- FMZ simulation level backtest mechanism explanation
ebllyThe strategic principle is 1% for every price increase. How long before it goes up by 1%?
ebllyThe strategic principle is 1% for every price increase. I'm not going to lie. How long before it goes up by 1%?
homilyThe index is all in GB.
dsaidasiHow much data is this, and is the website accepted?
The grass /upload/asset/1ff487b007e1a848ead.csv
The grassIt's a good way to do this, but it's too much data to do it in depth.
The grassIt's a lot smaller than the real-time re-measurement, based on the volume of transactions, 1M-20M per day.