FMZ quantified My language - interface diagram
Author: The Little Dream, Created: 2020-06-22 09:44:17, Updated: 2023-10-08 19:49:15
In the last article we studied together the parameters of the "Macy language trading library" template, which was included with the creation of the Macy language policy and encapsulates some of the functions that need to be set up in transactions. In this article we continue to learn about the use of Macy language in inventors' quantitative trading platforms.
Parameters of the Ma language strategy
The policy parameters of the Ma language are set in the policy edit page, as in other languages on the inventor's quantitative trading platform, for example in the Ma language version.Dual ThrustThe following is a list of some of the strategies.
The policy address:https://www.fmz.com/strategy/128884 。
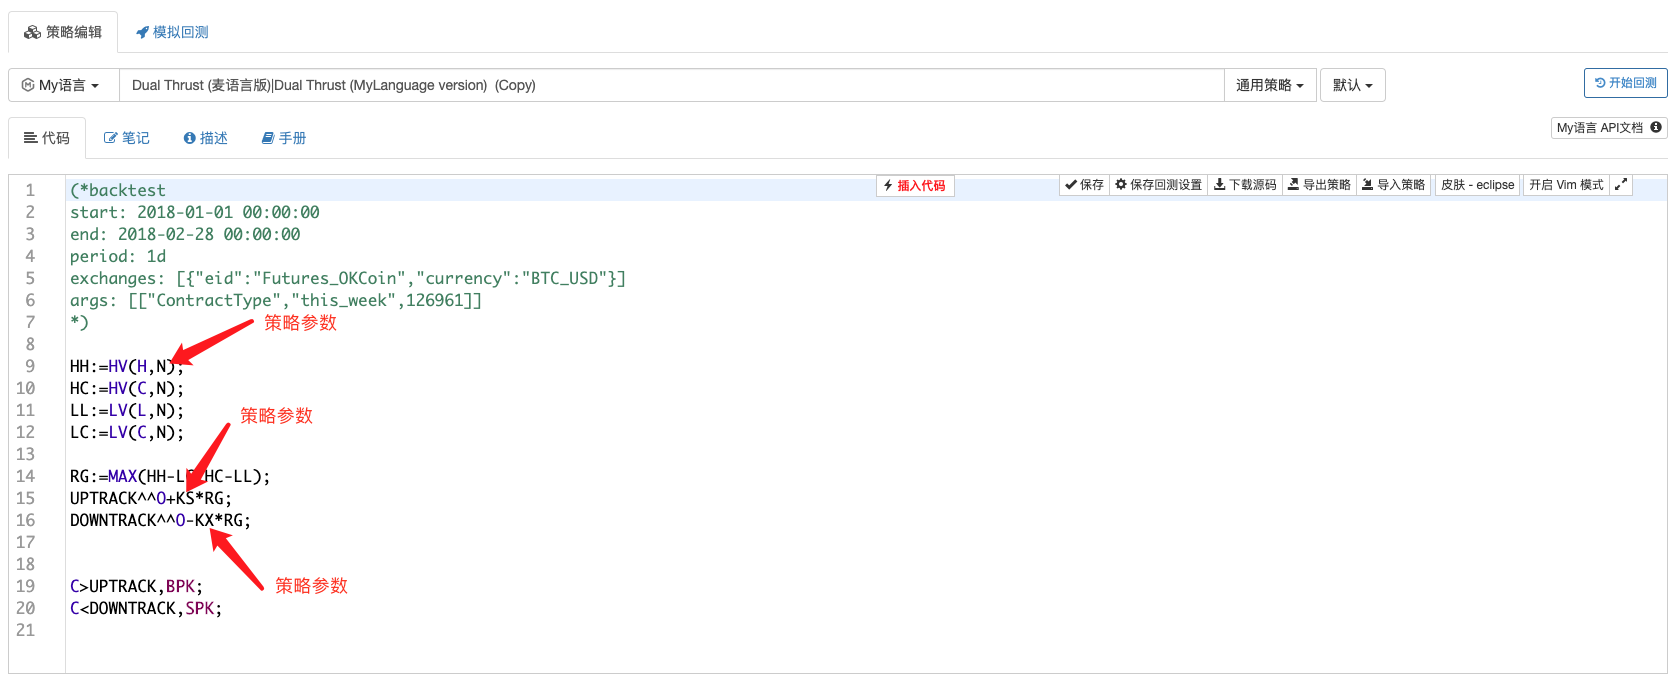
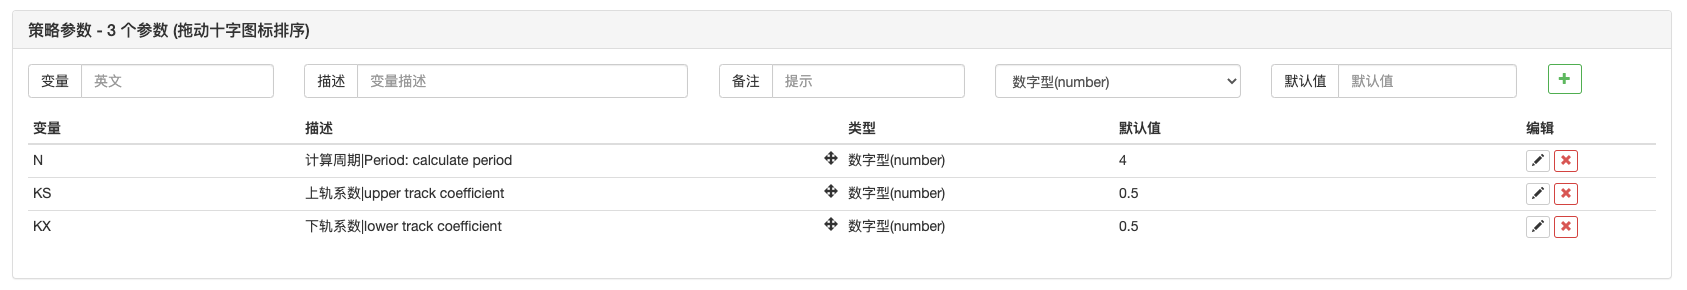
In the policy edit page, the parameters set to the policy can be used directly in the policy code. The policy parameters in the Mac language are generally numeric only, other types such as bull type, drop box, string etc. are not commonly used.
For example, in the previous example,NThis parameter, the default value of which is 4, is set to 4 when the bot is run, if the parameter is not modified when the bot is created.
Real-time and retesting
We already know about the content of the Macan language policy level (Macan language policy parameters, Macan language transaction library template parameters).
Reassessment
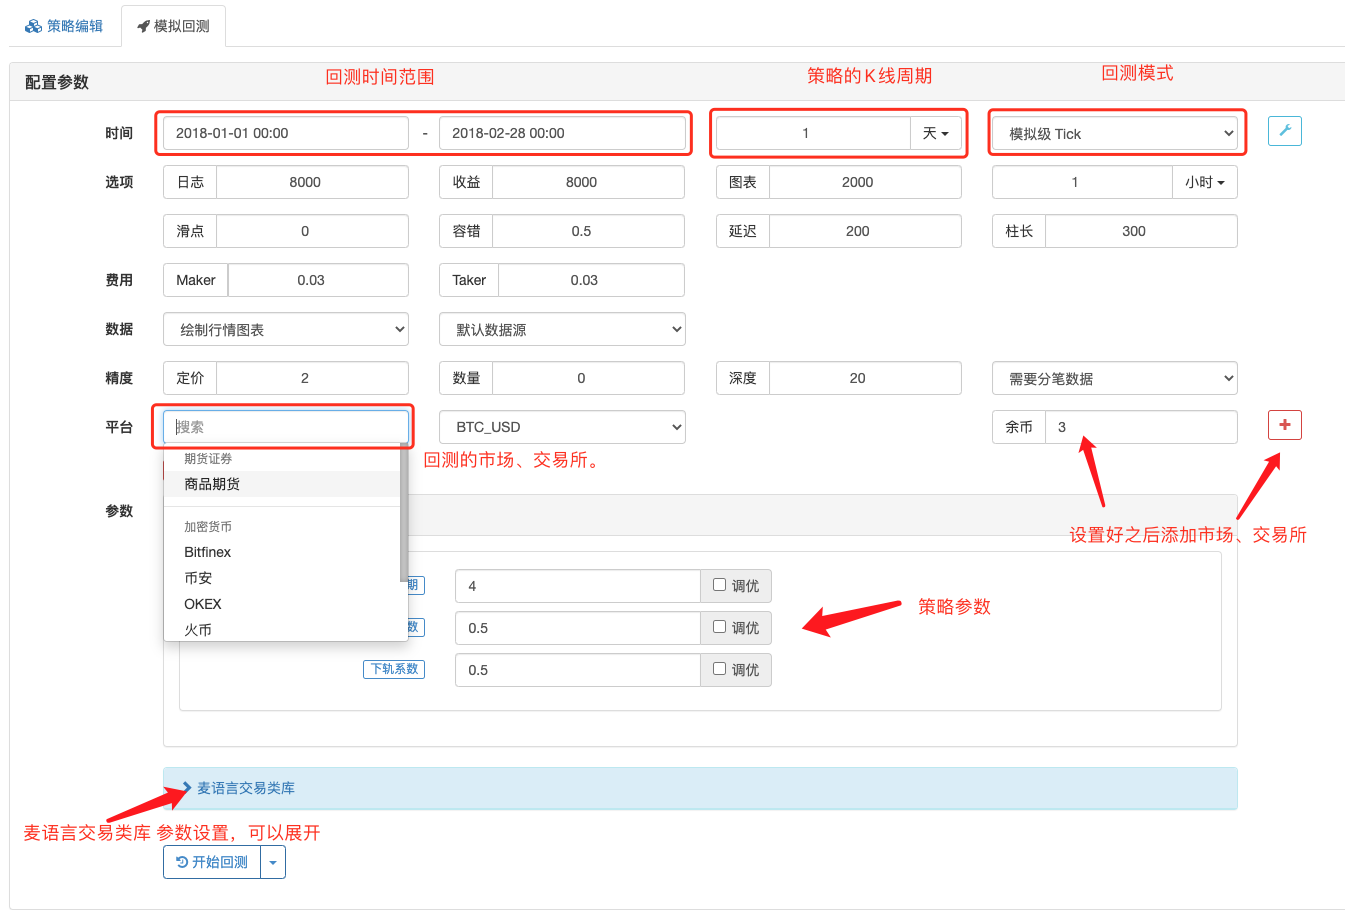
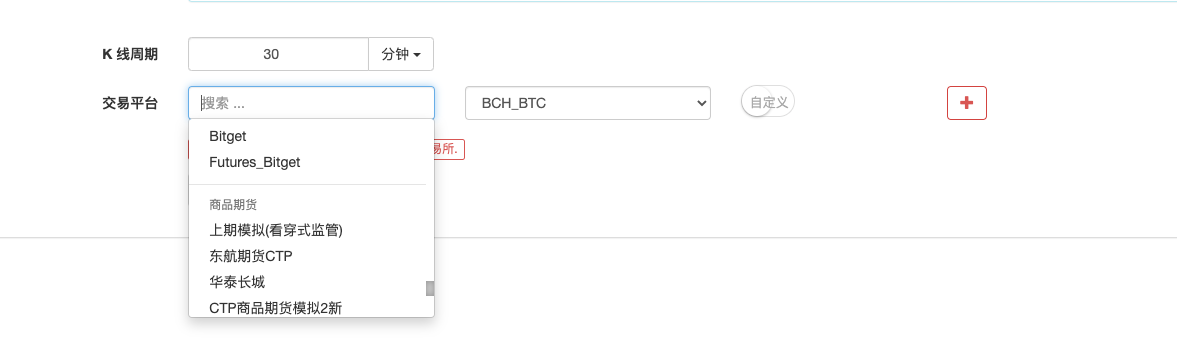
After selecting the retrieval time range (start time, end time), set the policy's K-line cycle, Mac language also supports more K-line cycle data in the policy. However, here the K-line cycle is set to the default K-line cycle, here it is set to the day K-line, then the chart automatically generated after the policy is run is the day K-line.https://www.fmz.com/digest-topic/4009Then select the market or exchange to be retested, add it and retest it, and adjust other parameters if necessary, such as the initial retest amount, etc. You can set specifically according to your needs, with the mouse on the parameter with a hint.
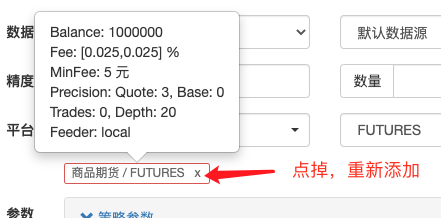
Parameters related to the parameters of the market, exchange, such as: retesting the number of simulated funds, retesting the transaction rate, retesting the price accuracy, retesting the number of transactions, retesting the data source. These parameters are not effective when the retesting page is modified, and the previously added market, exchange needs to be ticked off and re-added only after setting.
The real thing
Real-time settings are very simple, simply configuring the created robot to specify a custodian (i.e. on which custodian the robot will run); setting the K-line cycle; setting the exchange object to be operated (i.e. the exchange account object to be configured).
Running the interface
The strategy worked, and there was little difference between the real disk and the retest, only that the retest added some statistics automatically generated by the retest system.
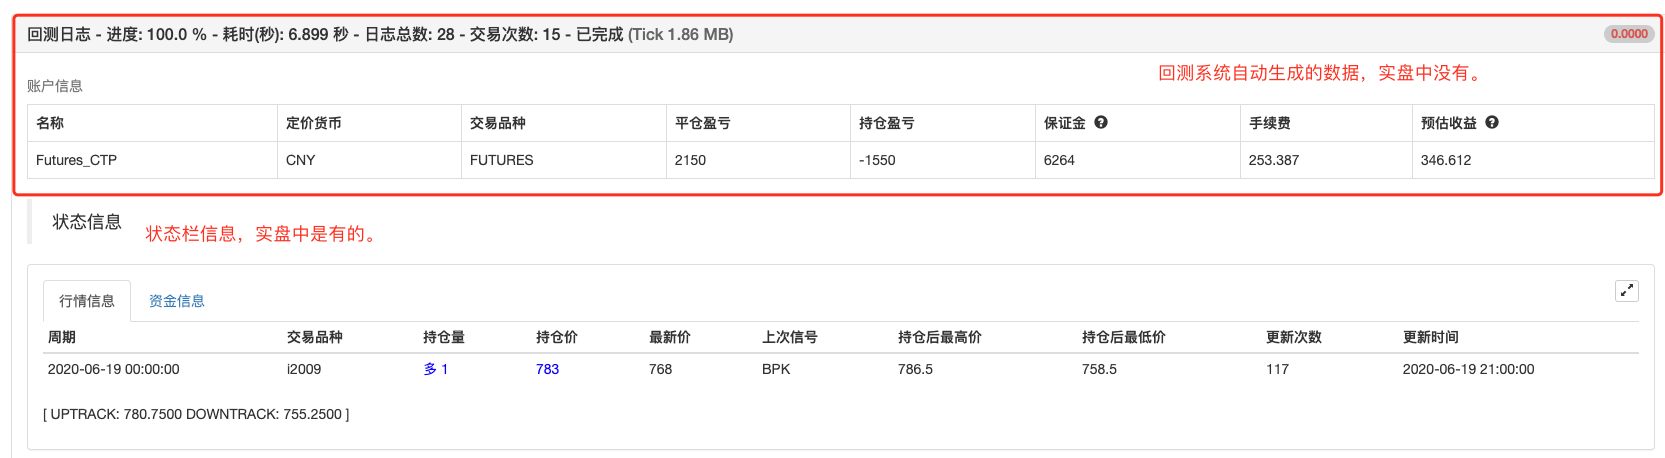
Status bar information
The status bar is divided into "Industry Information" and "Financial Information".What's going on?It mainly records the start time of the cycle of the current default K-line cycle, trading varieties ((contract code), holding volume, holding price, etc.). It should be noted that the parameters of the Mac language trading library template "real-time price model" and "closing price model" are set differently.
Funding informationIt mainly records the robot from the start of its operation to the current value of its funds.
The bottom of the status bar can also display arbitrary data in the policy, for example:UPTRACK, DOWNTRACK, depending on the requirements setup. Here you need to talk about how to assign values in the policy code.
The following symbol is used to assign a variable (excerpted from the Ma language API documentation)
Symbols:A symbol, representing an assignment and exported to a graph (subgraph) and displayed in a status bar form.
Symbols:=The symbol is equivalent to, and represents, an assignment, but is not exported to the diagram (main diagram, subgraph, etc.) nor is it shown in the status bar form.
Symbols^^The two ^ symbols represent the assignment, which is given to the variable and output to the diagram (main diagram) and displayed in the status bar table.
Symbols..Two. Symbols represent assignments, given variable assignments and displayed in a status bar form, but not output to a graph (main graph, subgraph, etc.).
These symbols can be seen as assignment operations, but the difference is whether the variable is shown in the state bar or whether the variable is drawn in the main diagram or in the appendix (shown later).^^、:、..You can display the value of the variable at the bottom of the status bar.
K-line chart Depending on the default K-line cycle of the policy retrieval, the policy generates a K-line chart and displays a curve of variable values on the K-line chart based on what the policy writes. For example, the chart in the example:
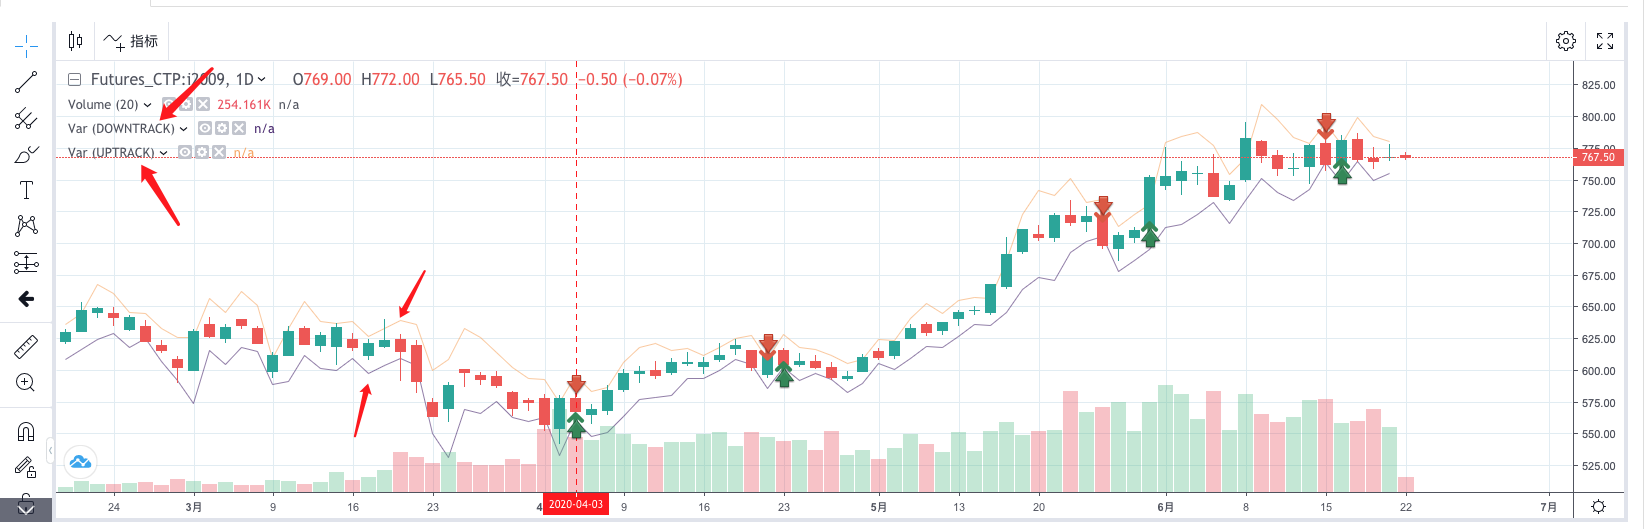
The main image:
So when do you need to show data in the mainframe, when do you need to show data in the mainframe?
When the data to be displayed, the size of the indicator line numerals and the price size of the indicated item are similar (i.e. the price value on the K-line BAR is approximately the same size), it can be shown in the main graph, such as the average line calculated by the strategy, such as the price trajectory calculated in this case.UPTRACKandDOWNTRACK)。
This is the second image:
What kind of data would be appropriate for subgraphs?
When the line to be drawn (the data shown) and the price value on the K line BAR are significantly different (much larger or much smaller than the price on the K line), it can be shown in the subgraph, because if it is shown in the main graph at this time, it will cause the image to be compressed, which is very inconvenient to observe. For example, when calculating the MACD indicator, the MACD indicator is shown on the chart.
For example, adding a sentence to this example strategy would make it easier for you to understand the strategy.AA^^(O-C)*100000;
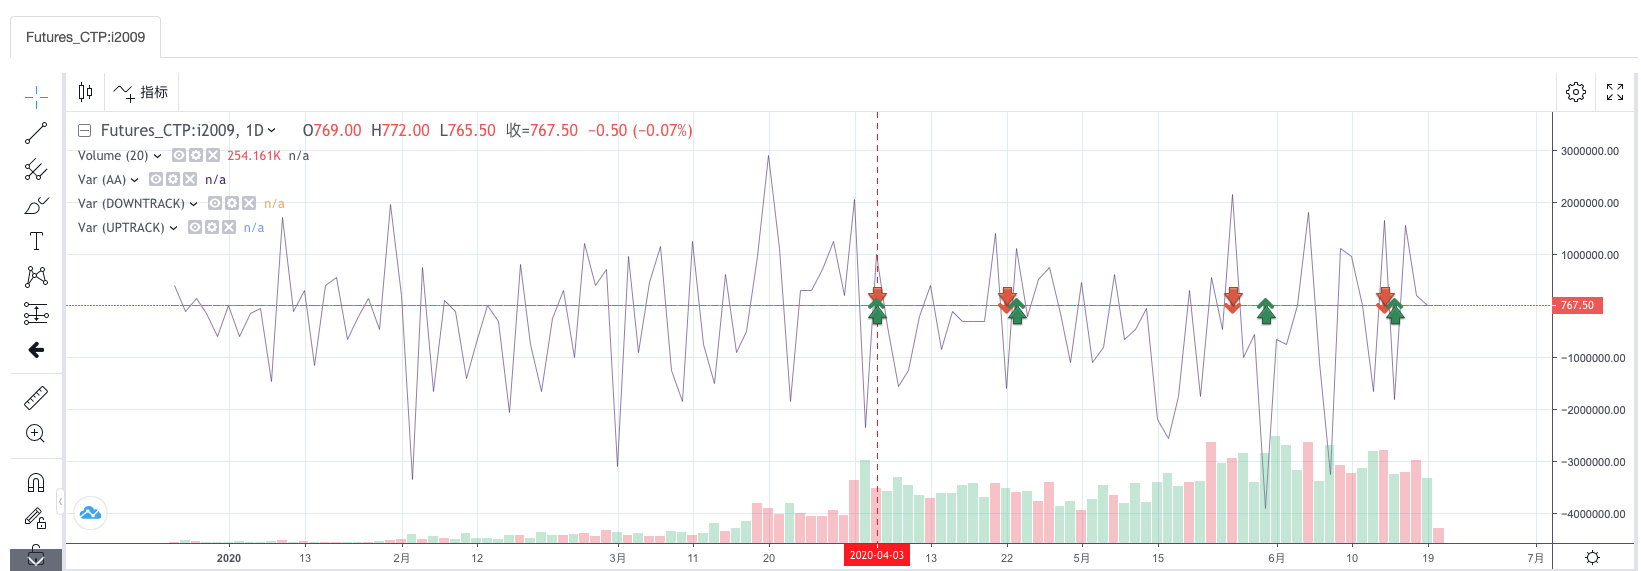
No direct compression of the K-line chart was found.
Another difference is that the real-time chart is HighCharts and the retracement chart is TradingView.
Graphs in real time: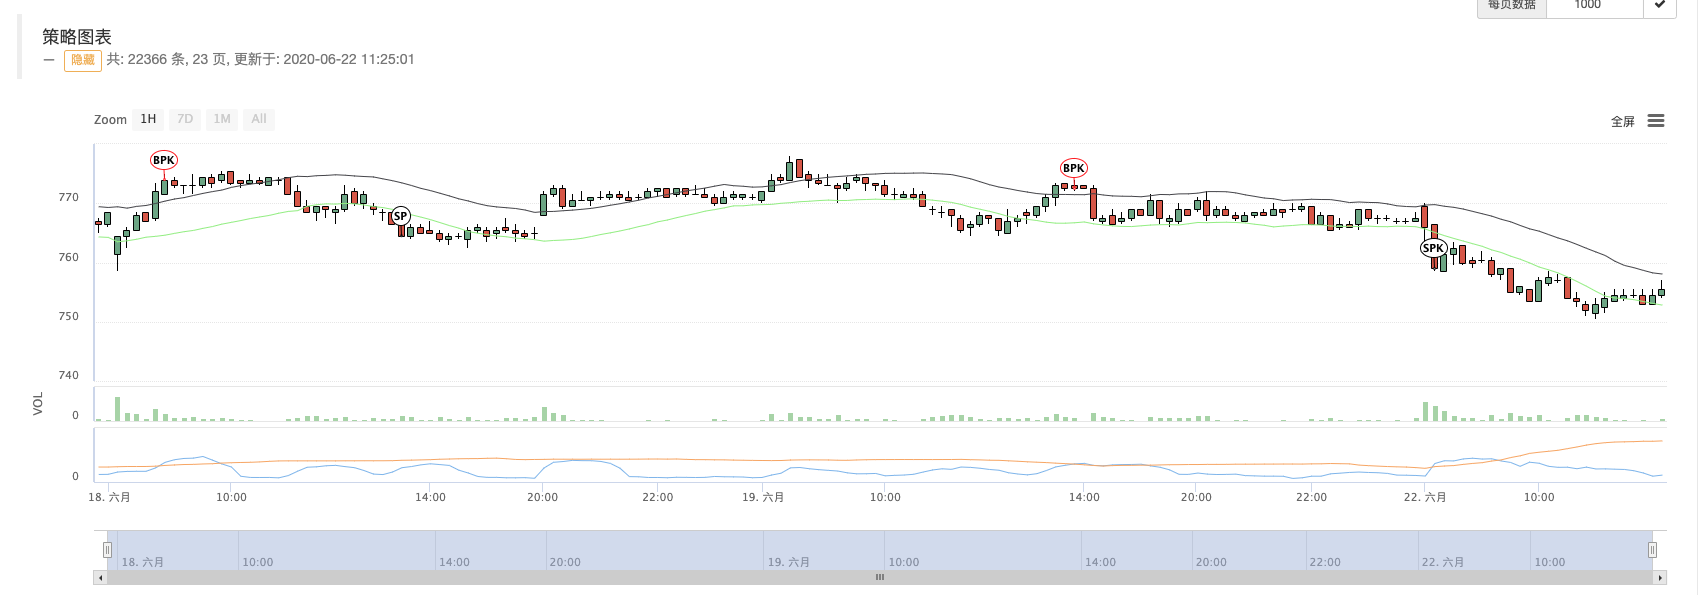
The log shows
The Malayalam language tactic, when triggering a trading signal (((((((((((((((((((((((((((((((((((((((((((((((((((((((((((((((((((((((((((((((((((((((((((((((((((((((((((((((((((((((((((((((((((((((((((((((((((((((((((((((((((((((((((((((((((((((((((((((((((((((((((((((((((((((((((((((((((((((((((((((((BK,SK,BP,SP,BPK,SPKA log will be printed showing the location (line number) of signal triggers in the code and the number of times the signal is triggered.
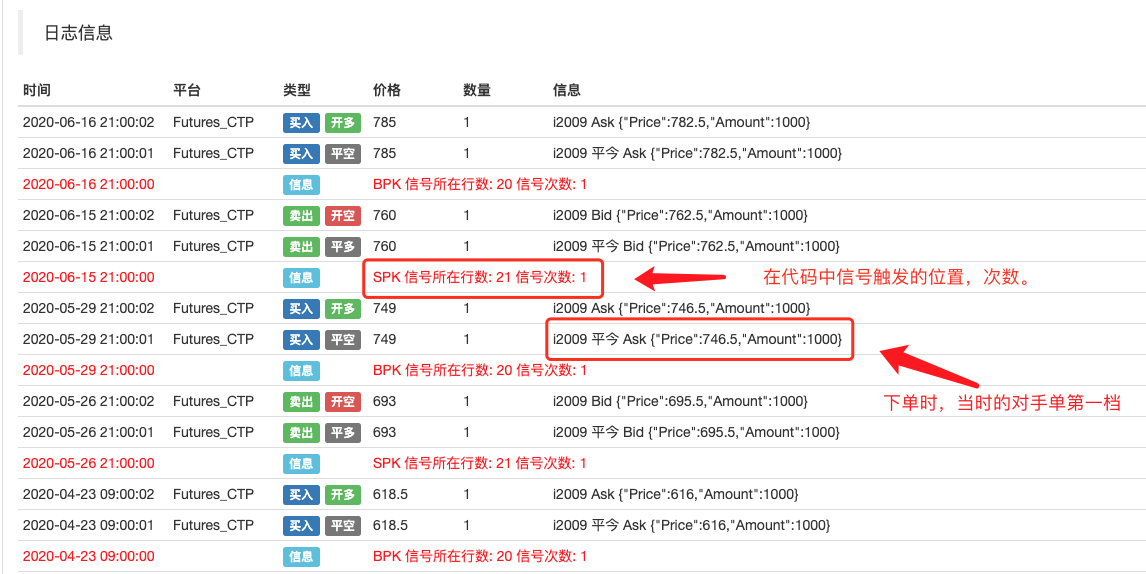
After the order log price, the log will also include the output price of the counterparty's first order at the time, for example, when buying more, it will show Ask, the price of selling a class order, the quantity.
- Quantifying Fundamental Analysis in the Cryptocurrency Market: Let Data Speak for Itself!
- Quantified research on the basics of coin circles - stop believing in all kinds of crazy professors, data is objective!
- The inventor of the Quantitative Data Exploration Module, an essential tool in the field of quantitative trading.
- Mastering Everything - Introduction to FMZ New Version of Trading Terminal (with TRB Arbitrage Source Code)
- Get all the details about the new FMZ trading terminal (with the TRB suite source code)
- FMZ Quant: An Analysis of Common Requirements Design Examples in the Cryptocurrency Market (II)
- How to Exploit Brainless Selling Bots with a High-Frequency Strategy in 80 Lines of Code
- FMZ quantification: common demands on the cryptocurrency market design example analysis (II)
- How to exploit brainless robots for sale with high-frequency strategies of 80 lines of code
- FMZ Quant: An Analysis of Common Requirements Design Examples in the Cryptocurrency Market (I)
- FMZ quantification: common demands of the cryptocurrency market design instance analysis (1)