
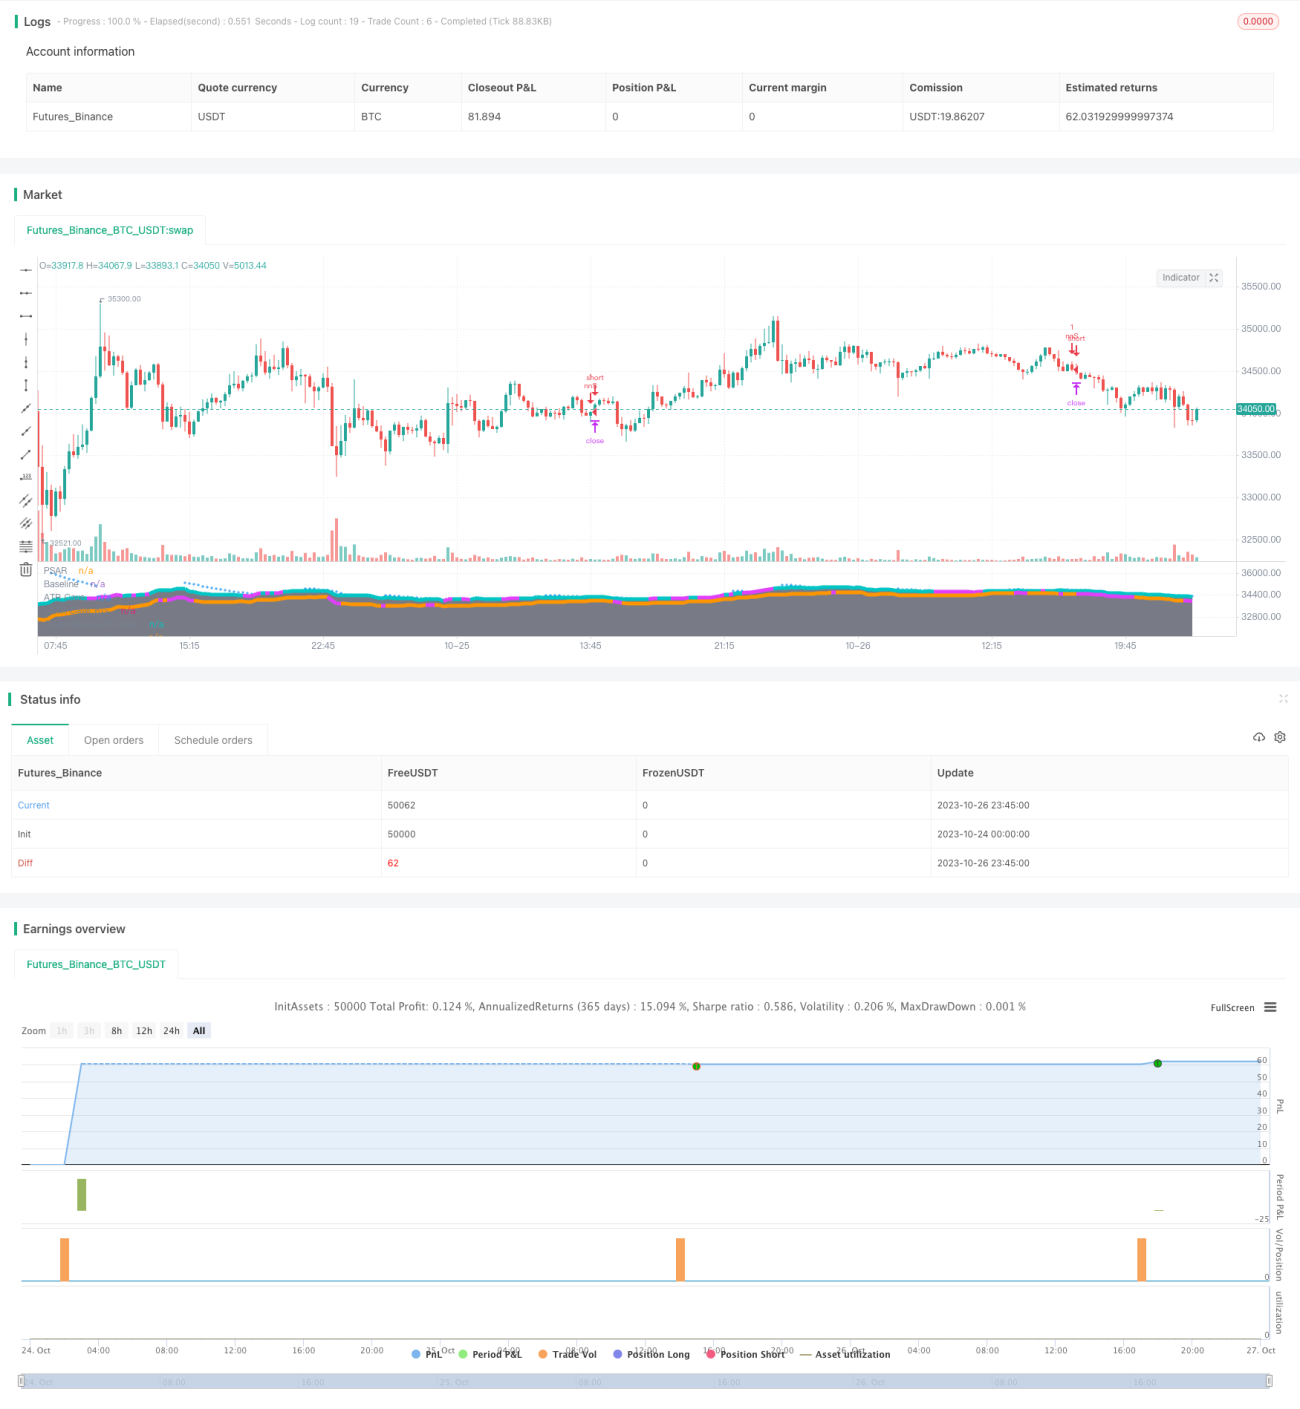
The Dual ATR Channel trend following strategy is a trend tracking strategy that combines moving averages, ATR channels and multiple technical indicators to follow the trend after it has been established.
The strategy uses the Kijun line as the main moving average indicator to determine the trend direction. It also incorporates ATR channels to limit the price activity range - not going long when price is near the upper band and not going short when price is near the lower band to avoid chasing new highs and selling lows.
When the Kijun line has an upward crossover, a buy signal is generated. When a downward crossover happens, a sell signal is triggered. To filter out false signals, the strategy also employs multiple technical indicators for confirmation, including Aroon, RSI, MACD and PSAR. A buy or sell signal is only triggered when all the confirmation conditions are met.
Once in a trade, the strategy uses stop loss and take profit to manage positions. The stop loss is set at 0.5 ATR and take profit at 0.5%. When the price crosses the Kijun line in the opposite direction again, the position will be closed immediately.
The dual ATR channel trend following strategy combines moving averages, ATR channels and multiple technical indicators to trade in the direction of the trend once established. Compared to single indicator strategies, it can greatly improve signal quality and win rate. The stop loss and take profit mechanisms also control risk. Through parameter optimization and combinatorial testing, this strategy has the potential to achieve steady profits. But its reliance on historical data is a concern and live performance requires further verification. Continuous optimization is key to ensuring robustness.
/*backtest
start: 2023-10-24 00:00:00
end: 2023-10-27 00:00:00
period: 15m
basePeriod: 5m
exchanges: [{"eid":"Futures_Binance","currency":"BTC_USDT"}]
*/
//@version=4
// strategy(title="NoNonsense Forex", overlay=true, default_qty_value=100000, initial_capital=100)
//////////////////////
////// BASELINE //////
//////////////////////
ma_slow_type = input(title="Baseline Type", type=input.string, defval="Kijun", options=["ALMA", "EMA", "DEMA", "TEMA", "WMA", "VWMA", "SMA", "SMMA", "HMA", "LSMA", "Kijun", "McGinley"])
ma_slow_src = close //input(title="MA Source", type=input.source, defval=close)
ma_slow_len = input(title="Baseline Length", type=input.integer, defval=20)
ma_slow_len_fast = input(title="Baseline Length Fast", type=input.integer, defval=12)
lsma_offset = input(defval=0, title="* Least Squares (LSMA) Only - Offset Value", minval=0)
alma_offset = input(defval=0.85, title="* Arnaud Legoux (ALMA) Only - Offset Value", minval=0, step=0.01)
alma_sigma = input(defval=6, title="* Arnaud Legoux (ALMA) Only - Sigma Value", minval=0)
ma(type, src, len) =>
float result = 0
if type=="SMA" // Simple
result := sma(src, len)
if type=="EMA" // Exponential
result := ema(src, len)
if type=="DEMA" // Double Exponential
e = ema(src, len)
result := 2 * e - ema(e, len)
if type=="TEMA" // Triple Exponential
e = ema(src, len)
result := 3 * (e - ema(e, len)) + ema(ema(e, len), len)
if type=="WMA" // Weighted
result := wma(src, len)
if type=="VWMA" // Volume Weighted
result := vwma(src, len)
if type=="SMMA" // Smoothed
w = wma(src, len)
result := na(w[1]) ? sma(src, len) : (w[1] * (len - 1) + src) / len
if type=="HMA" // Hull
result := wma(2 * wma(src, len / 2) - wma(src, len), round(sqrt(len)))
if type=="LSMA" // Least Squares
result := linreg(src, len, lsma_offset)
if type=="ALMA" // Arnaud Legoux
result := alma(src, len, alma_offset, alma_sigma)
if type=="Kijun" //Kijun-sen
kijun = avg(lowest(len), highest(len))
result :=kijun
if type=="McGinley"
mg = 0.0
mg := na(mg[1]) ? ema(src, len) : mg[1] + (src - mg[1]) / (len * pow(src/mg[1], 4))
result :=mg
result
baseline = ma(ma_slow_type, ma_slow_src, ma_slow_len)
plot(baseline, title='Baseline', color=rising(baseline,1) ? color.green : falling(baseline,1) ? color.maroon : na, linewidth=3)
//////////////////
////// ATR ///////
//////////////////
atrlength=input(14, title="ATR Length")
one_atr=rma(tr(true), atrlength)
upper_atr_band=baseline+one_atr
lower_atr_band=baseline-one_atr
plot(upper_atr_band, color=color.gray, style=plot.style_areabr, transp=95, histbase=50000, title='ATR Cave')
plot(lower_atr_band, color=color.gray, style=plot.style_areabr, transp=95, histbase=0, title='ATR Cave')
plot(upper_atr_band, color=close>upper_atr_band ? color.fuchsia : na, style=plot.style_line, linewidth=5, transp=50, title='Close above ATR cave')
plot(lower_atr_band, color=close<lower_atr_band ? color.fuchsia : na, style=plot.style_line, linewidth=5, transp=50, title='Close below ATR cave')
donttradeoutside_atrcave=input(true)
too_high = close>upper_atr_band and donttradeoutside_atrcave
too_low = close<lower_atr_band and donttradeoutside_atrcave
////////////////////////////
////// CONFIRMATION 1 ////// the trigger actually
////////////////////////////
lenaroon = input(8, minval=1, title="Length Aroon")
c1upper = 100 * (highestbars(high, lenaroon+1) + lenaroon)/lenaroon
c1lower = 100 * (lowestbars(low, lenaroon+1) + lenaroon)/lenaroon
c1CrossUp=crossover(c1upper,c1lower)
c1CrossDown=crossunder(c1upper,c1lower)
////////////////////////////////
////// CONFIRMATION: MACD //////
////////////////////////////////
dont_use_macd=input(false)
macd_fast_length = input(title="Fast Length", type=input.integer, defval=13)
macd_slow_length = input(title="Slow Length", type=input.integer, defval=26)
macd_signal_length = input(title="Signal Smoothing", type=input.integer, minval = 1, maxval = 50, defval = 9)
macd_fast_ma = ema(close, macd_fast_length)
macd_slow_ma = ema(close, macd_slow_length)
macd = macd_fast_ma - macd_slow_ma
macd_signal = ema(macd, macd_signal_length)
macd_hist = macd - macd_signal
macdLong=macd_hist>0 or dont_use_macd
macdShort=macd_hist<0 or dont_use_macd
/////////////////////////////
///// CONFIRMATION: RSI /////
/////////////////////////////
dont_use_rsi=input(false)
lenrsi = input(14, minval=1, title="RSI Length") //14
up = rma(max(change(close), 0), lenrsi)
down = rma(-min(change(close), 0), lenrsi)
rsi = down == 0 ? 100 : up == 0 ? 0 : 100 - (100 / (1 + up / down))
rsiLong=rsi>50 or dont_use_rsi
rsiShort=rsi<50 or dont_use_rsi
//////////////////////////////
///// CONFIRMATION: PSAR /////
//////////////////////////////
dont_use_psar=input(false)
psar_start = input(0.03, step=0.01)
psar_increment = input(0.018, step=0.001)
psar_maximum = input(0.11, step=0.01) //default 0.08
psar = sar(psar_start, psar_increment, psar_maximum)
plot(psar, style=plot.style_cross, color=color.blue, title='PSAR')
psarLong=close>psar or dont_use_psar
psarShort=close<psar or dont_use_psar
/////////////////////////
///// CONFIRMATIONS /////
/////////////////////////
Long_Confirmations=psarLong and rsiLong and macdLong
Short_Confirmations=psarShort and rsiShort and macdShort
GoLong=c1CrossUp and Long_Confirmations and not too_high
GoShort=c1CrossDown and Short_Confirmations and not too_low
////////////////////
///// STRATEGY /////
////////////////////
use_exit=input(false)
KillLong=c1CrossDown and use_exit
KillShort=c1CrossUp and use_exit
SL=input(0.5, step=0.1)/syminfo.mintick
TP=input(0.005, step=0.001)/syminfo.mintick
strategy.entry("nnL", strategy.long, when = GoLong)
strategy.entry("nnS", strategy.short, when = GoShort)
strategy.exit("XL-nn", from_entry = "nnL", loss = SL, profit=TP)
strategy.exit("XS-nn", from_entry = "nnS", loss = SL, profit=TP)
strategy.close("nnL", when = KillLong)
strategy.close("nnS", when = KillShort)