RSI and SuperTrend Based Dual Direction Trading Strategy

Overview
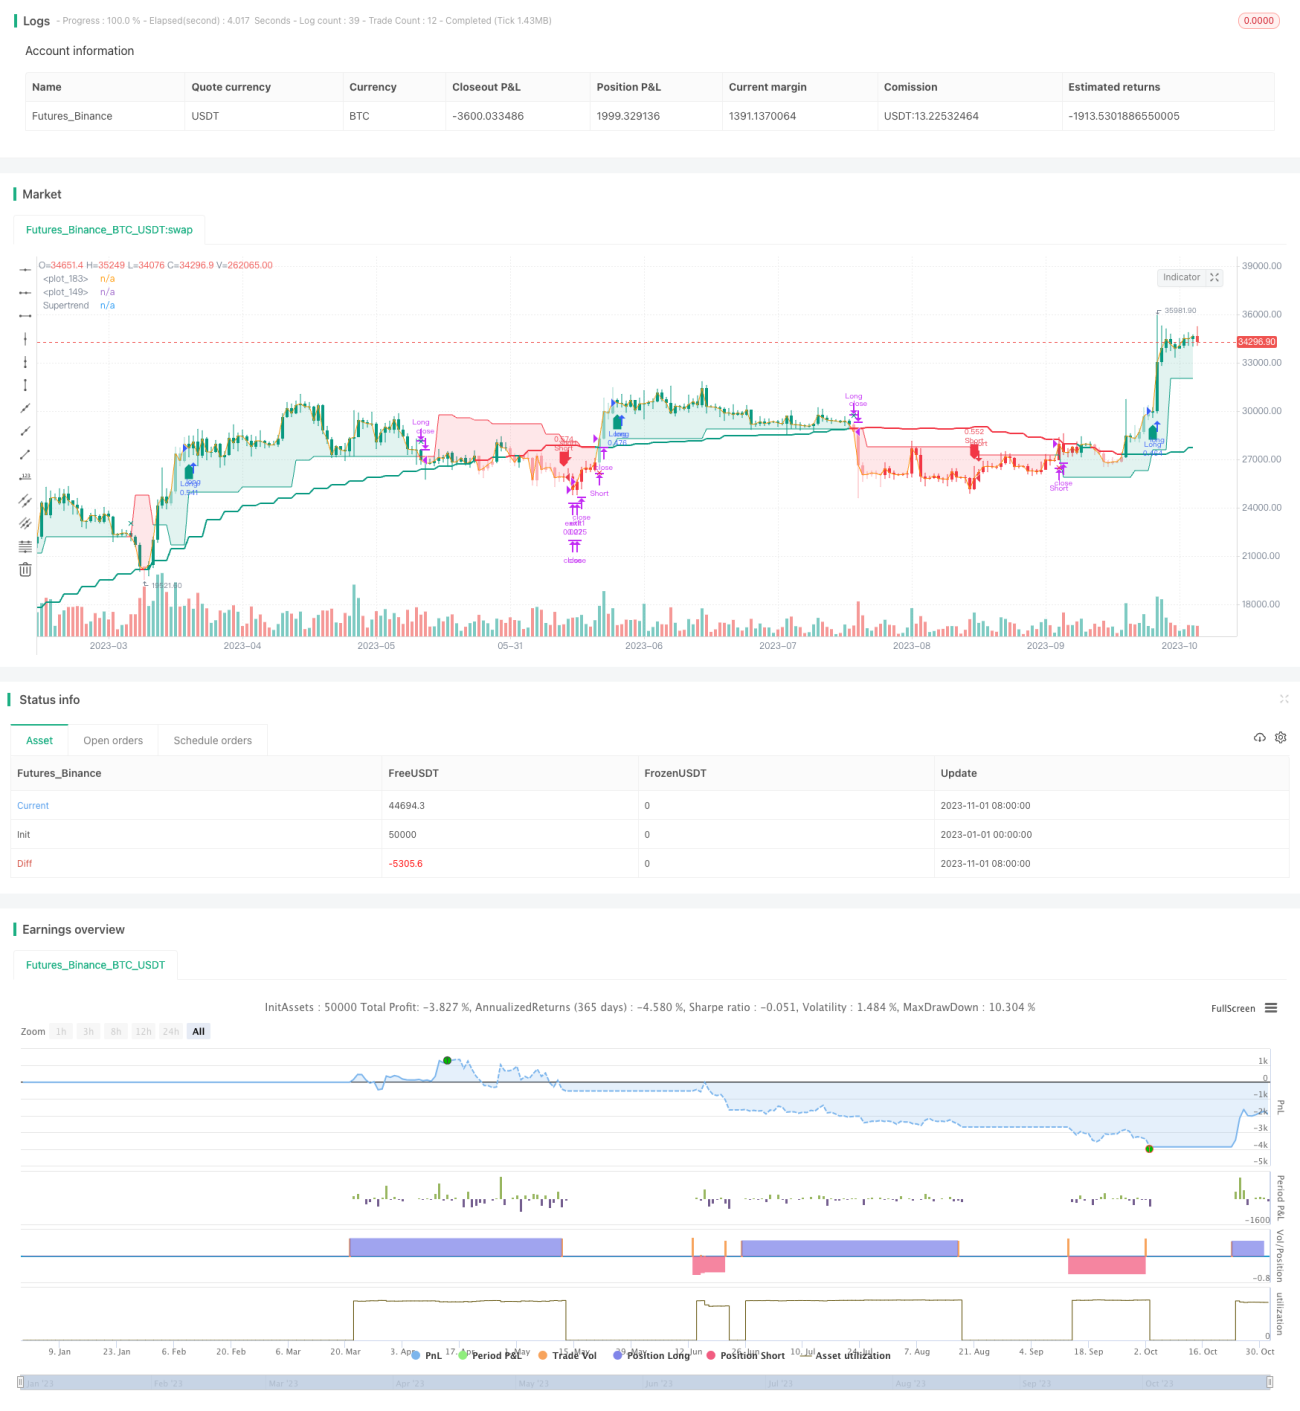
This is a dual direction trading strategy that comprehensively utilizes the RSI indicator and the SuperTrend indicator. The strategy aims to identify the strength and weakness in the market and make timely position switching when the trend direction changes, in order to obtain higher returns.
Strategy Principle
The strategy is mainly based on the following principles:
-
Use the RSI indicator to determine the current market strength and weakness. Above 50 RSI indicates a strong market, and below 50 a weak one.
-
Use the SuperTrend indicator as a trend filter. Trading signals are triggered only when the price breaks through the SuperTrend lines.
-
When RSI gives a strong signal, go long if the price breaks above the upper band, and close position if it breaks below the lower band.
-
When RSI gives a weak signal, go short if the price breaks below the lower band, and close position if it breaks above the upper band.
-
Capture turning points by monitoring the transitions of RSI between long and short, and make timely position switching.
Implementation
-
Calculate RSI values with length of 14, using 50 as the threshold for strength/weakness.
-
Calculate SuperTrend with length of 10 and multiplier of 2.
-
Go long when RSI goes above 50 and price breaks above SuperTrend upper band. Go short when RSI falls below 50 and price breaks below lower band.
-
When already long, if RSI turns weak and price breaks below upper band, close long position. Vice versa when short.
-
Configurable for long-only or short-only modes.
Advantages
This strategy combines trend following and overbought/oversold analysis, and has the following advantages:
-
Can capture trend changes in a timely manner and avoid unnecessary entries.
-
RSI effectively identifies overbought/oversold zones to avoid chasing tops and bottoms.
-
SuperTrend filters out market noise well and tracks mid-long term trends.
-
Combining RSI and SuperTrend improves stability.
-
The strategy has large parameter tuning space for different products and timeframes.
-
Supports long-only/short-only modes to handle different market conditions flexibly.
Risks
There are also some risks with this strategy:
-
RSI can generate false signals easily, requiring price confirmation.
-
Bad SuperTrend parameters may cause missed trades or chasing.
-
Divergence risk exists when combining two indicators. Parameters need to be adjusted for best match.
-
Stop loss may be taken out instantly in extreme volatility. Reasonable stop loss placement is necessary.
-
Avoid taking reversal positions near major support/resistance levels.
Enhancements
The strategy can be further optimized in the following aspects:
-
Adjust RSI parameters to find the optimal length for filtering out false signals.
-
Optimize SuperTrend parameters for better trend tracking capability.
-
Test different parameter combinations on different products and timeframes to find the optimum.
-
Add other indicators like MACD, KDJ to improve signal accuracy.
-
Add analysis of key support/resistance, Bollinger Bands, moving averages etc. to qualify strategy signals.
-
Optimize stop loss strategy to reduce being stopped out while maintaining effectiveness.
Conclusion
This strategy integrates the strengths of RSI and SuperTrend to effectively identify mid-term trend changes between bull and bear markets. The strategy is easy to implement with clear logic and has strong practical value. With parameter tuning it can adapt to more market conditions. Common issues like false signals and bad parameters need to be watched out for. Overall this is a solid trend following strategy.
/*backtest
start: 2023-01-01 00:00:00
end: 2023-11-02 00:00:00
period: 1d
basePeriod: 1h
exchanges: [{"eid":"Futures_Binance","currency":"BTC_USDT"}]
*/

// This source code is subject to the terms of the Mozilla Public License 2.0 at https://mozilla.org/MPL/2.0/
//@version=5
//Created by @CITIAlgo
// —————————————————————————————————————————————————————————————————————————————————————————————————————————- 1