Momentum Breakout Strategy

Overview
This is a strategy that uses MACD, RSI and Stochastic indicators to determine price momentum direction and makes long or short entries at momentum breakout points. By combining multiple indicators to judge the trend, it reduces the false signal rate of single indicators and can effectively capture medium-term trends in prices.
Principle
The strategy uses MACD, RSI and Stochastic indicators to determine the trend direction of prices. When MACD's DIFF line crosses above DEAL line, RSI is greater than 50, and STOCH's fast line is also greater than 50, it is judged as a bullish trend forming, so it will long at the next day's opening price with all capital at the highest price of the day; Conversely, when MACD's DIFF line crosses below DEAL line, RSI is less than 50, and STOCH's fast line is also less than 50, it is judged as a bearish trend forming, so it will short at the next day's opening price with all capital at the lowest price of the day. The take profit and stop loss are calculated based on the price fluctuation range of the past 7 days, and the profit/loss ratio can be customized.
After entering a position, if any of the three indicators generates a reverse signal, it means the trend has reversed and should exit the current position. It also sets special time condition filters that skip the entire month of March 2020 to avoid extreme market impact.
Advantages
- Combining multiple indicators to judge the trend can effectively filter false signals
- Taking advantage of breakouts can capture the early stage of trends
- Using dynamic take profit and stop loss can lock in reasonable profits
- Skipping periods can prevent interference from extreme markets
- Combining trend following and reversal mechanisms can reduce unnecessary trades
Risks
- Multiple indicator combos may cause lag, missing best entry timing
- Breakout signals are prone to being trapped
- Dynamic stops may be too aggressive and stopped out by Preis
- Skipping special periods may miss opportunities if configured improperly
- Reversal signals may be too sensitive leading to over-trading
Improvement directions:
- Adjust indicator parameters to reduce lag
- Add filters like volume to avoid traps
- Use tracker stops to prevent Preis stops
- Optimize and test skipped date ranges
- Tune reversal signal parameters to reduce frequency
Summary
Overall this is a typical trend following strategy. It uses multiple indicators to determine trend for entries, and reversal signals to judge trend endings for exits, combining both trend following and reversal mechanisms. But the strategy itself also has some improper parameter settings and lag issues that need lots of backtesting to optimize and improve, in order to adjust all strategy parameters to their optimal state.
In summary, the logic of this strategy is clear, and the indicators used are also typical. It does well in some details of optimization and risk control, and can be a real-world applicable quant strategy. But there are still some gaps from perfection, requiring further testing and optimization, to get the return/drawdown ratio of the strategy up to a professional level. With continuous optimization and updates, this strategy can become one worth tracking long term.
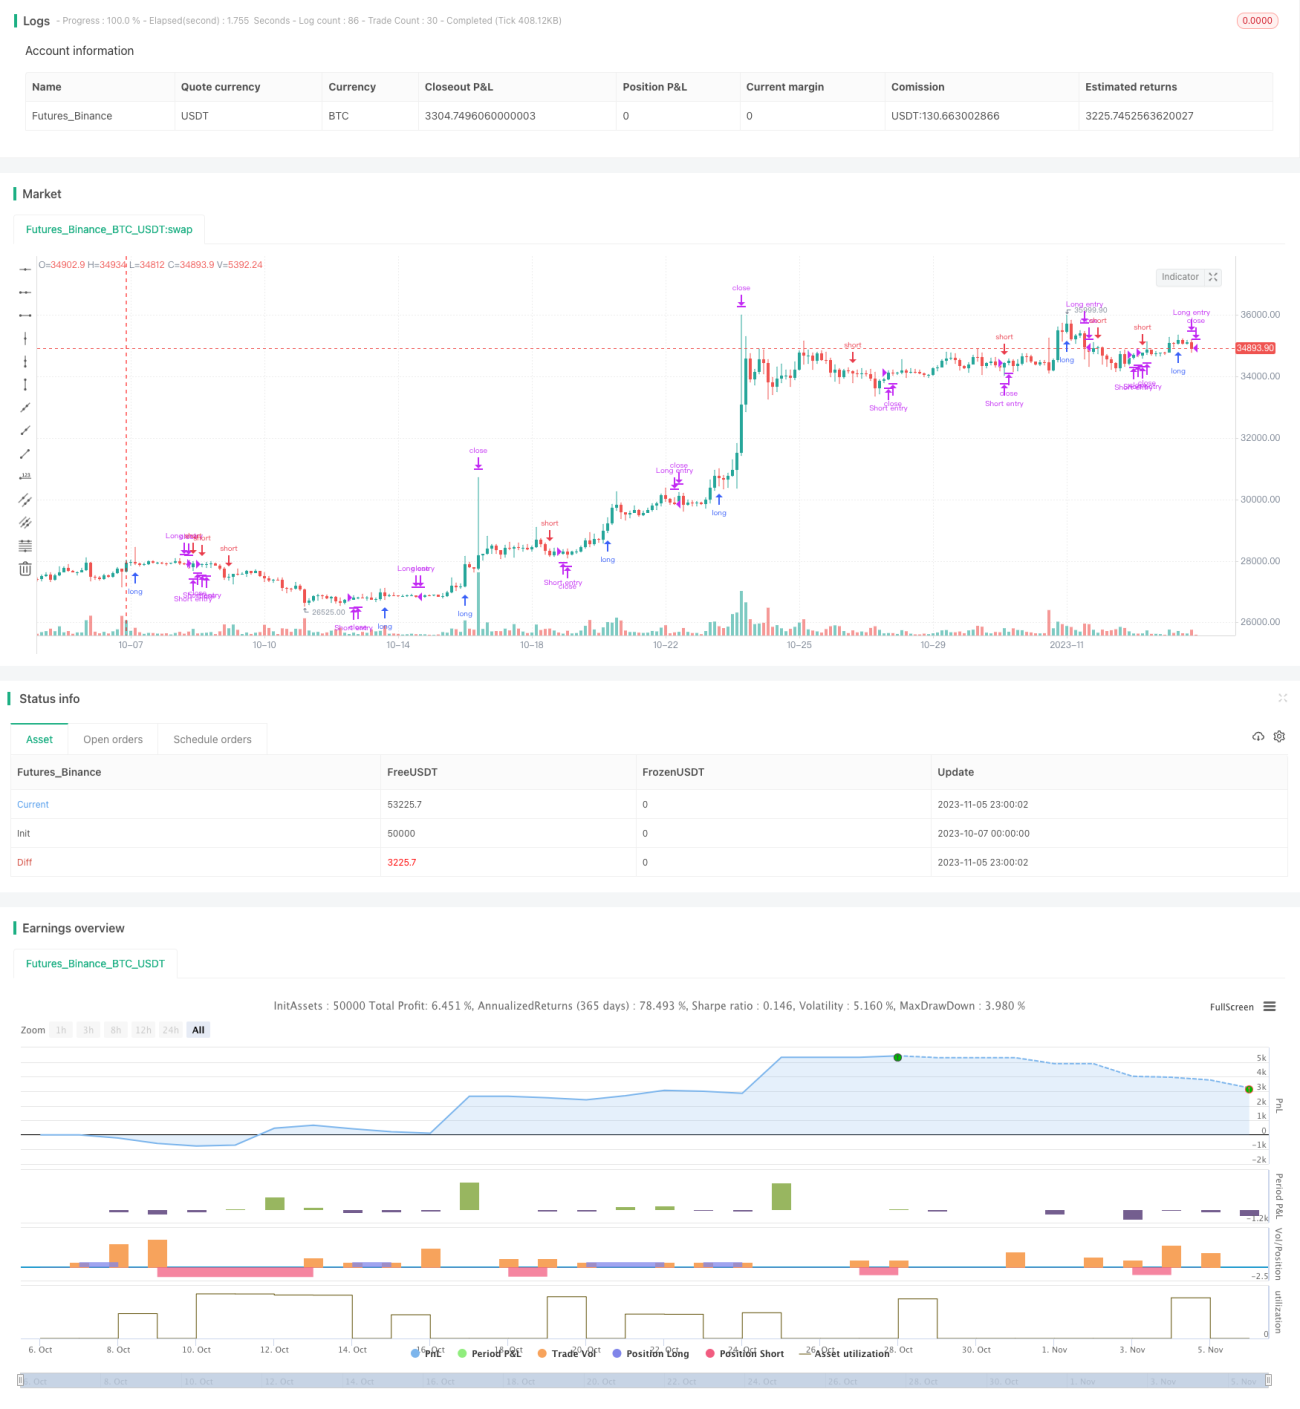
/*backtest
start: 2023-10-07 00:00:00
end: 2023-11-06 00:00:00
period: 3h
basePeriod: 15m
exchanges: [{"eid":"Futures_Binance","currency":"BTC_USDT"}]
*/

// @version=4
// Backtest the power x strategy. The power x strategy is develop by Markus Heitkoetter and Rockwell Trading.
// This script shows the return for a given stock for with the defined date range with a fixed captial of $10,000
strategy("PowerX Test", overlay=true, initial_capital=10000)- 1