BB Percentage Index Trend Fading Strategy

1
Follow
1779
Followers
Overview
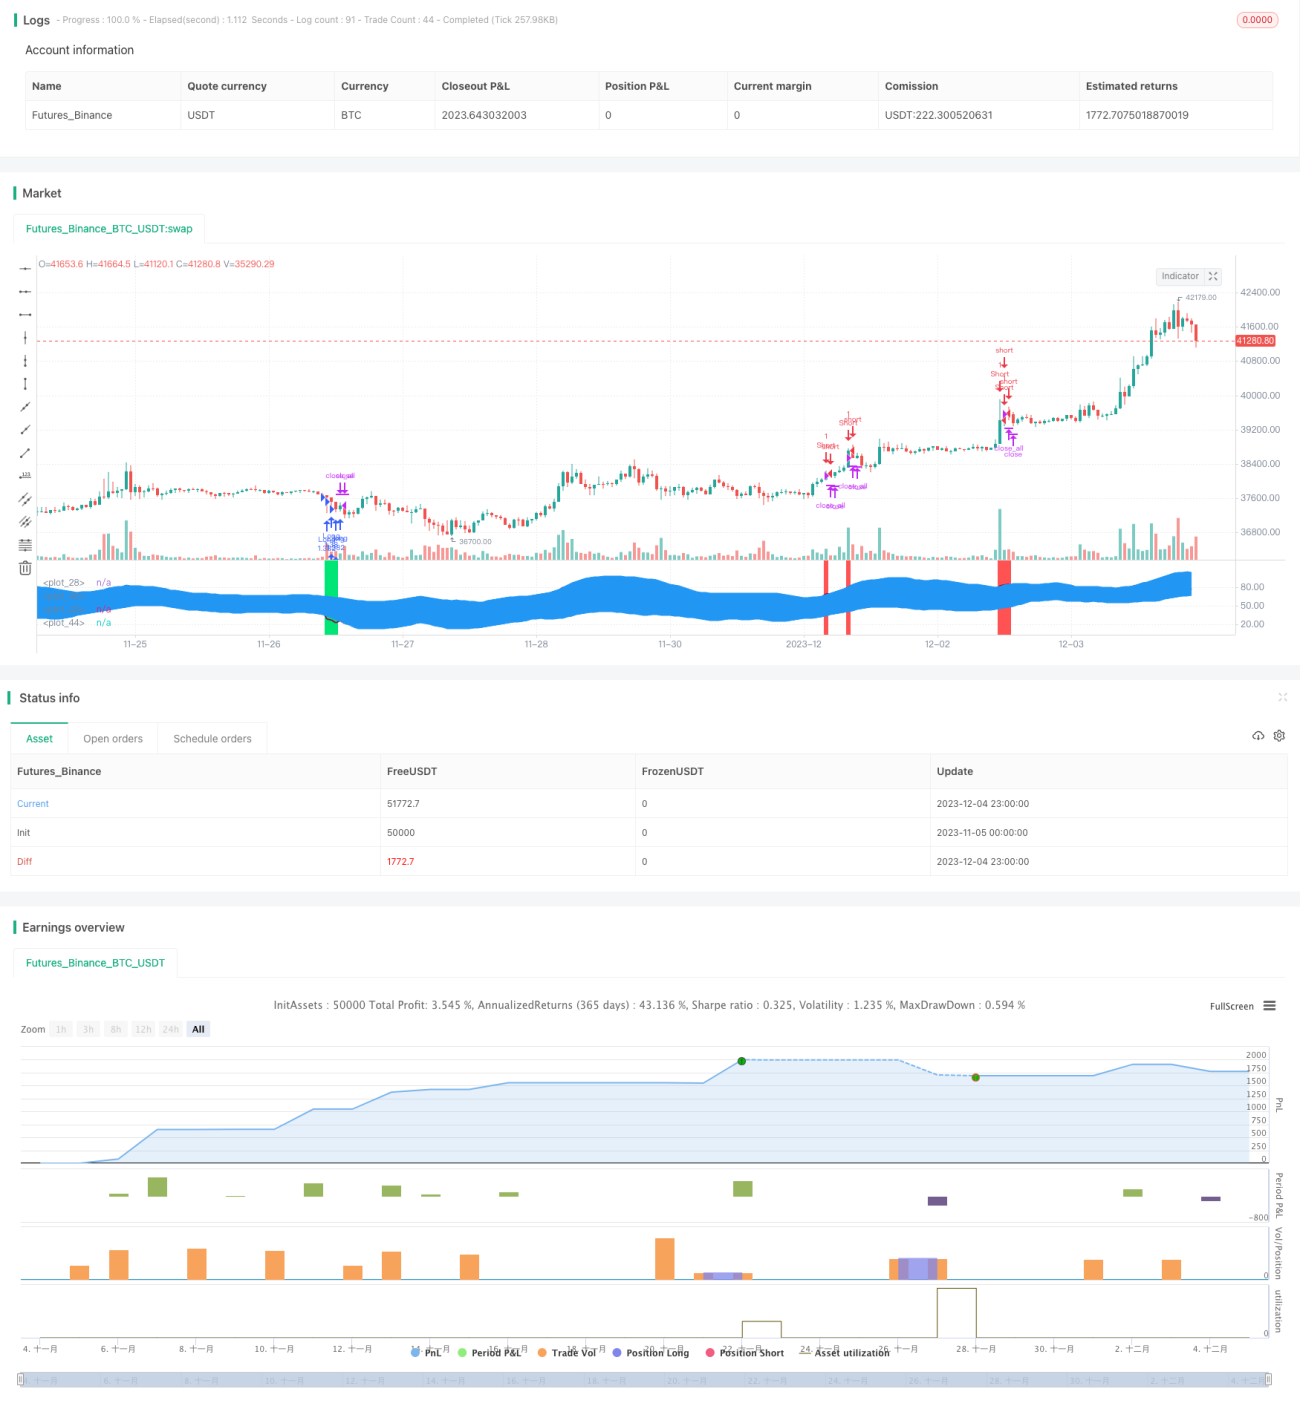
This strategy is based on the BB percentage index combined with RSI and MFI indicators. It makes long and short decisions by detecting price breakouts of Bollinger Bands upper and lower rail, together with RSI oversold/overbought signals and MFI oversold/overbought signals. It is a typical trend fading trading strategy.
Strategy Logic
- Calculate Bollinger Band Percentage (BB%). BB% represents the standard deviation of the price relative to the Bollinger middle band, which judges market direction through the Bollinger channel.
- Incorporate RSI and MFI indicators to determine overbought and oversold conditions. RSI compares the average gain and average loss over a period of time to determine overbought and oversold levels. MFI compares up volume and down volume to determine overbought and oversold levels.
- When the price breaks through the Bollinger lower rail upward, go long; when the price breaks through the Bollinger upper rail downward, go short. At the same time, use the oversold/overbought signals from RSI and MFI indicators for filtration.
Advantages
- Trend fading trading avoids market trends and reduces return fluctuations.
- The combination of multiple indicators filters signals and improves decision accuracy.
- Parameterized settings are flexible for adjusting risk-return characteristics of the strategy.
- Applicable to highly volatile instruments like commodities, forex, cryptocurrencies, etc.
Risks and Solutions
- There is a high probability of false signals from Bollinger breakouts, requiring a combination of multiple indicators for filtration.
- Breakout signal judgment requires appropriately relaxed criteria to avoid missing good opportunities.
- Adjust parameter settings to control risks, such as position sizing, raising stop loss lines, etc.
Optimization Directions
- Incorporate volatility-based stop loss mechanisms such as the ATR indicator.
- Introduce machine learning models to assist in judging breakout signal quality.
- Optimize instrument selection mechanisms to dynamically adjust participating instruments.
- Incorporate more factors like sentiment indicators, news, etc. to improve the decision framework.
Conclusion
This strategy is mainly applied to high volatility non-trending instruments. It implements trend fading trading through Bollinger channel and indicator combinations. Risk-return characteristics can be controlled by adjusting parameters. Further improvements can be made by introducing more auxiliary indicators and models to optimize decision quality, thereby achieving better strategy performance.
Source
Pine
Strategy parameters
Related strategies
Comment
All comments (0)
No data
- 1