Intraday Pivot Points Trading Strategy

1
Follow
1779
Followers
Overview
This is an intraday trading strategy for Indian market focusing on key support and resistance levels calculated from open, high, low and close prices of the previous trading day. Trades are taken when price breaks through these key levels.
Strategy Logic
- Calculate previous day's high, low and close prices
- Calculate key support level S1, resistance level R1 and pivot point PP using formulas
- Take long or short trades when price breaks through these levels
- Use stop loss exits
Key point formulas:
PP = (High + Low + Close) /3
R1 = 2*PP - Low
S1 = 2*PP - High
Advantage Analysis
- Key points provide high probability breakout opportunities resulting in greater profit potential
- Easy to identify key points, clear trading rules
- Easy to set stop loss, effectively control risks
Risk Analysis
- Possible false breakouts at key points causing losses
- Validity of key points needs verification, may not always work
- Improper stop loss can increase losses
Risk Mitigations:
- Combine with other indicators to filter false breakouts
- Backtest over long timeframes to validate strategy
- Optimize stop loss placement
Improvement Opportunities
- Combine other technical indicators to filter false signals
- Parameter tuning for different products
- Dynamic stop loss adjustment
Conclusion
Overall this is a simple and straightforward strategy which can be easily validated with historical data. As an intraday strategy, it provides high probability breakout opportunities at key levels resulting in good performance. But there are some false breakout risks relying on pivot points that need further optimization. In summary, this is an easy to implement, controllable risk intraday trading strategy.
Source
Pine
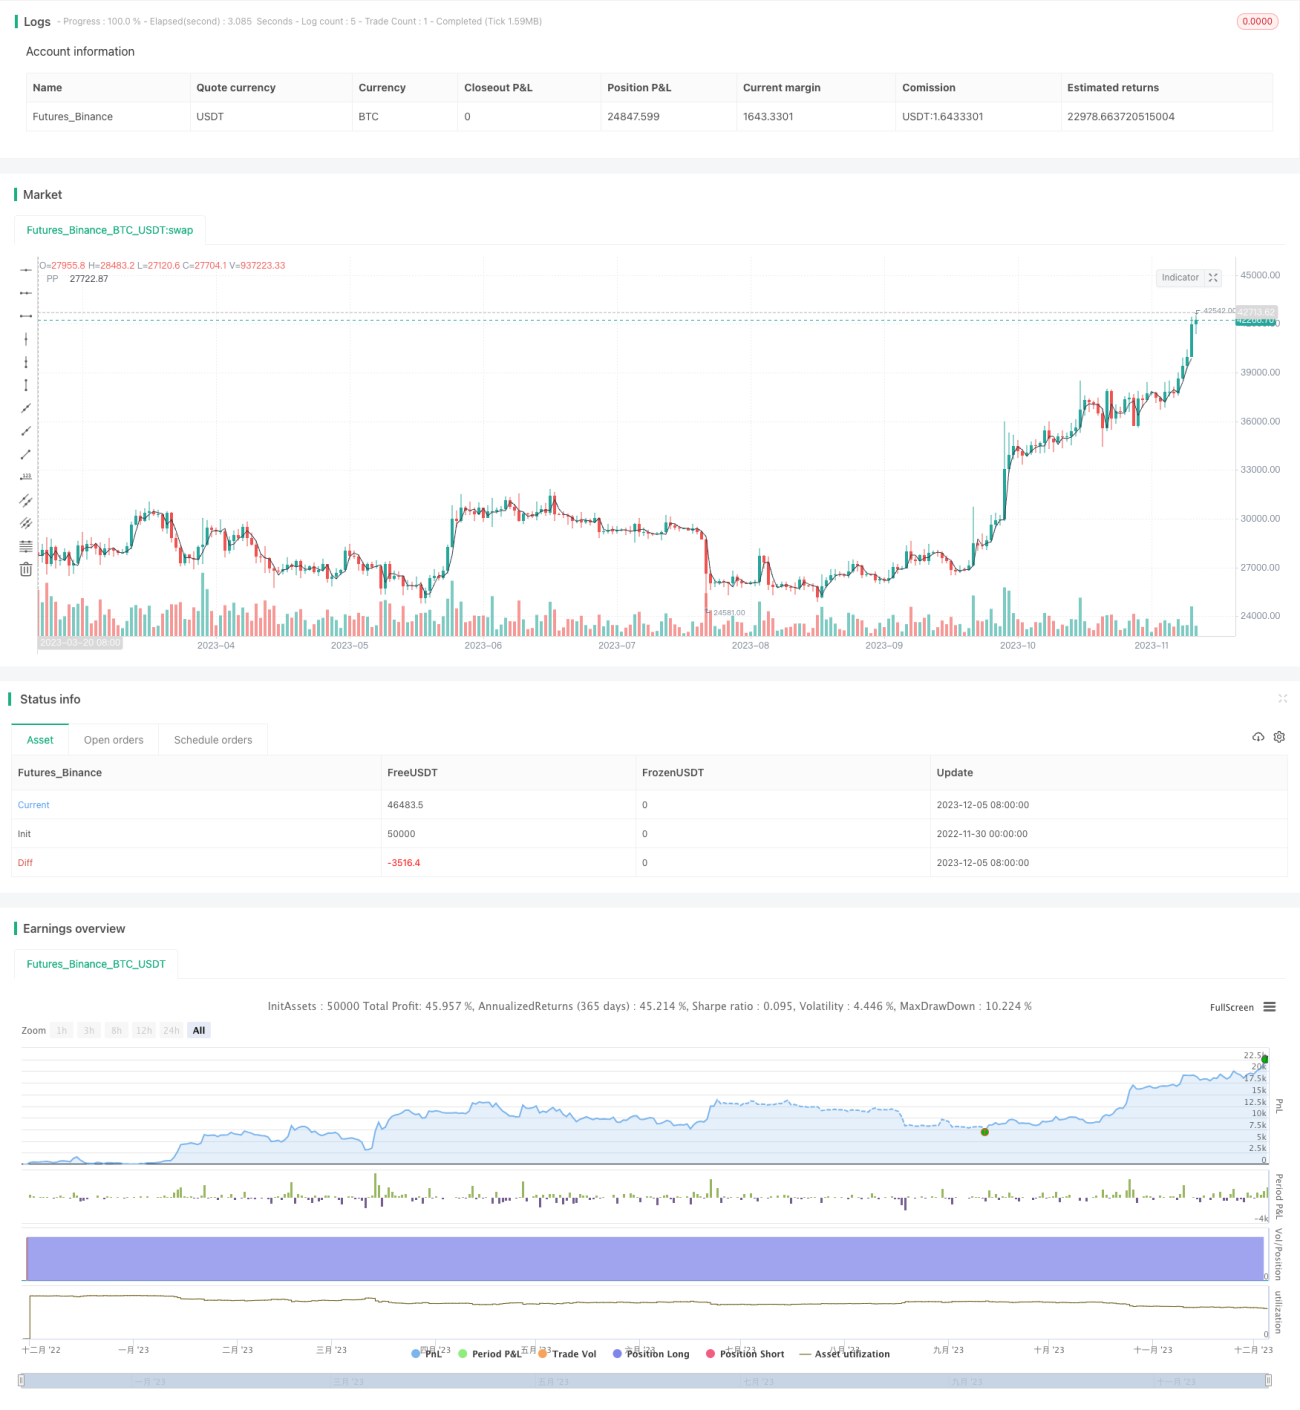
/*backtest
start: 2022-11-30 00:00:00
end: 2023-12-06 00:00:00
period: 1d
basePeriod: 1h
exchanges: [{"eid":"Futures_Binance","currency":"BTC_USDT"}]
*/

// This source code is subject to the terms of the Mozilla Public License 2.0 at https://mozilla.org/MPL/2.0/
// © arameshraju
//Reference credit goes to All
Strategy parameters
Related strategies
Comment
All comments (0)
No data
- 1