Dynamic Pattern Trend Reversal Strategy

Overview
The Dynamic Pattern Trend Reversal strategy uses linear regression to predict prices and moving average lines to form pattern for generating trading signals. It produces buy signals when the predicted price crosses above the moving average line upwards and sell signals when crossing below downwards, capturing trend reversals.
Strategy Logic
- Calculate linear regression of stock price based on trading volume to obtain predicted price
- Compute moving averages under diferentes conditions
- Generate buy signal when predicted price crosses moving average upwards
- Generate sell signal when predicted price crosses moving average downwards
- Incorporate MACD indicator to determine timing of trend reversal
The combination of above signals with multiple confirmations avoids false breakouts and improves accuracy.
Advantage Analysis
- Utilize linear regression to predict price trend, enhancing signal accuracy
- Capture trend reversals via moving average patterns
- Regression based on trading volume has better economics meaning
- Multiple confirmations by MACD etc. reduce false signals
Risk Analysis
- Parameters of linear regression significantly impact results
- Moving average settings also affect signal quality
- Despite having confirmations, false signals remain a risk
- Code can be further optimized to reduce trade frequency and improve profit rate
Optimization Directions
- Optimize parameters of linear regression and moving averages
- Add more confirmation conditions to lower false signal rates
- Incorporate more factors to judge quality of trend reversals
- Enhance stop loss strategies to reduce risks for individual trades
Conclusion
The Dynamic Pattern Trend Reversal strategy integrates linear regression prediction and moving average patterns to capture trend reversals. Compared to single indicator strategies, it has higher reliability. Further improvements on parameters, confirmations and other optimizations can enhance signal quality and profitability.
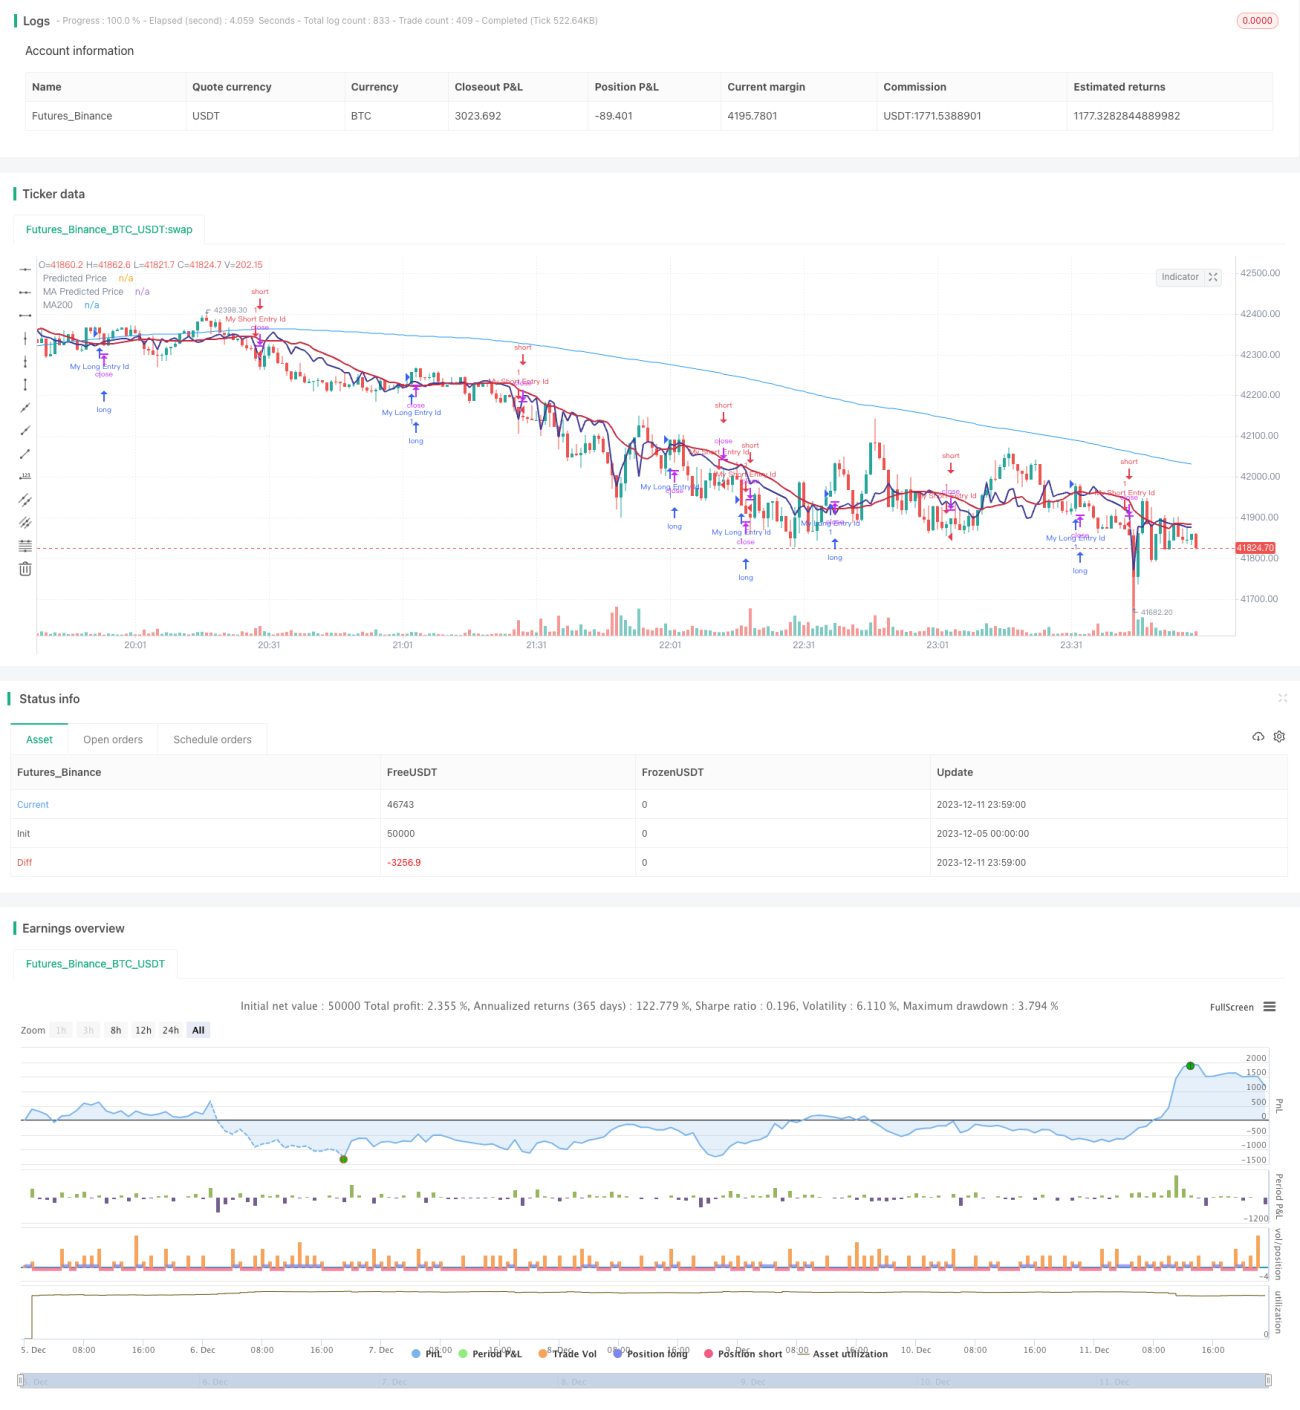
/*backtest
start: 2023-12-05 00:00:00
end: 2023-12-12 00:00:00
period: 1m
basePeriod: 1m
exchanges: [{"eid":"Futures_Binance","currency":"BTC_USDT"}]
*/

// This source code is subject to the terms of the Mozilla Public License 2.0 at https://mozilla.org/MPL/2.0/
// © stocktechbot
//@version=5
strategy("Linear Cross", overlay=true, margin_long=100, margin_short=0)- 1