Interactive Model Based Candlestick Trading Strategy

Overview
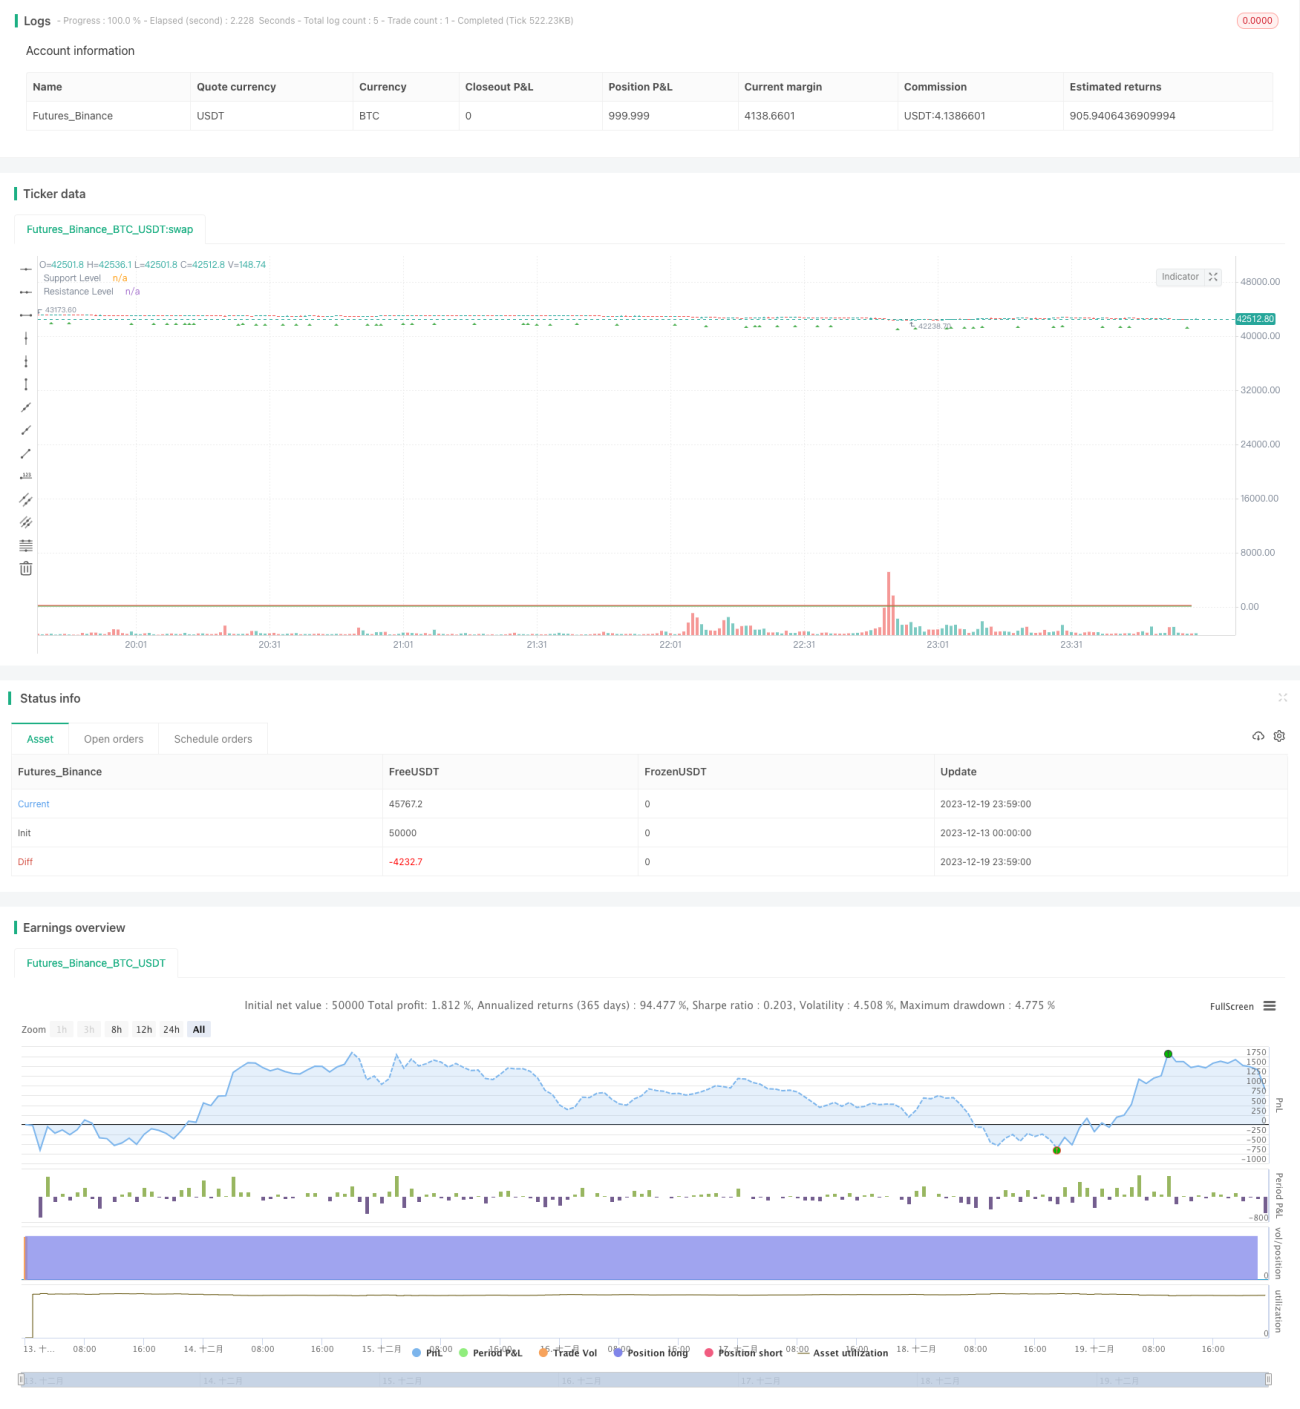
This strategy generates buy and sell signals based on candlestick patterns and interactive models. It mainly utilizes breakouts of support and resistance levels along with certain candlestick formations to assist in decision making.
Strategy Logic
The strategy primarily identifies the following candlestick patterns:
- Bullish Marubozu: Close higher than open with short real body
- Inverted Hammer: Open near high and close near low
- Doji Star: Previous candle crosses current doji candle
In conjunction with pattern recognition, support and resistance levels are set. The specific logic is:
- When a Bullish Marubozu appears above resistance level, a buy signal is generated
- When an Inverted Hammer appears below support level, a sell signal is triggered
This combination filtering helps avoid false signals and makes the trading decisions more reliable.
Advantage Analysis
The advantages of this strategy are:
- Combines chart patterns and indicators for more robust signals
- Support/Resistance levels avoid unnecessary whipsaws
- Candlestick patterns are simple to understand and implement
- Customizable parameters suit different market environments
Overall, the strategy is relatively simple and practical for testing ideas and assisting manual trading.
Risk Analysis
There are also some risks:
- Candlestick patterns can be misleading resulting in bad signals
- Poor support/resistance levels negatively impact performance
- Unable to handle black swan events and huge volatility
- Insufficient backtest data leading to overestimated results
Mitigations mainly involve strict parameter checking, support/resistance tuning, and incorporating stop losses to control risk. Additionally, extensive historical data backtesting is required to properly evaluate the actual strategy performance.
Enhancement Opportunities
Some ways the strategy can be enhanced:
- Incorporate more candlestick pattern detections for more trade signals
- Optimize support/resistance calculation methods to better fit market trends
- Add secondary indicators like moving average distance, volume changes to supplement decisions
- Introduce machine learning to autonomously determine chart pattern features
These improvements can help automate strategy tuning and make trade decisions more intelligent to handle increasingly complex markets.
Conclusion
Overall this is a simple, practical strategy well-suited for individual traders to test ideas and assist with decisions. Trading signals are generated by combining candlestick patterns and support/resistance analysis to effectively filter out false signals. With some enhancements, this strategy can become a relatively reliable quantitative system.
- 1