Inertia Indicator Trading Strategy

Overview
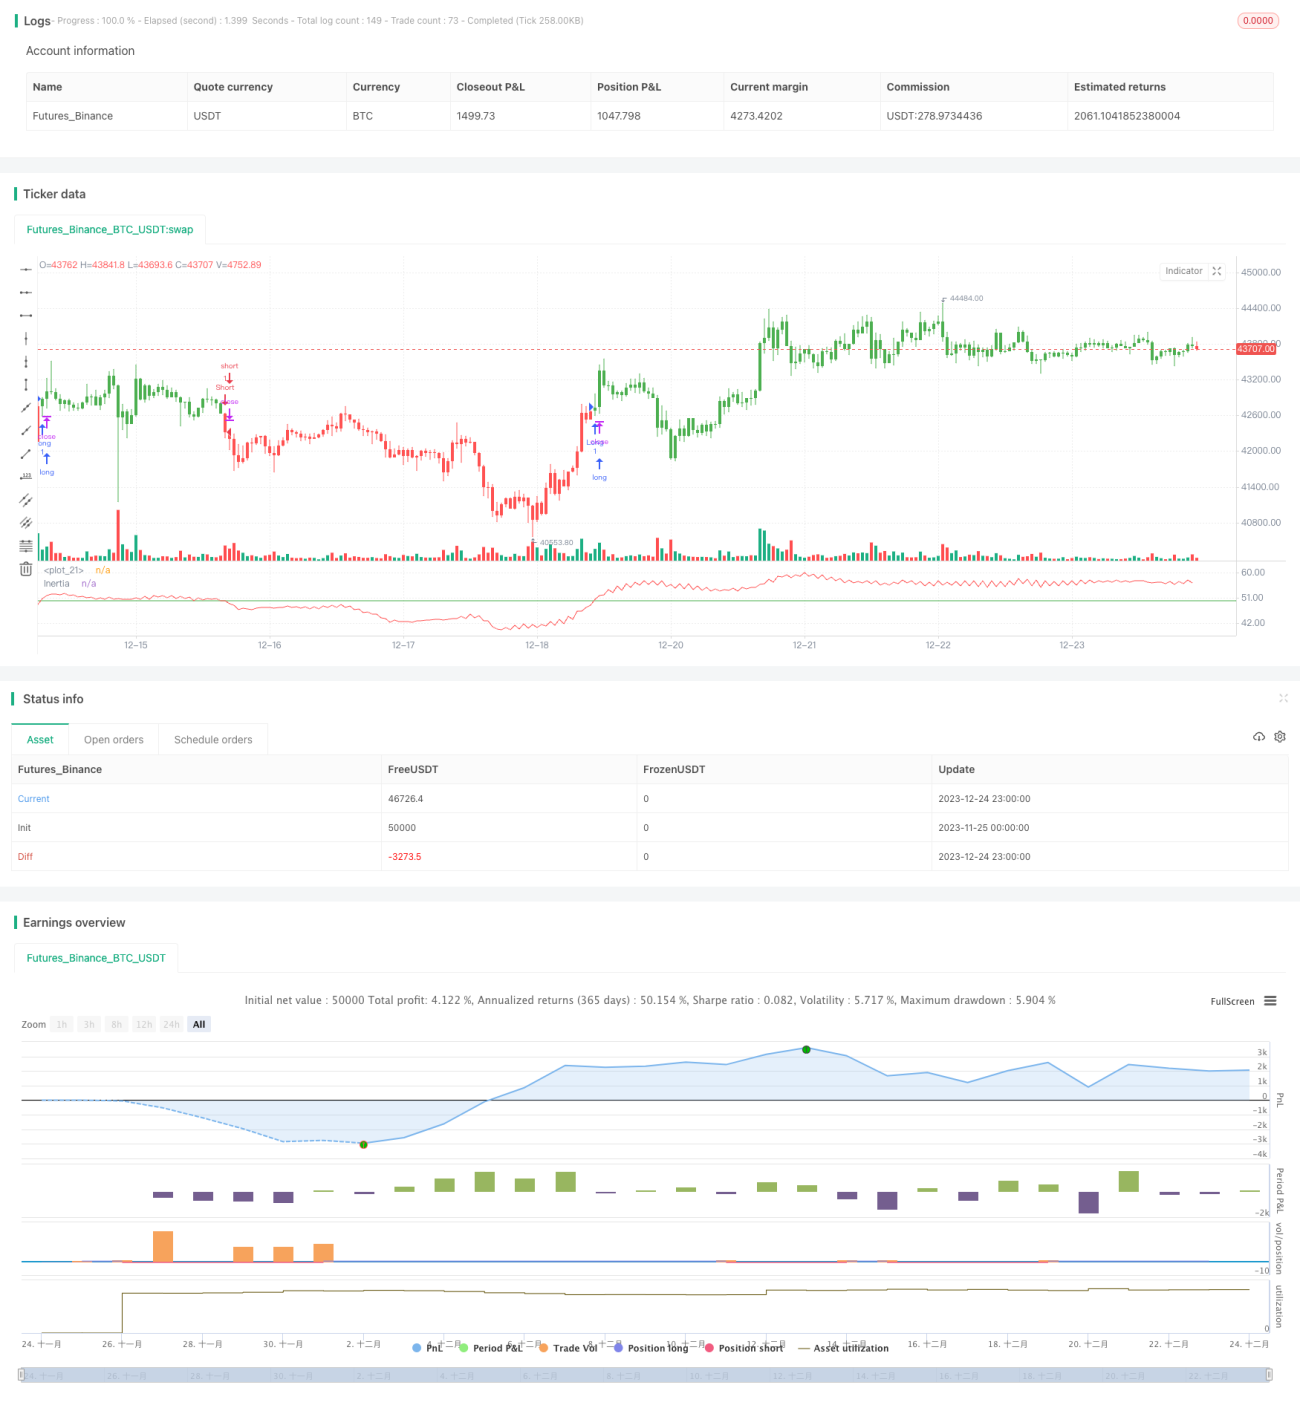
The inertia indicator trading strategy is a trend-following algorithmic trading strategy based on the Relative Volatility Index (RVI). It measures market, stock or currency pair momentum and trend by calculating the RVI of securities. It can determine the direction of long-term trends and generate trading signals.
Strategy Logic
The core indicator of this strategy is the Inertia Indicator. Its value ranges from 0 to 100. A reading above 50 represents positive inertia, while a reading below 50 represents negative inertia. As long as the inertia value stays above 50, it indicates an upward trend. And vice versa.
The calculation process is as follows:
- Calculate the standard deviation StdDev of closing prices for a given period
- Calculate the upward volatility u and downward volatility d based on the comparison between today's and yesterday's closing prices
- Smooth u and d to get indicators nU and nD
- Calculate Relative Volatility Index nRVI = 100 * nU / (nU + nD)
- Exponentially smooth nRVI to get the final inertia value nRes
If nRes is greater than 50, it generates a buy signal. If less than 50, it generates a sell signal.
Advantage Analysis
The biggest advantage of this strategy is that it can follow trends and avoid frequent opening during market consolidation. In addition, the simple indicator calculation requires less computing resources, making it suitable for algorithmic trading.
Risk Analysis
The biggest risk is that the indicator itself has a lag and cannot capture turning points 100%. This may result in missing better opening opportunities. In addition, the parameter settings of the indicator also affect strategy performance and need a lot of backtesting to find the optimal parameters.
To reduce risks, consider combining with other technical or fundamental indicators to determine opening using more factors. At the same time, control the position sizing of each trade.
Optimization Directions
The strategy can be optimized in the following aspects:
-
Parameter optimization. Change the settings of cycle parameters and smoothing parameters to find the optimal parameter combination.
-
Combine with other indicators. Use with moving averages, RSI and other indicators for more informed decisions.
-
Dynamic position sizing. Dynamically adjust the position size of each trade based on market conditions and indicator values.
-
Automatic stop loss. Set stop loss positions to effectively control the maximum loss per trade.
Conclusion
The inertia indicator trading strategy is a relatively simple and reliable trend following strategy. It determines the price trend direction based on the inertia indicator and follows the trend to establish trading positions. By further enhancing strategy performance through parameter optimization, indicator combinations, it is an algorithmic strategy suitable for quantitative trading.
/*backtest
start: 2023-11-25 00:00:00
end: 2023-12-25 00:00:00
period: 1h
basePeriod: 15m
exchanges: [{"eid":"Futures_Binance","currency":"BTC_USDT"}]
*/

//@version=2
////////////////////////////////////////////////////////////
//  Copyright by HPotter v1.0 23/05/2017
// The inertia indicator measures the market, stock or currency pair momentum and - 1