Cross-Pair Bollinger Band Crossover Quantitative Strategy

Overview
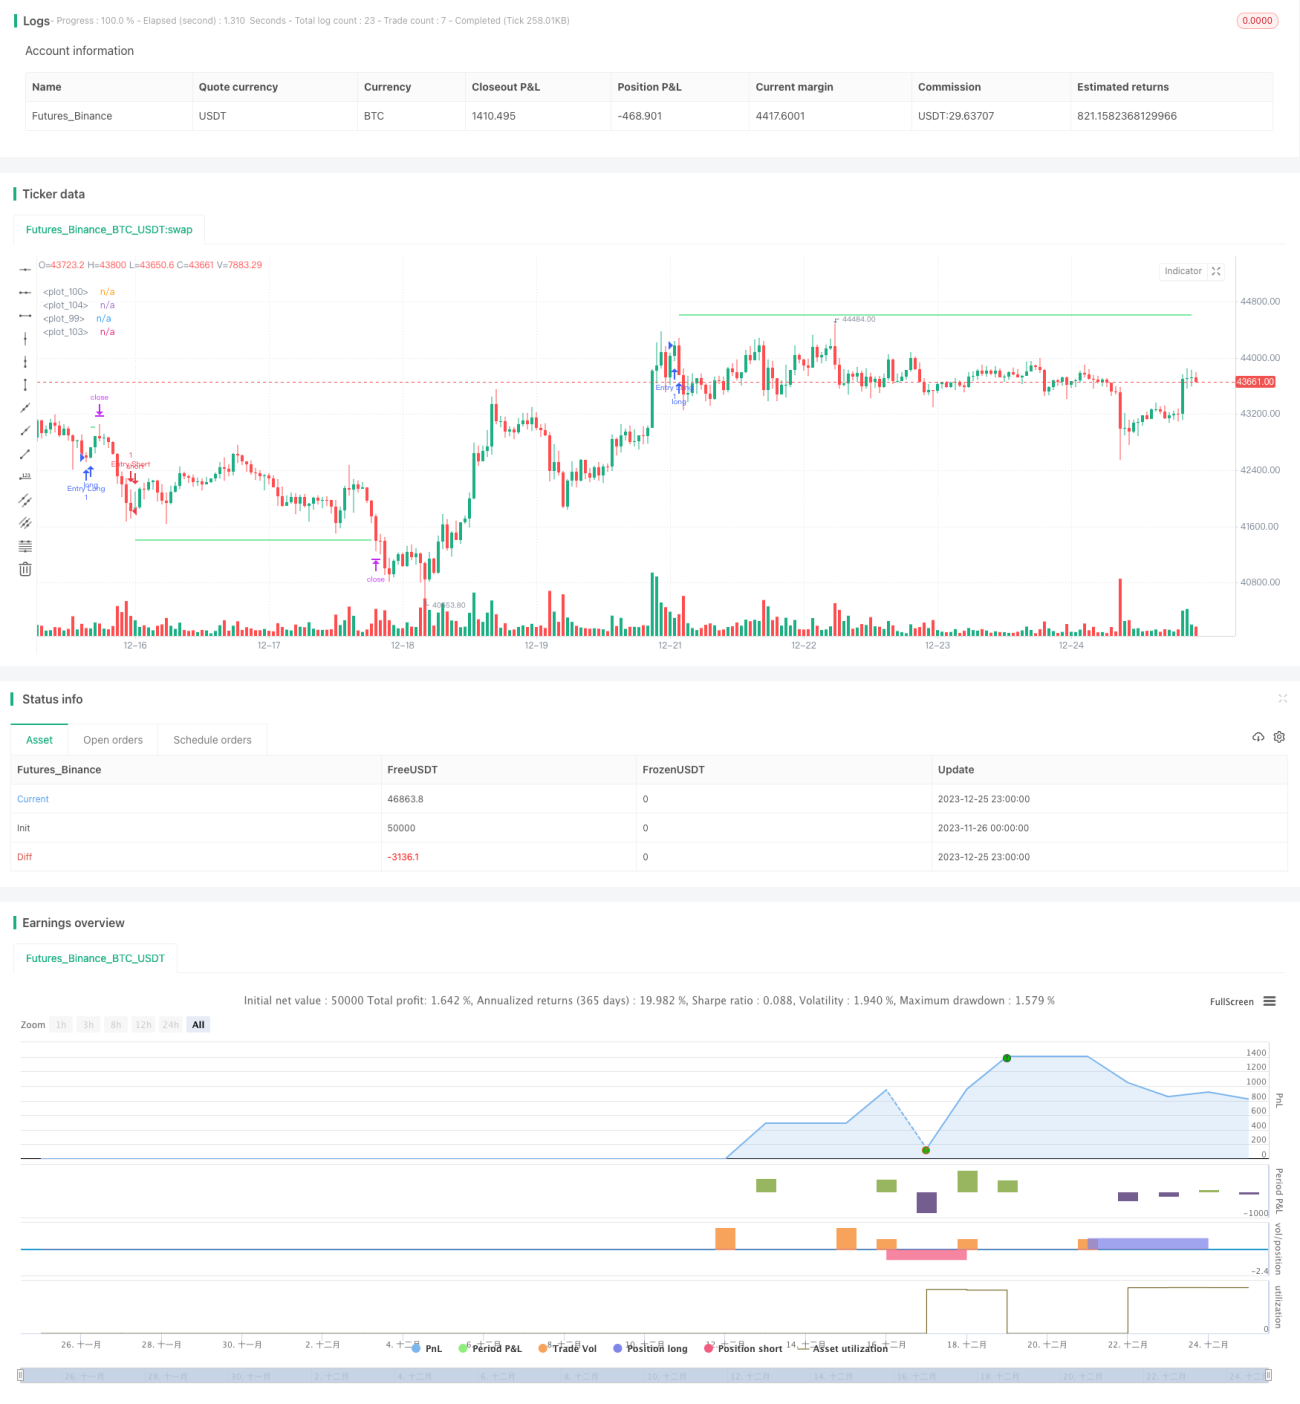
This strategy generates buy and sell signals by comparing the crossover of the MACD indicator's fast line and slow line. When a buy signal is generated, it will open a position with a certain percentage of the account equity. Additional positions will then be added at specific retracement points. When the accumulated profit of the positions reaches the configured take profit point, all positions will be closed. The logic for sell signals is similar to buy signals.
Strategy Logic
The core logic of this strategy is to compare the crossover of the MACD fast line and slow line to determine the trend. MACD is the difference between moving averages, by calculating the difference between short-term and long-term moving averages, it judges market trend and momentum. The crossover between the fast line and slow line is considered golden cross and death cross.
When the fast line crosses above the slow line, a golden cross is generated, indicating the market is in an upward trend, and the strategy will open long positions. When the fast line crosses below the slow line, a death cross is generated, indicating a downward trend, and the strategy will open short positions.
After opening positions, the strategy will add to existing long or short positions at specific retracement points. This can increase profit potential through the Martingale principle. When the accumulated profit reaches the configured take profit point, the strategy will close all positions.
Advantage Analysis
This strategy has the following advantages:
-
Uses the MACD indicator to determine market trend, which is a classic and reliable technical analysis indicator.
-
Adopts the approach of opening positions in batches, which can control the risk of a single trade.
-
Adding to positions can expand profit potential through the Martingale principle.
-
Configuring take profit point to limit losses.
Risk Analysis
This strategy also has some risks:
-
The MACD indicator cannot perfectly predict market movements, false signals may occur.
-
There is risk that retracement will expand with full position adding. Can appropriately adjust the percentage of each position added.
-
Setting take profit point too small may limit profit potential. Can adjust for different products.
-
Need to configure reasonable percentage of capital for opening positions per product to avoid exceeding account limits.
Optimization Directions
This strategy can be optimized in the following aspects:
-
Test MACD parameters, find parameters that fit better for specific trading products.
-
Optimize money percentage and retracement percentage for each position added, find optimum parameter combinations.
-
Test long-term and short-term take profit points respectively to determine optimal levels.
-
Evaluate account’s margin capability, set reasonable maximum position limit per product.
-
Add stop loss logic. Stop loss can effectively control losses when drastic market change occurs.
Summary
In summary, this is a typical trend following strategy. It uses MACD indicator to determine market trend direction, takes the approach of adding positions in batches to follow the trend, and takes profit when accumulated profit reaches a certain level. This simple and practical strategy is easy to implement and suitable for quantitative trading beginners. By optimizing parameters and expanding risk control logic, the strategy can become more robust.
- 1