Fibonacci HMA AI Buy Sell Signal Strategy

Overview
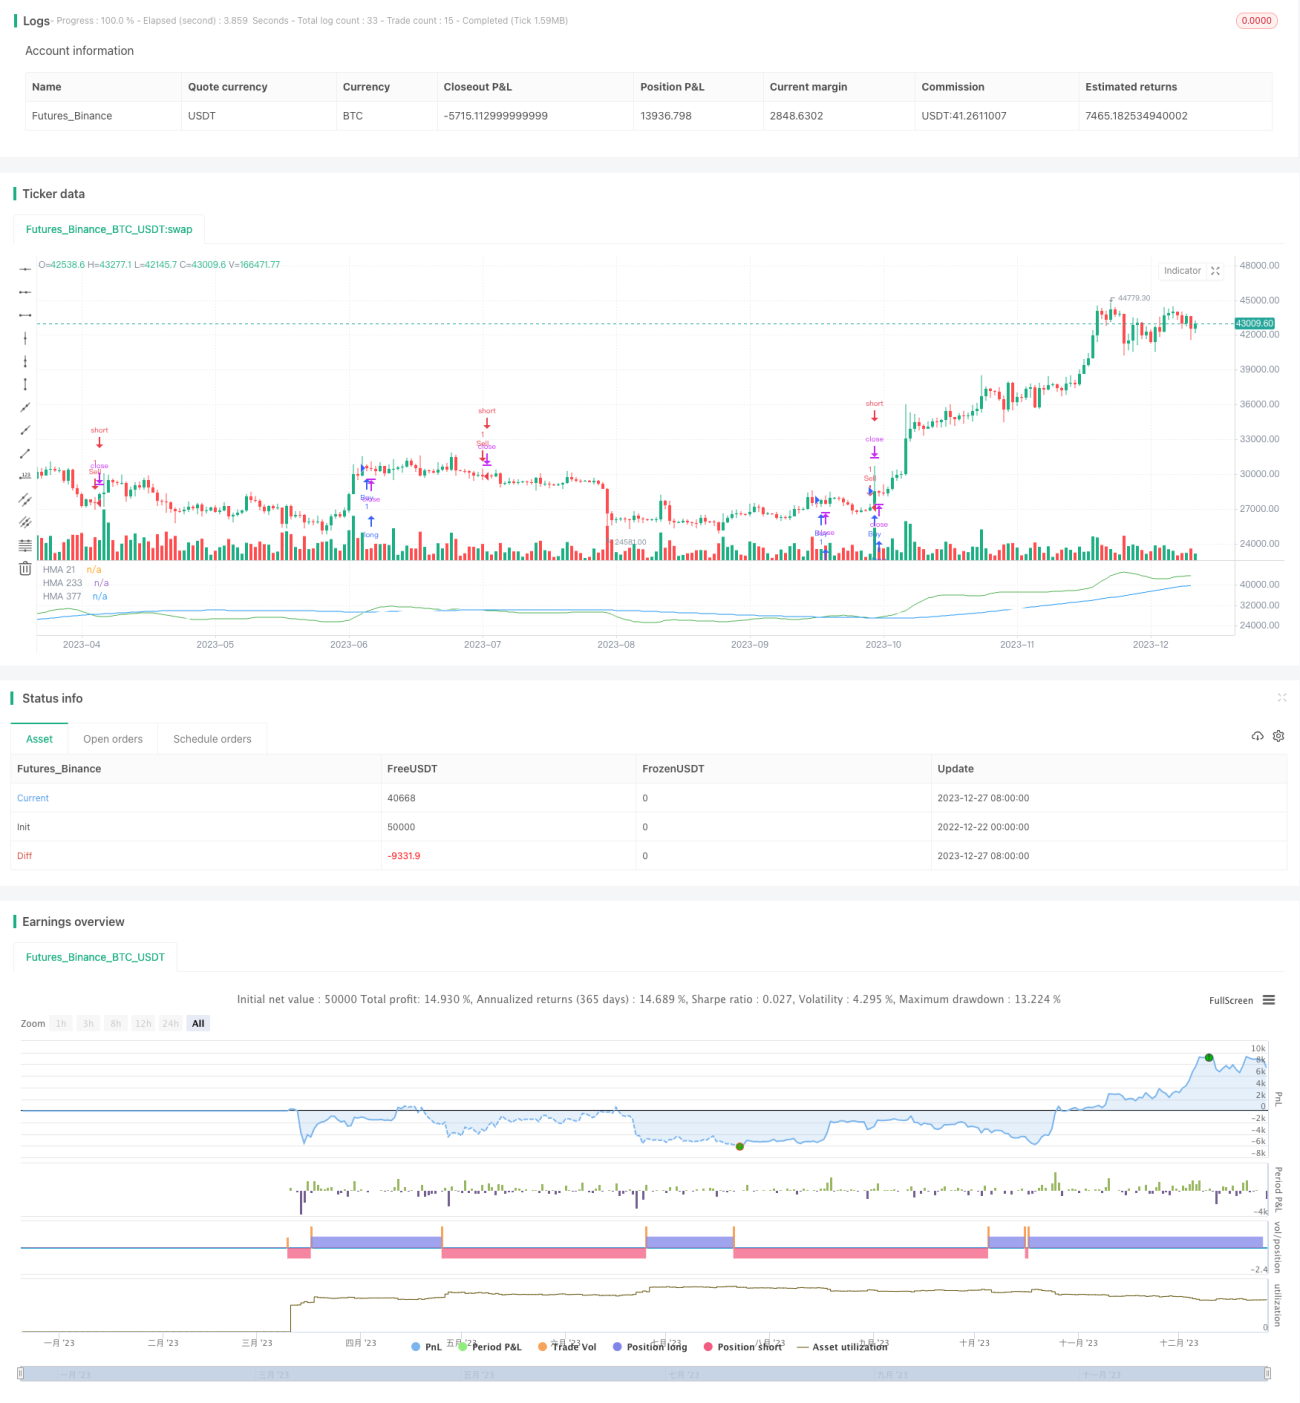
This strategy introduces a trading approach leveraging Fibonacci-based Hull Moving Averages (HMA) aimed at identifying potential buy and sell signals. By employing distinct HMA lines associated with Fibonacci numbers, it seeks to provide insights into entry and exit points within the trading landscape.
Strategy Logic
The strategy utilizes specific HMA lines linked to the Fibonacci numbers 1, 2, and 3, denoted as HMA 1, HMA 2, and HMA 3. When these HMA lines cross each other, automatic buy and sell signals are generated. For instance, a buy signal is triggered when HMA 3 crosses above HMA 2, while a sell signal occurs when HMA 3 crosses below HMA 2. These HMA lines are visually distinguished by colors to facilitate spotting trading opportunities.
Advantage Analysis
This strategy combines the strengths of Fibonacci analysis and Hull Moving Averages. Fibonacci analysis helps identify key support and resistance levels, while HMA lines smooth out price data and generate more reliable trading signals. Additionally, the simplified visualization makes determining the start and end of trends straightforward.
Risk Analysis
The strategy may produce false signals during periods of price whipsaws. Improper parameter settings can also impact performance. The periods of the HMA lines need adjusting to suit different market environments.
Optimization Directions
Consider adding other indicators like RSI for signal filtration to avoid false signals. Backtesting various parameter combinations to find optimal settings is also worthwhile. Combining this strategy with other trading systems is another enhancement possibility.
Summary
This strategy aptly utilizes the efficacy of Fibonacci analysis in financial markets and combines it with the signal filtering capacity of HMA to form an effective instrument for uncovering potential trends. Simple and intuitive, it warrants further testing and refinements.
- 1