RSI Indicator Improvement Trading Strategy

1. Strategy Overview
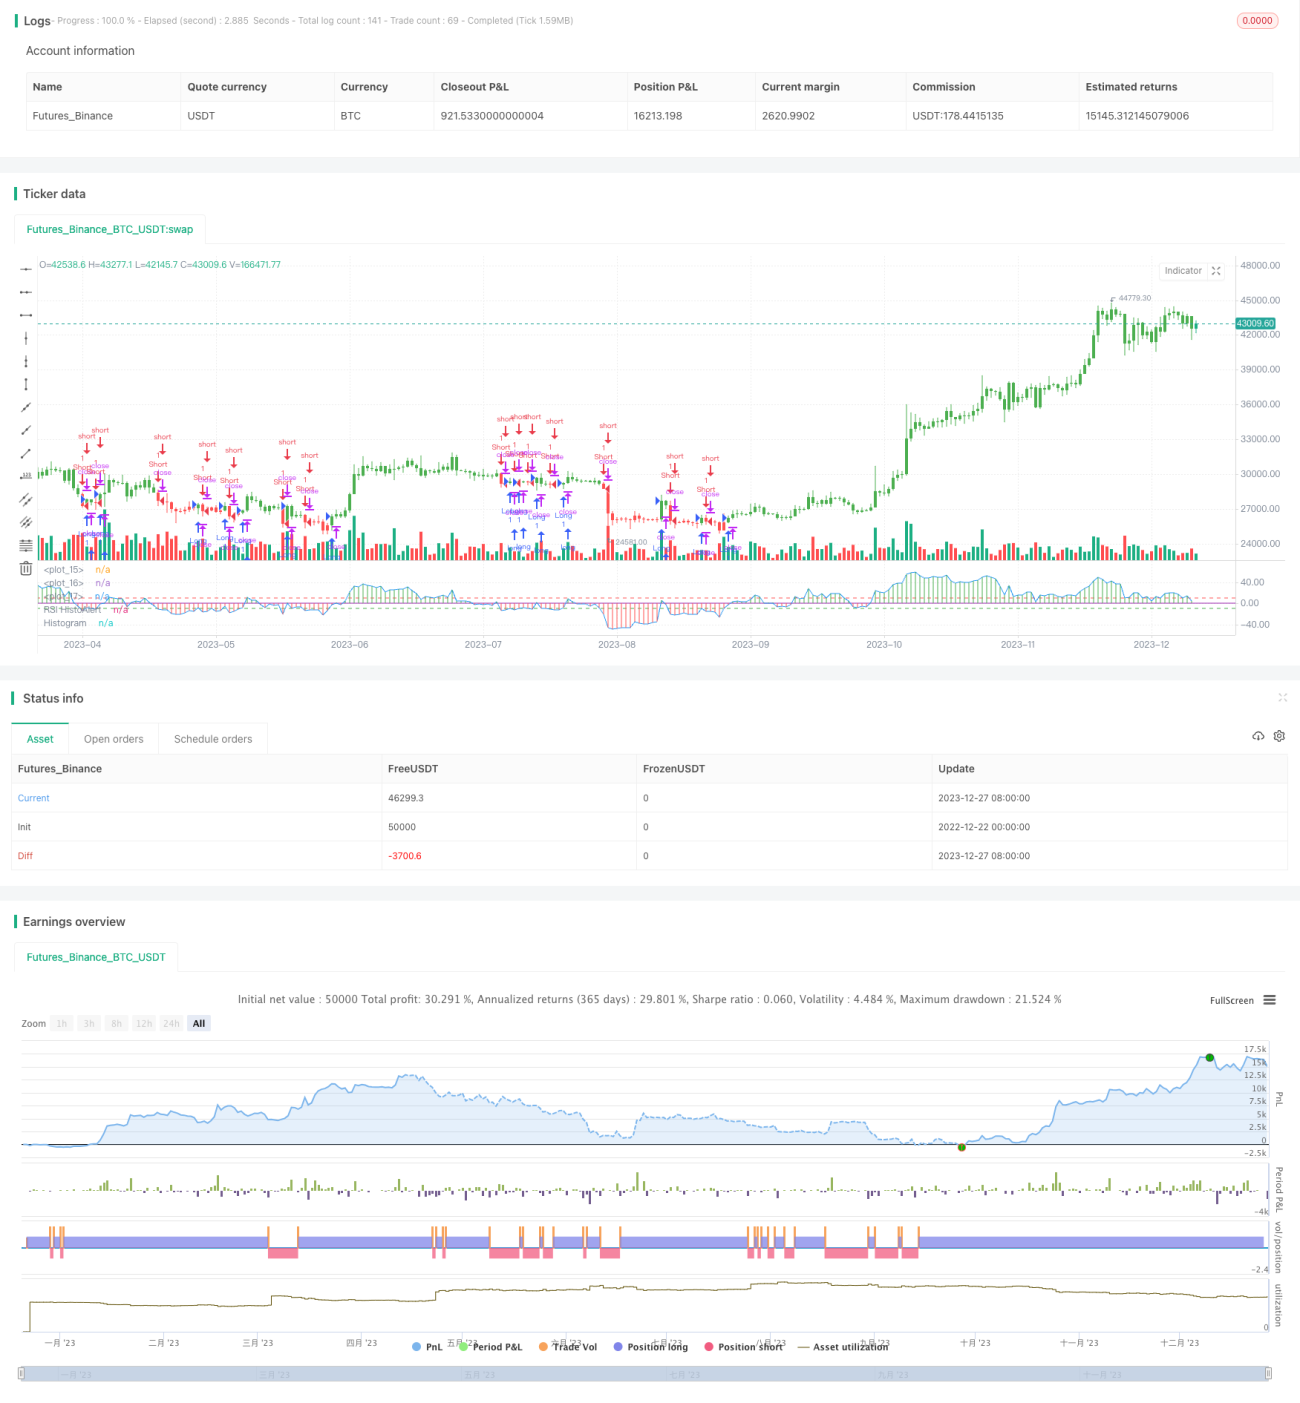
This strategy improves the classic RSI indicator by setting buy and sell alert lines. When the RSI indicator breaks through the alert lines, corresponding buy or sell operations are performed. At the same time, the strategy also provides long and short position switching capability.
2. Strategy Details
1. Strategy Name: RSI Histogram Alert Strategy
This strategy triggers buy and sell signals through the RSI indicator's Histogram.
2. Strategy Principle
(1) Calculate the value of the RSI indicator:
RSIMain = (rsi(xPrice, RSIPeriod) - 50) * RSIHistoModify
where xPrice is the price series, RSIPeriod is the parameter for calculating RSI, and RSIHistoModify is a scaling factor for the RSI value.
(2) Set the buy alert line BuyAlertLevel and the sell alert line SellAlertLevel. When the RSI indicator is above the buy alert line, it is a buy signal. When it is below the sell alert line, it is a sell signal.
(3) Plot the Histogram of the RSI indicator to visualize buy and sell signals.
(4) Set position pos. When a signal is triggered, set pos to 1 (long) or -1 (short). Positive or reverse trading can be selected.
(5) Determine entry direction and price based on the value of pos.
3. Advantages of the Strategy
(1) Improves the way the RSI indicator is used and more clearly shows buy and sell signals.
(2) Customizable parameters to adjust the RSI indicator and alert lines to suit different markets.
(3) Intuitive display of buy and sell signals Histogram.
(4) Ability to choose positive or reverse trading.
(5) The strategy idea is simple and clear, easy to understand and modify.
4. Risks of the Strategy
(1) Prone to generating false signals. The RSI indicator itself tends to generate false signals.
(2) No consideration of stop loss, with the risk of huge losses.
(3) Improper parameter settings can also lead to failure.
5. Directions for Strategy Optimization
(1) Combine with other indicators to filter out false signals, e.g. considering trading volume breakouts.
(2) Set up stop loss mechanisms.
(3) Parameter optimization to find optimum parameters.
(4) Consider combining with machine learning to automatically find optimal parameters using algorithms.
3. Summary
This strategy expresses buy and sell signals more clearly and intuitively by improving the use of the RSI indicator and setting buy and sell alert lines. It has stronger practicality compared to the original RSI indicator. But there are also certain risks. Further optimizations are needed, e.g. combining other technical indicators and stop loss to reduce risks. The strategy idea is simple, suitable for beginners in quantitative trading to learn and practice.
/*backtest
start: 2022-12-22 00:00:00
end: 2023-12-28 00:00:00
period: 1d
basePeriod: 1h
exchanges: [{"eid":"Futures_Binance","currency":"BTC_USDT"}]
*/

//@version=2
////////////////////////////////////////////////////////////
//  Copyright by HPotter v1.0 22/12/2016
// This simple indicator modified RSI- 1