Dual Moving Average Bollinger Band MACD Trading Strategy

Overview
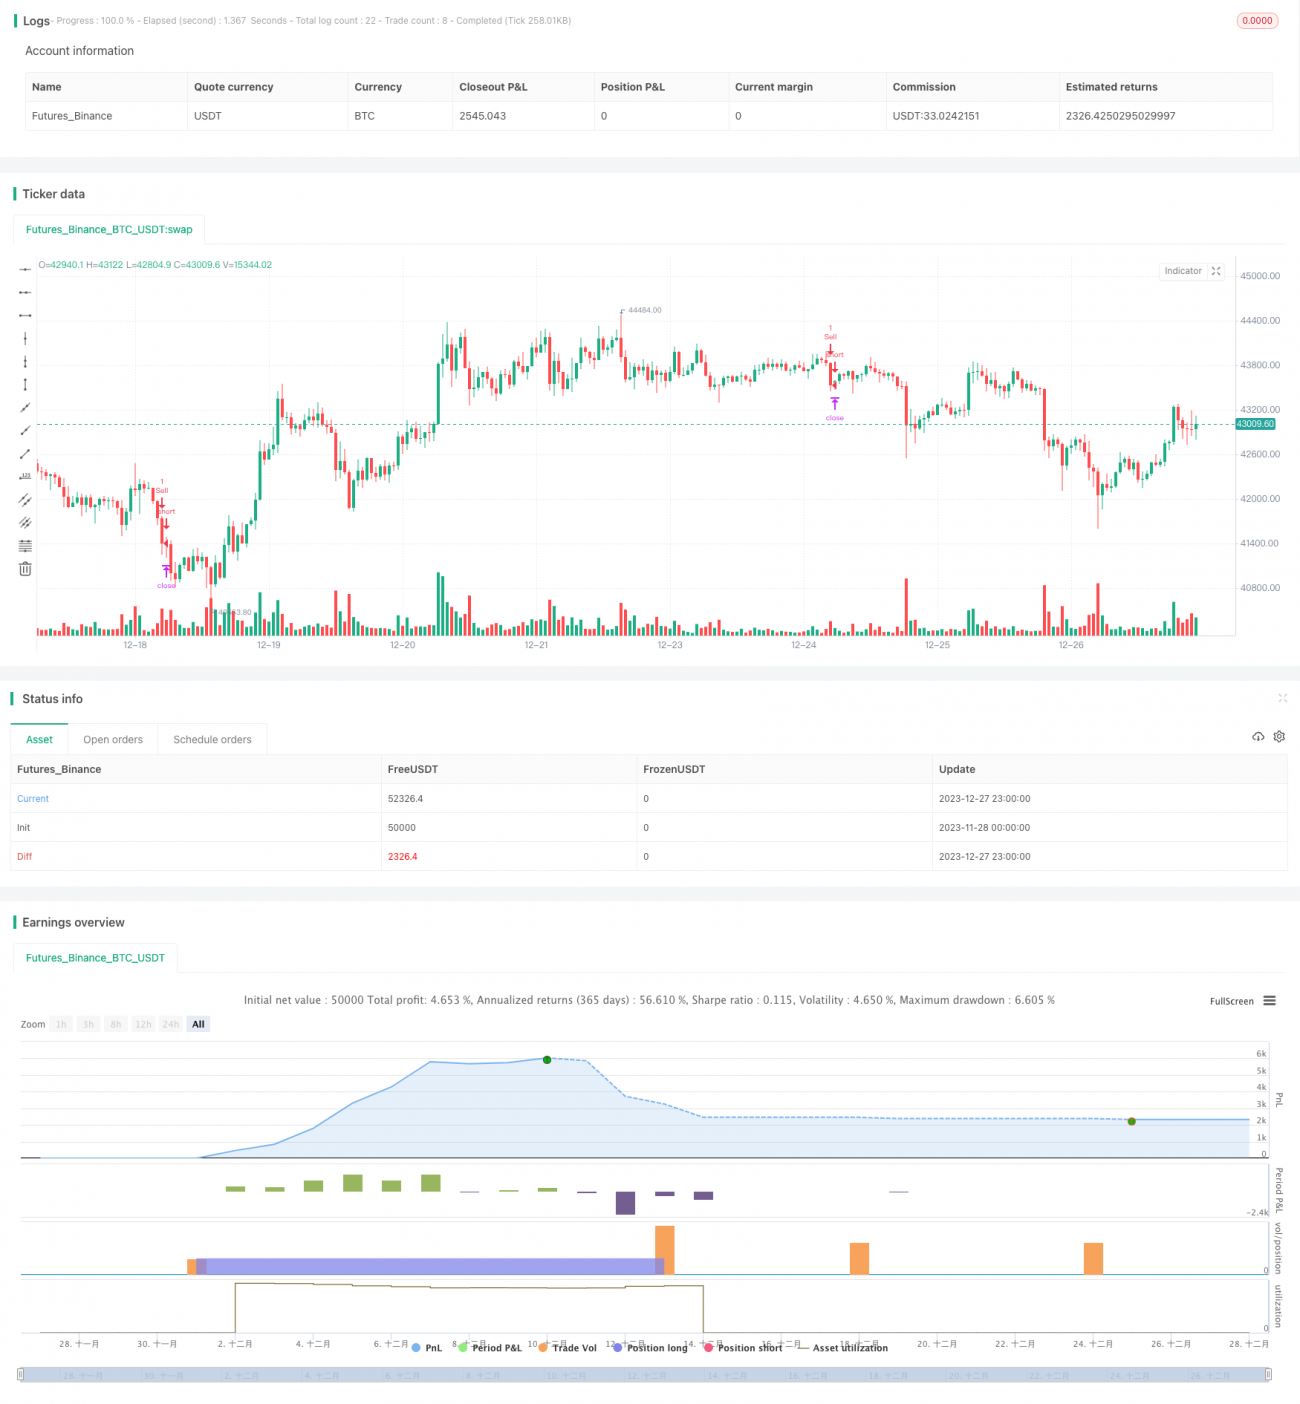
This strategy combines dual moving averages, Bollinger bands and the MACD indicator to set buy and sell conditions for trading the Bank Nifty index on a 5-minute timeframe. It goes long when the MACD line crosses above the signal line and the closing price breaks above the Bollinger band upper line, and goes short when the MACD line crosses below the signal line and the closing price falls below the Bollinger band lower line. By integrating the advantages of multiple indicators, this strategy can identify trends and locate extremum points for efficient trading.
Trading Logic
- Set MACD parameters: Fast length 12, Slow length 26, Signal length 9
- Calculate MACD value: Fast line - Slow line
- Set Bollinger band parameters: Middle band period 20, Standard deviation multiplier 2
- Calculate Bollinger band upper and lower lines: Middle band ± Standard deviation * Multiplier
- Buy condition: MACD line crosses above signal line (golden cross) and close > Upper band
- Sell condition: MACD line crosses below signal line (dead cross) and close < Lower band
- Set take profit and stop loss
- Enter long position: when buy condition holds
- Close long position: take profit or stop loss
- Enter short position: when sell condition holds
- Close short position: take profit or stop loss
The above summarizes the overall trading logic of this strategy.
Advantage Analysis
This is a very practical trend-following strategy with the advantages below:
- MACD identifies trend direction and momentum
- Bollinger band determines overbought and oversold zones, complementing MACD
- Dual moving averages improve judgment accuracy
- Combining multiple indicators improves reliability
- Implementing take profit and stop loss manages risks
- Adjustable parameters adapt to changing market dynamics
In summary, this strategy leverages the strengths of various indicators for accurate judgments and disciplined execution, making it a reliable and controllable trend trading system.
Risk Analysis
Despite its merits, this strategy has certain risks to note:
- Violent market swings may penetrate stops
- Multiple parameters combinations increase misjudgment risks
- High trading frequency from short-term operations increases costs
- Suboptimal parameter tuning fails to capture best entry/exit points
The solutions are:
- Strict stop loss controls single trade loss
- Optimize parameters to improve judgment accuracy
- Adjust timeframe to reduce trade frequency
- Backtest to find optimal parameter combinations
Enhancement Opportunities
There is room for improving this strategy:
- Utilize machine learning to find optimum parameters
- Incorporate adaptive techniques to auto tune parameters
- Integrate more indicators e.g. momentum, volatility metrics
- Add position sizing module to adjust by capital, risk
- Innovate signal rules with custom indicators or formulae
Overall, this strategy has a robust framework. Further refinements via parameter optimization, indicator innovation, adaptive mechanisms etc. can transform it into an even more powerful and consistent system.
Conclusion
This dual moving average Bollinger MACD strategy effectively identifies entry and exit points by combining trend identification and extremum detection. With disciplined execution, configurable risk controls and optimization potential, this is an efficient and consistent trading approach. As continued innovations enhance its capabilities, this strategy provides investors a valuable tool for achieving steady and manageable profits in financial markets.
- 1