Quantitative Trading Strategy Combining RSI, MACD and Support/Resistance

Overview
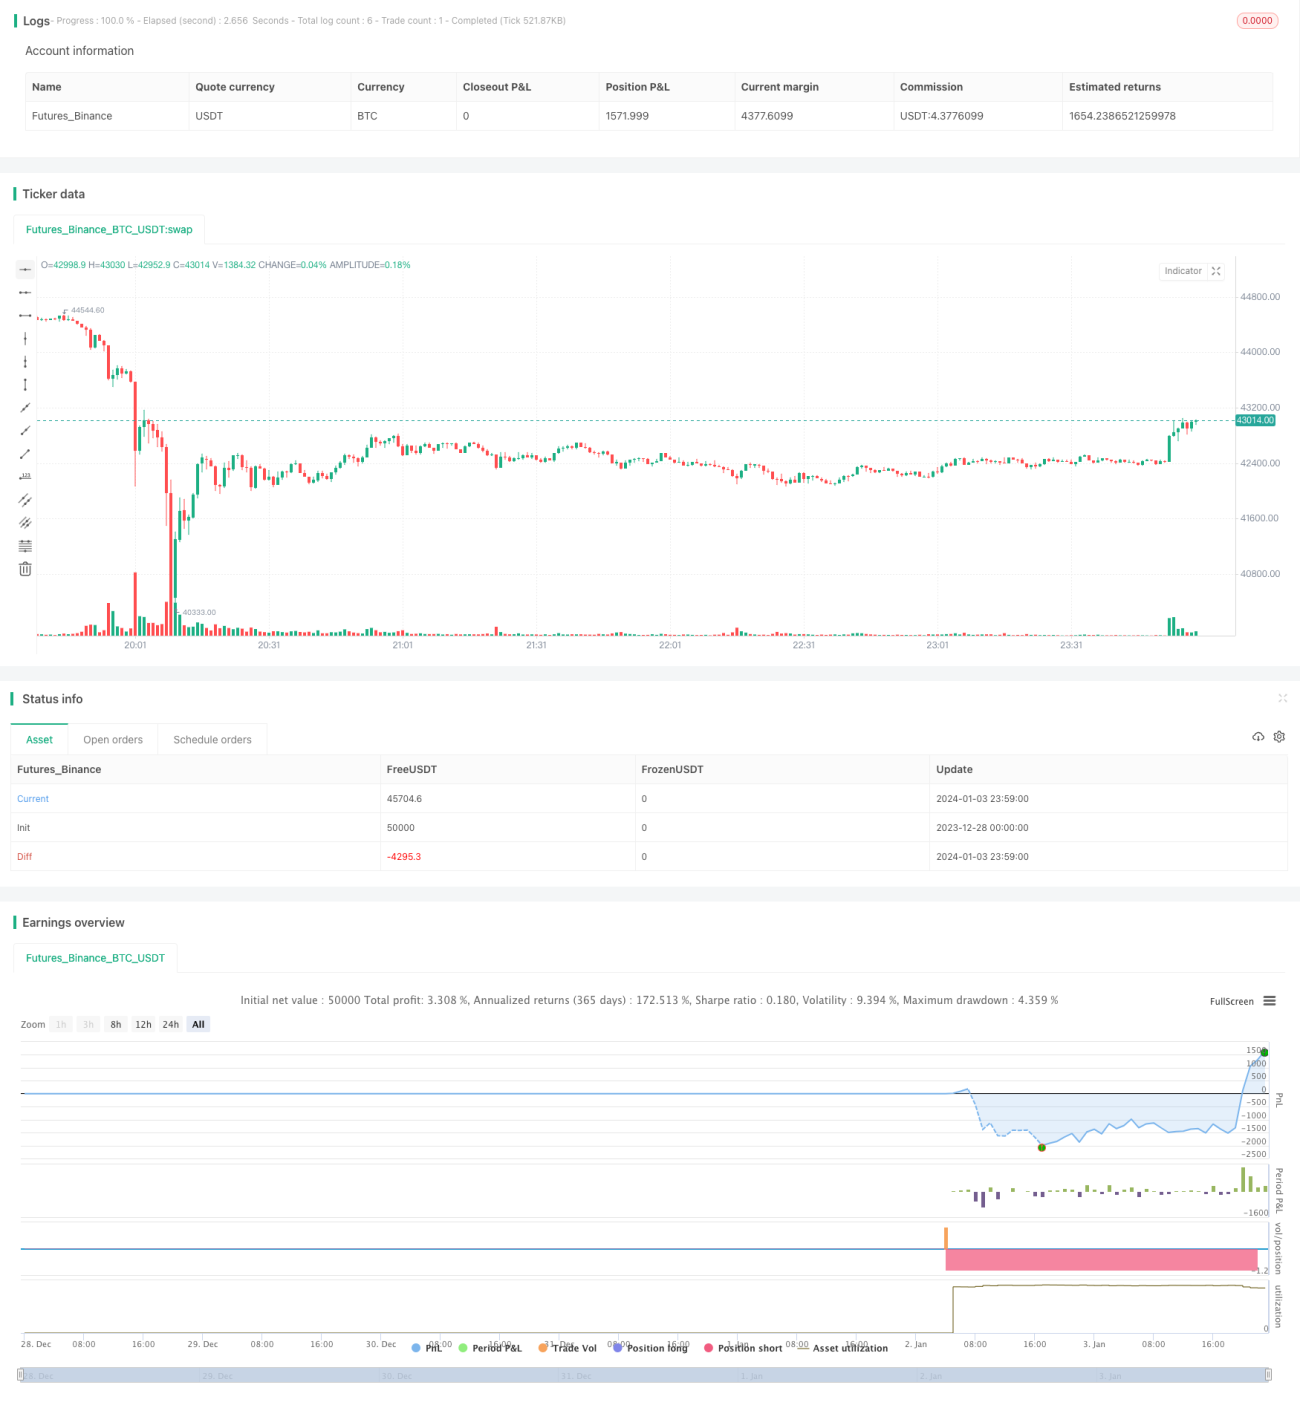
This strategy is based on the RSI and MACD indicators, combined with support/resistance levels for trade signal judgment. Its name is "Panda Sticking Out Tongue" strategy. The strategy uses the RSI indicator to determine overbought/oversold levels, the MACD indicator to determine bullish/bearish trends, and draws support/resistance levels based on the highest and lowest prices over the past 100 periods, generating buy signals near support and sell signals near resistance. It belongs to a common trend-following strategy.
Strategy Logic
The strategy mainly relies on two indicators - RSI and MACD. The RSI indicator judges overbought/oversold statuses, while the MACD indicator determines bullish/bearish trend statuses. It first calculates the 14-period RSI value, and sets the overbought threshold as 70 and oversold threshold as 30. Then it calculates the MACD value based on 12-day fast line, 26-day slow line, and 9-day signal line. RSI below 30 is considered oversold; RSI above 70 is considered overbought. MACD golden cross is the buy signal while death cross is the sell signal.
In addition, the strategy also calculates the highest and lowest prices over the past 100 periods as the support/resistance levels. When a buy signal is triggered, the price needs to be close to the support level, i.e. within 1% of the support level, to actually issue a buy order. Similarly when a sell signal is triggered, the price needs to be within 1% below the resistance level to actually issue a sell order.
Advantages of the Strategy
The strategy combines trend analysis and overbought/oversold level detection to avoid false signals relying on single indicator only. By introducing support/resistance filter, it can reduce wrong trades due to rebounds near key S/R levels. The combination of MACD and RSI can accurately identify price movements and OB/OS statuses. Compared to simple Moving Average strategies, this strategy can capture long-term price trends more flexibly.
Risks of the Strategy
The main risks of this strategy includes:
-
It may miss most profits in strong trends, as it tends to enter after reversal finishes.
-
Inappropriate RSI and MACD parameter settings may cause wrong signals.
-
Simple S/R detection logic may overestimate or underestimate actual S/R zones.
-
Lack of stop loss mechanism. Unable to effectively control losses in extreme market conditions.
To address these risks, methods like adaptive MACD, optimized RSI parameters tuning, improved S/R identification, market regime modeling etc. can be used to improve the strategy.
Directions for Enhancement
The strategy can be enhanced from the following dimensions:
-
Introduce stop loss mechanisms e.g. CANVAS stop loss
-
Use adaptive MACD for dynamic parameter tuning
-
Introduce price pattern recognition for more scientific S/R identification
-
Incorporate more data to establish market state detection logic for using different parameters adaptively
-
Use machine learning algorithms to optimize the strategy end-to-end
Through these improvements, we can further reduce drawdown and improve stability of the strategy.
Conclusion
The strategy integrates RSI and MACD indicators to determine OB/OS statuses, and trade around support/resistance levels, representing a trend-following approach. By incorporating support/resistance filter, the risk is reduced. The advantage lies in stable signals and controllable risk suitable for long-term holding. Still some components e.g. indicator parameters, S/R range can be further tuned to improve profitability. Overall it shows good performance in following market trends with easy implementation and risk control.
- 1