RSI and Bollinger Bands Profitable Strategy

Overview
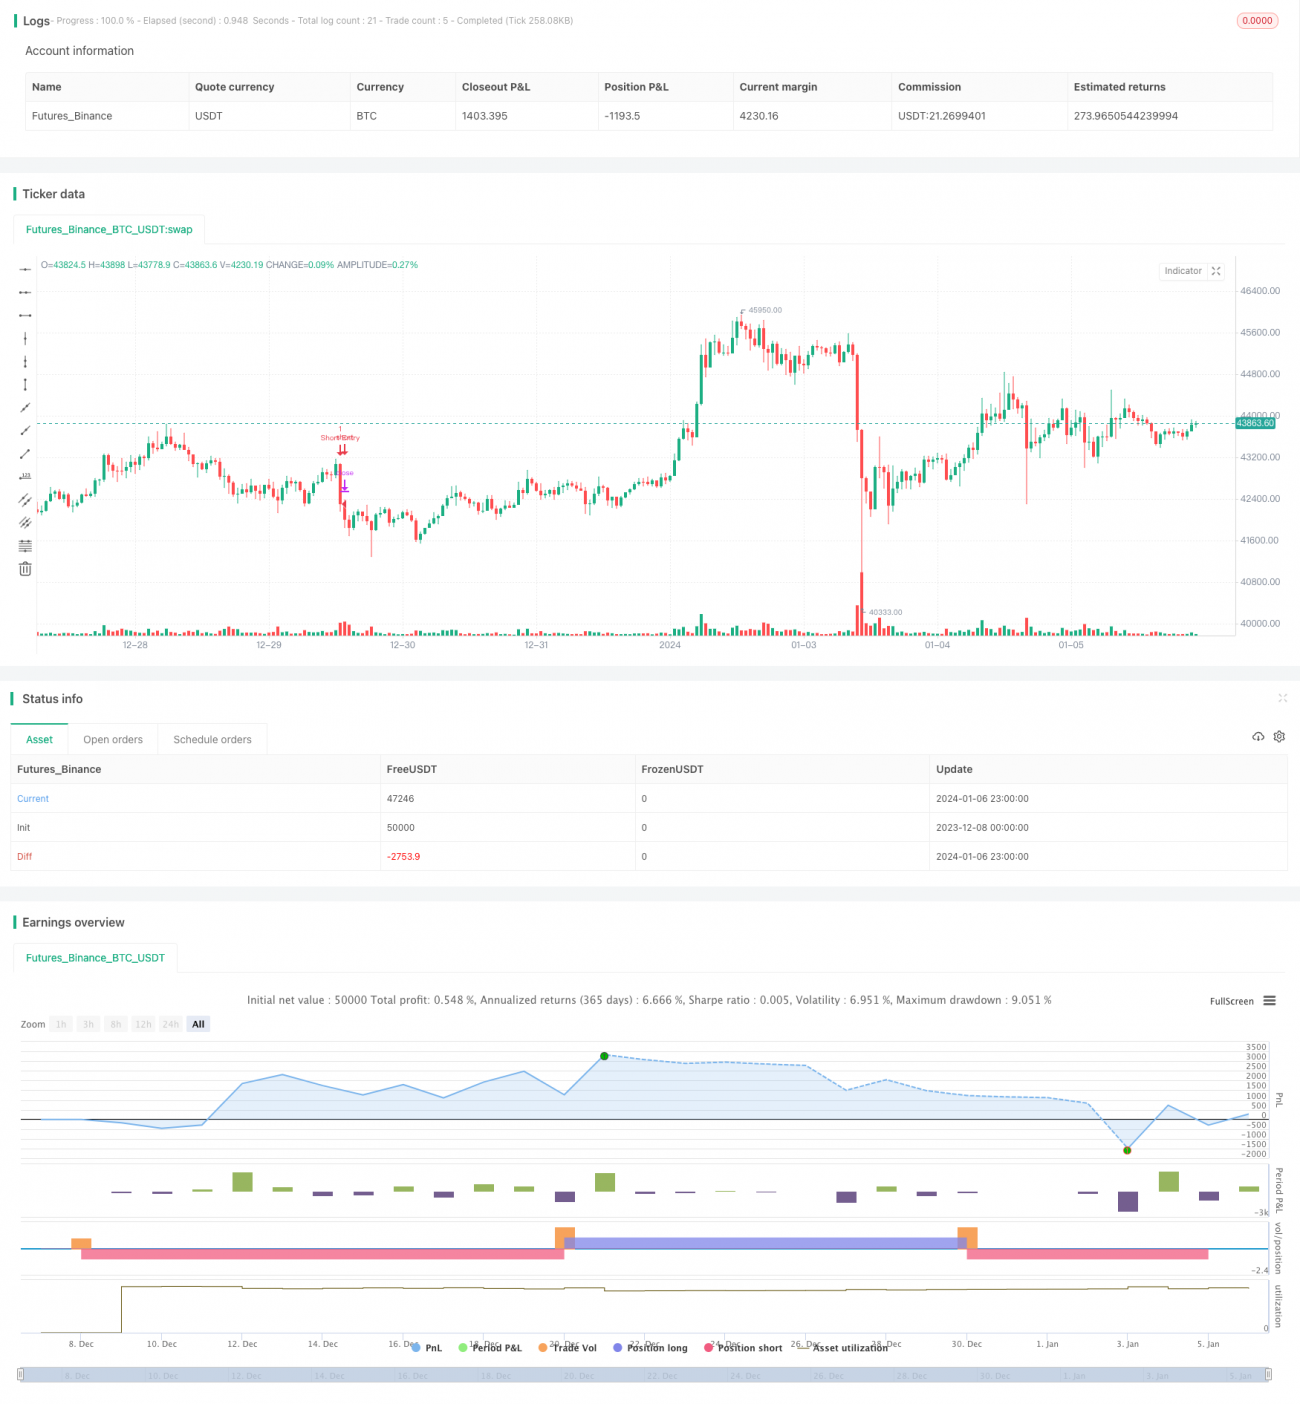
This strategy mainly uses the RSI indicator and Bollinger Bands to design trading rules and make profits in trending markets. It goes long when RSI is below overbought line and price is near the Bollinger Bands lower band; it goes short when RSI is above oversold line and price is near the upper band. This is the basic trading logic.
Strategy Logic
The strategy uses RSI indicator to identify overbought and oversold levels. RSI below the overbought threshold is considered oversold signal, while above oversold threshold is overbought signal. Bollinger Bands indicator is used to detect price breakouts. Upward breakout of the lower band is long signal, while downward breakout of upper band is short signal.
The strategy combines RSI for gauging market sentiment and Bollinger Bands for detecting price breakout. Trades are opened only when both conditions are met simultaneously. This helps filter out fake signals and improves strategy performance.
Strengths
The strategy combines RSI and Bollinger Bands, which helps better determine market trend and capture momentum. Compared to single indicator strategies, it filters out more false signals and generates higher quality signals. RSI gauges overbought/oversold levels, while BB catches trend after the breakout. Together they work very effectively.
The strategy opens trades only when both RSI and BB give signals simultaneously. This avoids interference from fake signals. With stop loss in pace, risks can also be controlled when market turns around.
Risks Analysis
Although the strategy filters out some false signals, RSI and BB may still give out wrong signals simultaneously in ranging markets, causing unnecessary losses. Inappropriate parameter settings may also lead to poor strategy performance.
It's recommended to optimize parameters through backtesting to find the best parameter combination. Also, consider pausing trading in ranging markets to avoid unnecessary losses. In addition, use stop loss properly to control single trade loss.
Improvement Areas
The strategy can be improved in the following aspects:
-
Optimize RSI and BB parameters for best combination
-
Add other indicators as filter signals, like MACD, KD etc
-
Add breakthrough validation to avoid false breakouts
-
Adjust parameters or stop trading per different market conditions
-
Optimize stop loss for dynamic stop loss
Conclusion
The strategy combines RSI and Bollinger Bands to design trading rules. By only taking signals when both agree, fake signals can be filtered out effectively. Through parameter optimization, adding signal filters, stop loss optimization etc., this strategy can be constantly refined for more stable profits.
- 1