Support and Resistance Strategy with Volume Breakout and Trailing Stop Loss

Overview
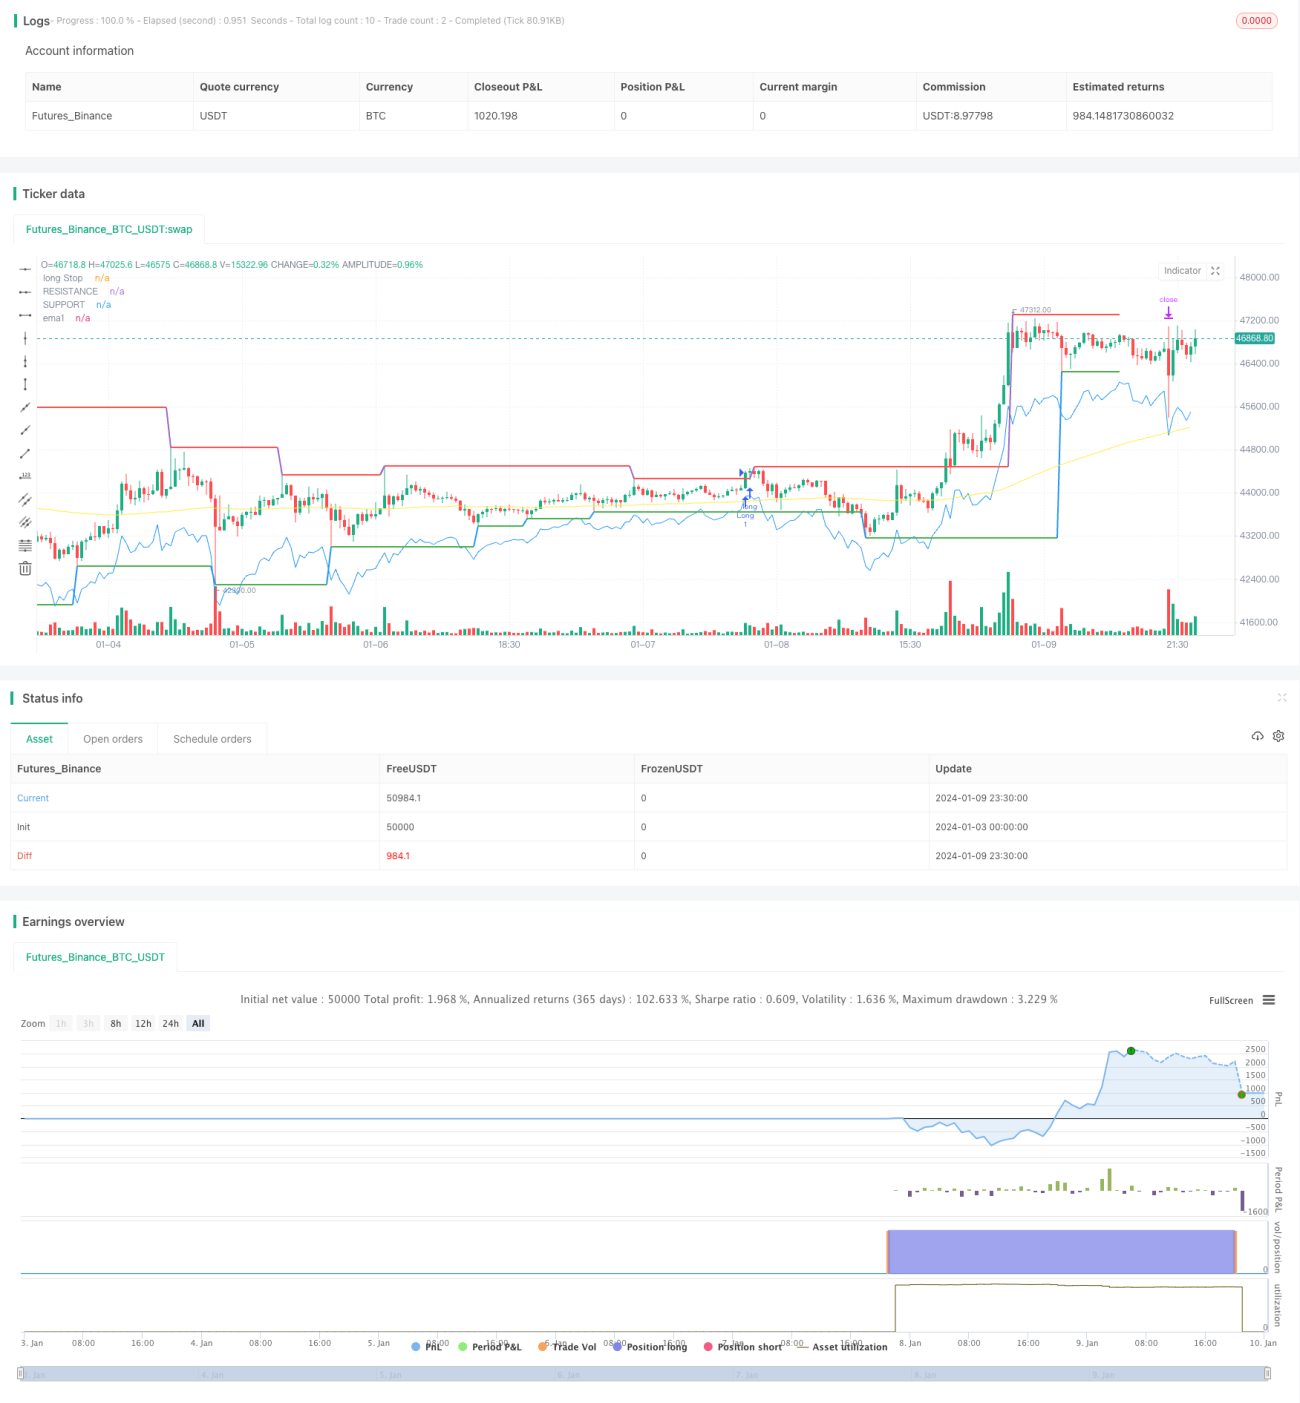
The main idea of this strategy is to combine support/resistance levels and volume breakouts to determine entry signals, and use the ATR indicator to dynamically adjust stop loss for profit taking, in order to capture more potential profits.
Strategy Logic
The strategy consists of the following main logics:
-
Use ta.pivothigh and ta.pivotlow to calculate the highest price of previous L_Bars candles and the lowest price of previous R_Bars candles, as resistance and support levels.
-
When close price crosses above resistance level and volume breaks above the volumeRange threshold, go long. When close price crosses below support level and volume breaks above the volumeRange threshold, go short.
-
After long entry, set stop loss at close-ATR_LO. After short entry, set stop loss at close+ATR_SH. This realizes dynamic trailing stop loss adjustment.
-
Only take the first signal within trading hours (0915-1445) each day. No new orders after reaching the daily risk limit defined by risk input.
Advantage Analysis
-
Use support/resistance theory combined with volume indicator to improve entry accuracy.
-
Trailing stop loss based on ATR can flexibly adjust stop level based on market volatility, lowering the chance of profit retracement.
-
Appropriate control over daily trade times and per trade risk helps to catch the trend and avoid excessive stop loss.
Risk Analysis
-
Support/resistance levels may fail and unable to provide effective entry signals.
-
ATR multiplier set too high may lead to stop loss being too far away, increasing loss risk.
-
Volume threshold set too low may miss opportunities, too high may cause false signals.
Solutions:
-
Adjust support/resistance parameters based on different products’ characteristics.
-
Optimize ATR multiplier and volume threshold parameters.
-
Add other indicators to confirm entry signals.
Optimization Directions
-
Add other indicators like moving averages to assist in determining entry signals.
-
Optimize parameters like ATR multiplier and volume threshold.
-
Use machine learning algorithms to realize dynamic parameter optimization.
-
Expand strategy to other products to find parameter patterns.
Summary
The strategy integrates various analytical tools, applying support/resistance, volume, and stop loss methods, and achieved good backtest results. But more uncertainties may exist in live trading, requiring further enhancements like parameter optimization and additional entry confirmation indicators to improve real-world performance. Overall, the strategy has clear logic and easy understanding, providing a good reference case for quantitative trading strategies.
/*backtest
start: 2024-01-03 00:00:00
end: 2024-01-10 00:00:00
period: 30m
basePeriod: 15m
exchanges: [{"eid":"Futures_Binance","currency":"BTC_USDT"}]
*/

//   ____________                _________                      _____________
//  |____________|             ||________|                      ||__________|
//       ||            ____    ||        ||                     ||                    ______ ________    _____ ________
// || | || || ||________|| | || || || || | || /\\ | // |______| || || |______|- 1