ADX Dynamic Trend Strategy

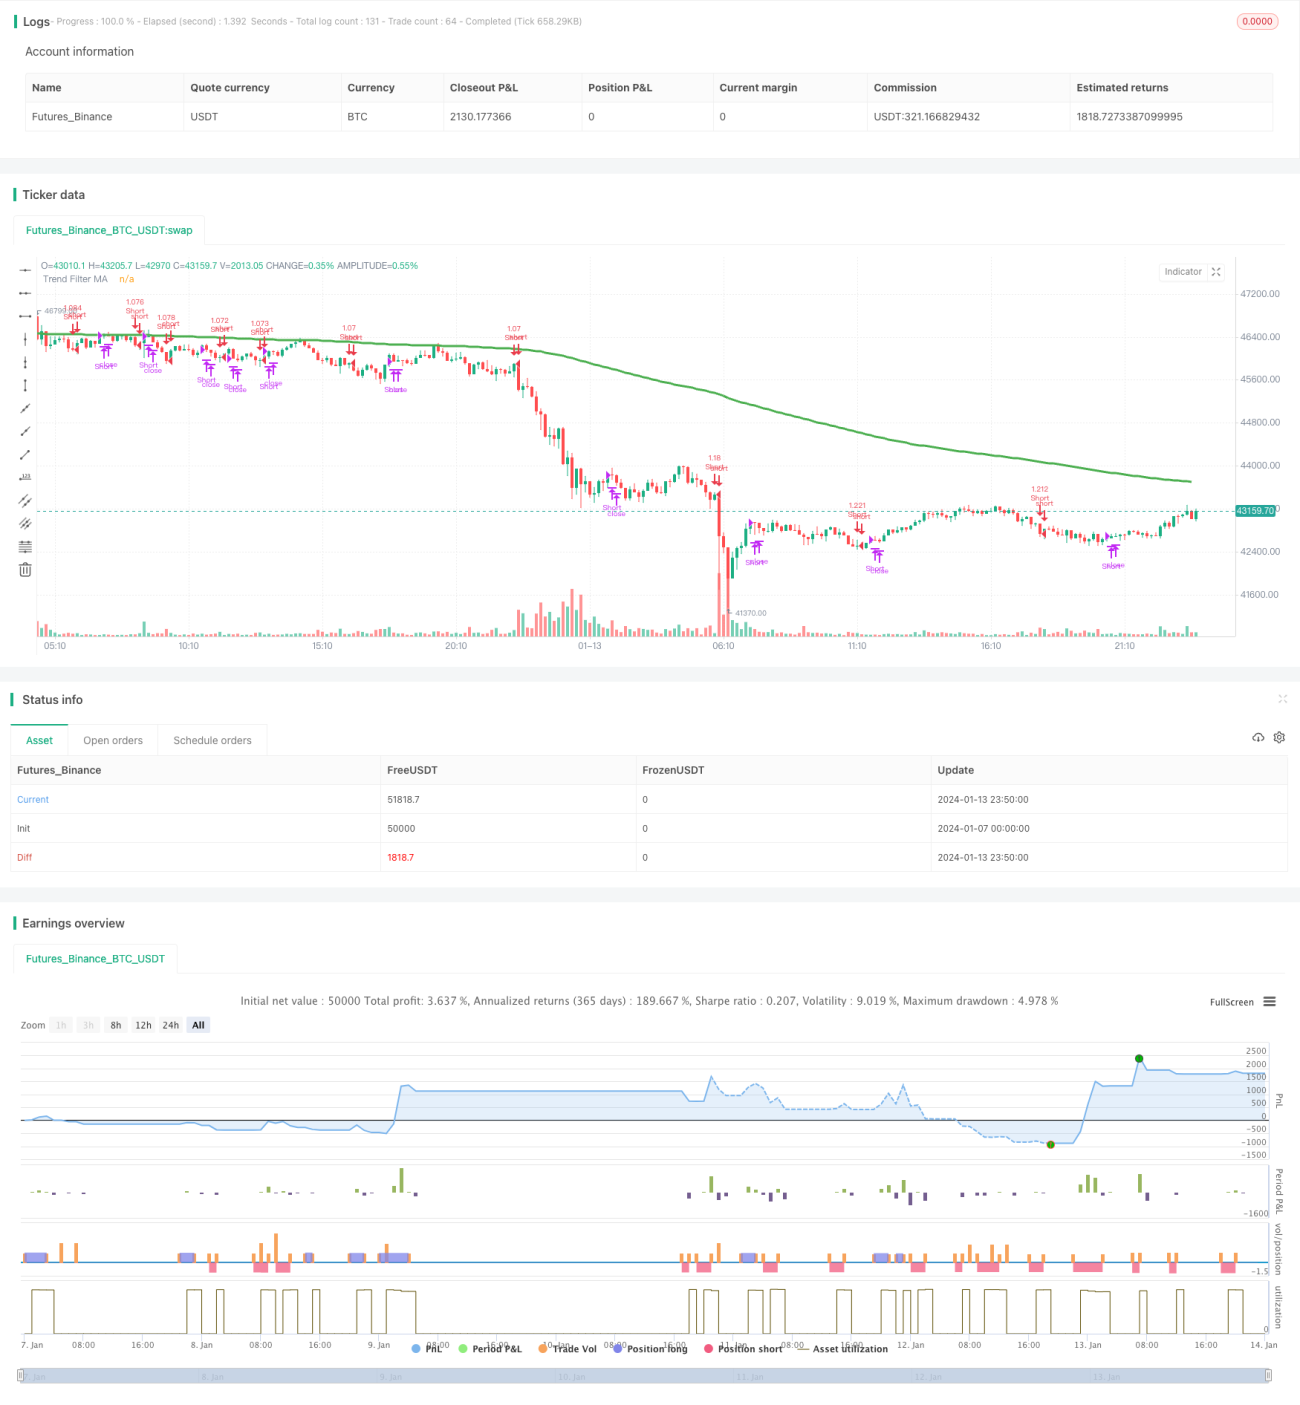
Overview
The ADX Dynamic Trend Strategy is a quantitative trading strategy that utilizes the ADX indicator to determine the strength and direction of market trends. It generates buy and sell signals by calculating the Average Directional Index (ADX) to judge if a trend exists in the market and by calculating the Positive Directional Indicator (DI+) and Negative Directional Indicator (DI-) to determine the direction of the trend.
Trading Logic
The strategy first uses the ADX indicator to determine if a trend exists in the market. When ADX is above a user-defined key level (default 23), it signals that the market trend is relatively strong. When the current ADX value is higher than the ADX value n days ago (n is the user-defined lookback period, default 3 days), it signals that ADX is rising and a trend is forming in the market.
The strategy then utilizes DI+ and DI- to determine the direction of the market trend. When DI+ is higher than DI-, it signals an uptrend in the market. When DI+ is lower than DI-, it signals a downtrend in the market.
Finally, the strategy combines the ADX and DI analysis to generate specific buy and sell signals:
- When ADX rises and is above key level and DI+ is higher than DI-, a buy signal is generated
- When ADX rises and is above key level and DI+ is lower than DI-, a sell signal is generated
- When ADX turns to decrease, a flatten position signal is generated
The strategy also provides features like moving average filtering and customizable backtesting time range.
Advantage Analysis
The ADX Dynamic Trend Strategy has the following advantages:
- Automatically detect the existence of market trends, avoiding ineffective trading
- Automatically determine the direction of market trends for trend following
- Clear logic of buying on trend existence and flattening on trend disappearance
- Configurable moving average filtering avoids false breakouts
- Customizable backtesting time range for historical testing
- Adjustable indicator parameters for optimization across different products
Risk Analysis
The strategy also has some risks:
- ADX indicator has lagging effect, possibly missing early trend opportunities
- Trend direction reliance on DI may produce false signals as DI is sensitive
- Moving average filter may miss short-term opportunities
- Improper backtesting time frame may cause overfitting
- Improper indicator parameters may affect strategy performance
To mitigate risks, the following can be considered:
- Shorten ADX parameters to reduce lagging
- Remove or adjust DI filter to prevent false signals
- Shorten moving average period
- Expand backtesting time frame for full sample testing
- Optimize parameters to find best settings
Enhancement Opportunities
The strategy can be enhanced from the following aspects:
- Portfolio testing across multiple stocks to diversify single-stock risk
- Add stop loss logic to control per trade loss
- Combine with other indicators for signal verification to improve accuracy
- Introduce machine learning algorithms for buy/sell signal generation
- Add auto parameter tuning module for dynamic adjustment
Conclusion
The ADX Dynamic Trend Strategy utilizes ADX to determine trend existence and DI for trend direction. It generates trading signals when a trend exists and flattens positions when the trend disappears. The logic is clear. By automatically detecting and tracking trends, ineffective trading can be avoided to some extent in non-trending markets. With proper enhancement, this strategy can become a powerful tool for medium-to-long term quantitative trading.
/*backtest
start: 2024-01-07 00:00:00
end: 2024-01-14 00:00:00
period: 10m
basePeriod: 1m
exchanges: [{"eid":"Futures_Binance","currency":"BTC_USDT"}]
*/

//@version=4
// This source code is subject to the terms of the Mozilla Public License 2.0 at https://mozilla.org/MPL/2.0/
// © millerrh with inspiration from @9e52f12edd034d28bdd5544e7ff92e
//The intent behind this study is to look at ADX when it has an increasing slope and is above a user-defined key level (23 default). - 1