Bollinger Bands Based Intelligent Tracking Trading Strategy

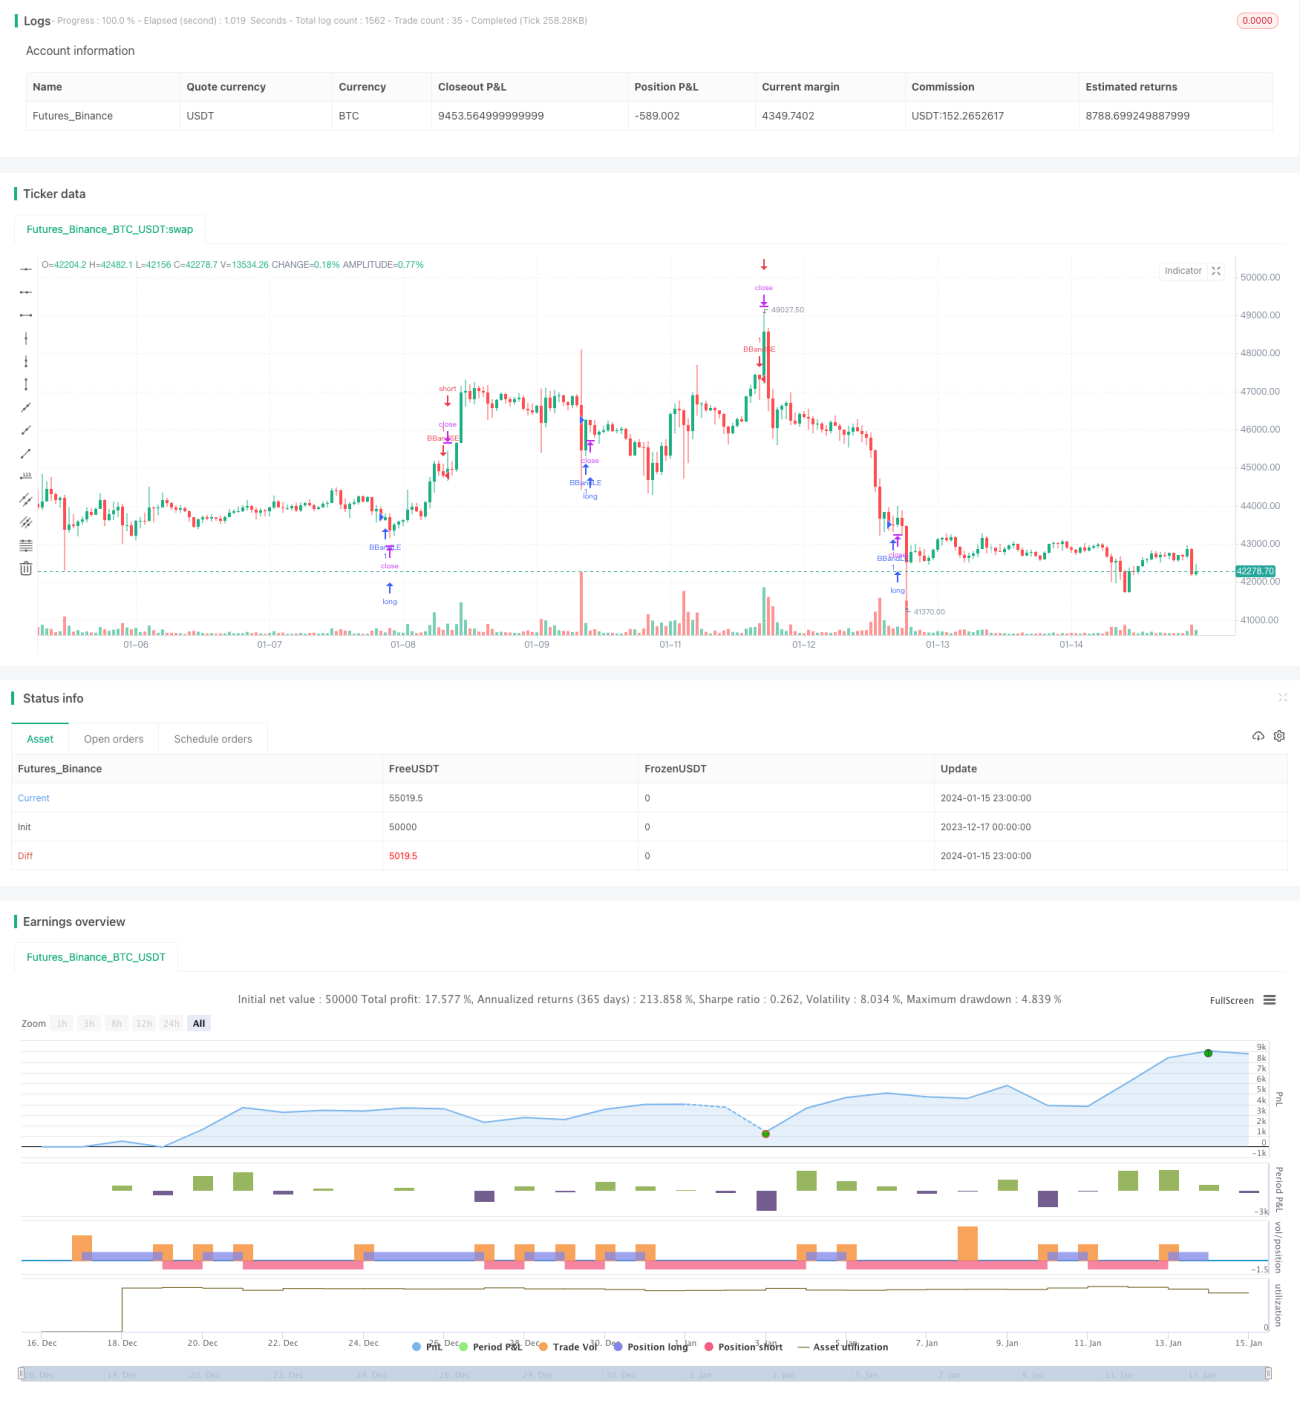
Overview
This strategy is designed based on the Bollinger Bands indicator to go short when price breaks above the upper band and go long when price breaks below the lower band, realizing intelligent tracking trading.
Strategy Logic
The strategy uses the middle line, upper band and lower band of the Bollinger Bands as the base indicators. The middle line is the moving average of the closing prices over n days. The upper band is the middle line shifted up by two standard deviations while the lower band is shifted down by two standard deviations. When price breaks the lower band upwards, go long. When price breaks the upper band downwards, go short. This allows intelligent tracking of price based on market volatility.
Specifically, the strategy mainly judges two metrics:
-
ta.crossover(source, lower): closing price breaks above lower band, go long
-
ta.crossunder(source, upper): closing price breaks below upper band, go short
When the exit condition triggers, use strategy.cancel() function to flatten existing position.
Advantage Analysis
The main advantages of this strategy are:
- Based on Bollinger Bands indicator, able to capture market volatility and effectively track price trend
- Clear and simple logic, easy to understand and implement
- Customizable parameters like period length and standard deviation multiplier, highly adaptable
- Configurable stop loss, break-even or trailing stop mechanisms to optimize strategy performance
Risk Analysis
There are also some risks with this strategy:
- Bollinger Bands breakouts prone to false signals
- Performance relies on parameter optimization, improper parameters may impact profitability
- Tracking stop loss difficult, unable to effectively control single trade loss
Corresponding solutions:
- Add filters with other indicators to avoid false breakouts
- Test parameters thoroughly to find optimal parameter set
- Add moving or trend-following stop loss mechanisms
Optimization Directions
The strategy can be further optimized by:
- Adding other indicators to determine trend direction, avoiding unsuitable market conditions for Bollinger strategy
- Testing different period lengths to find the optimal one
- Incorporating moving or trailing stop mechanisms to effectively control single trade loss
Conclusion
This strategy is designed based on the Bollinger Bands indicator, using price breakouts of upper and lower bands to automatically track prices. The logic is simple and sensitive to market volatility. Further optimizations can be done via parameter tuning and stop loss mechanisms. Overall this strategy works well for indices and commodities with higher volatility. Traders can backtest and optimize based on their trading preference to derive an astika trading strategy.
/*backtest
start: 2023-12-17 00:00:00
end: 2024-01-16 00:00:00
period: 1h
basePeriod: 15m
exchanges: [{"eid":"Futures_Binance","currency":"BTC_USDT"}]
*/

//@version=5
strategy("Bollinger Bands Strategy with alerts (incl. pending orders) via TradingConnector to Forex", overlay=true)
source = close
length = input.int(20, minval=1)- 1