Momentum Mean Deviation Breakthrough Strategy

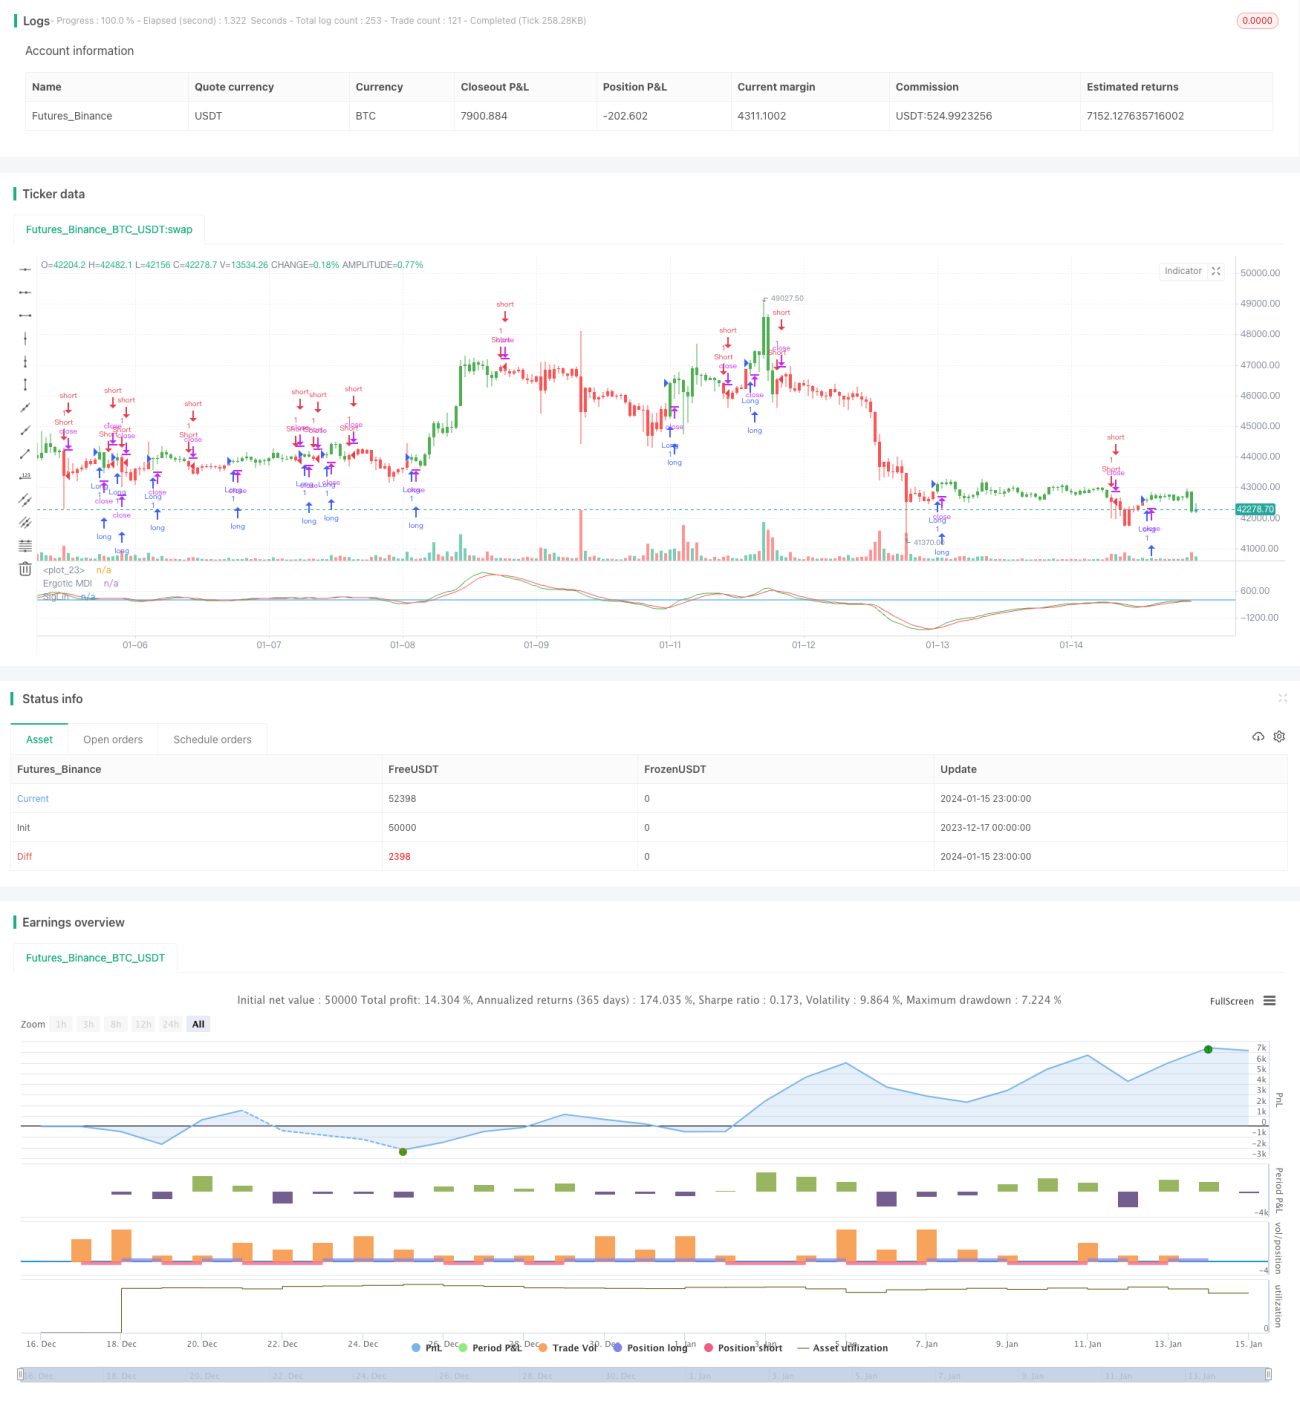
Overview
This strategy is based on the technical indicator "Momentum Mean Deviation Index" described in William Blau's book "Momentum, Direction and Divergence" published in 1995. This indicator focuses on three key elements of price momentum, price direction and price divergence, and deeply analyzes the relationship between price and momentum.
Strategy Principle
This strategy uses the Momentum Mean Deviation Index to determine price trends and breakout points. It first calculates the EMA line of the price, then calculates the deviation of the price from this EMA line. This deviation is then double smoothed by EMA to get the final momentum mean deviation index curve. Trading signals are generated when this curve crosses above or below its own signal line. Specifically, the calculation process is as follows:
- Calculate the EMA line of price xEMA
- Calculate the deviation of price from xEMA, xEMA_S
- Smooth xEMA_S with EMA, parameter s, get xEMA_U
- Smooth xEMA_U again with EMA, parameter u, get signal line xSignal
- Compare the magnitude relationship between xEMA_U and xSignal:
- xEMA_U > xSignal is long signal
- xEMA_U < xSignal is short signal
- Generate trading signal possig
Enter long or short positions according to the possig signal.
Advantage Analysis
The advantages of this strategy include:
- The double EMA filter can effectively filter out false breakouts and improve signal reliability
- Based on EMA, it is sensitive to short-term price changes and can capture trend turning points
- Adopts parameterized design which can adjust parameters as needed to suit different cycles and varieties
- Contains both long and short trading signals to profit from two-way price fluctuations
Risk Analysis
This strategy also has some potential risks:
- EMA is quite sensitive to parameter selection. Improper settings may miss signals or generate wrong signals
- Long and short signals may appear simultaneously. Filtering conditions need to be set up to avoid offsetting each other
- The double EMA filter may overly filter out valid signals, resulting in missing trades
- It does not consider large cycle trend relationships and has contrarian trading risks
These risks can be reduced by optimizing parameters, setting filtering criteria, introducing trend judgment modules, etc.
Optimization Directions
The optimization directions for this strategy include:
- Optimize parameter values r, s, u to make them more suitable for different cycles and varieties
- Add trend judgment module to avoid contrarian operations
- Increase filtering conditions like channel breakouts to avoid invalid signals
- Incorporate other factors and models to improve strategy performance
Summary
This strategy is based on the momentum mean deviation index which captures price reversal points based on the price-momentum relationship. Its parameterized and optimizable design can adapt to different cycles and varieties. But it also has some false signal and contrarian trading risks. Further optimizing parameters and models and incorporating trend judgment etc. can improve its performance.
/*backtest
start: 2023-12-17 00:00:00
end: 2024-01-16 00:00:00
period: 1h
basePeriod: 15m
exchanges: [{"eid":"Futures_Binance","currency":"BTC_USDT"}]
*/

//@version = 2
////////////////////////////////////////////////////////////
//  Copyright by HPotter v1.0 12/12/2016
// This is one of the techniques described by William Blau in his book "Momentum,- 1