Dual RSI Breakthrough Strategy

Overview
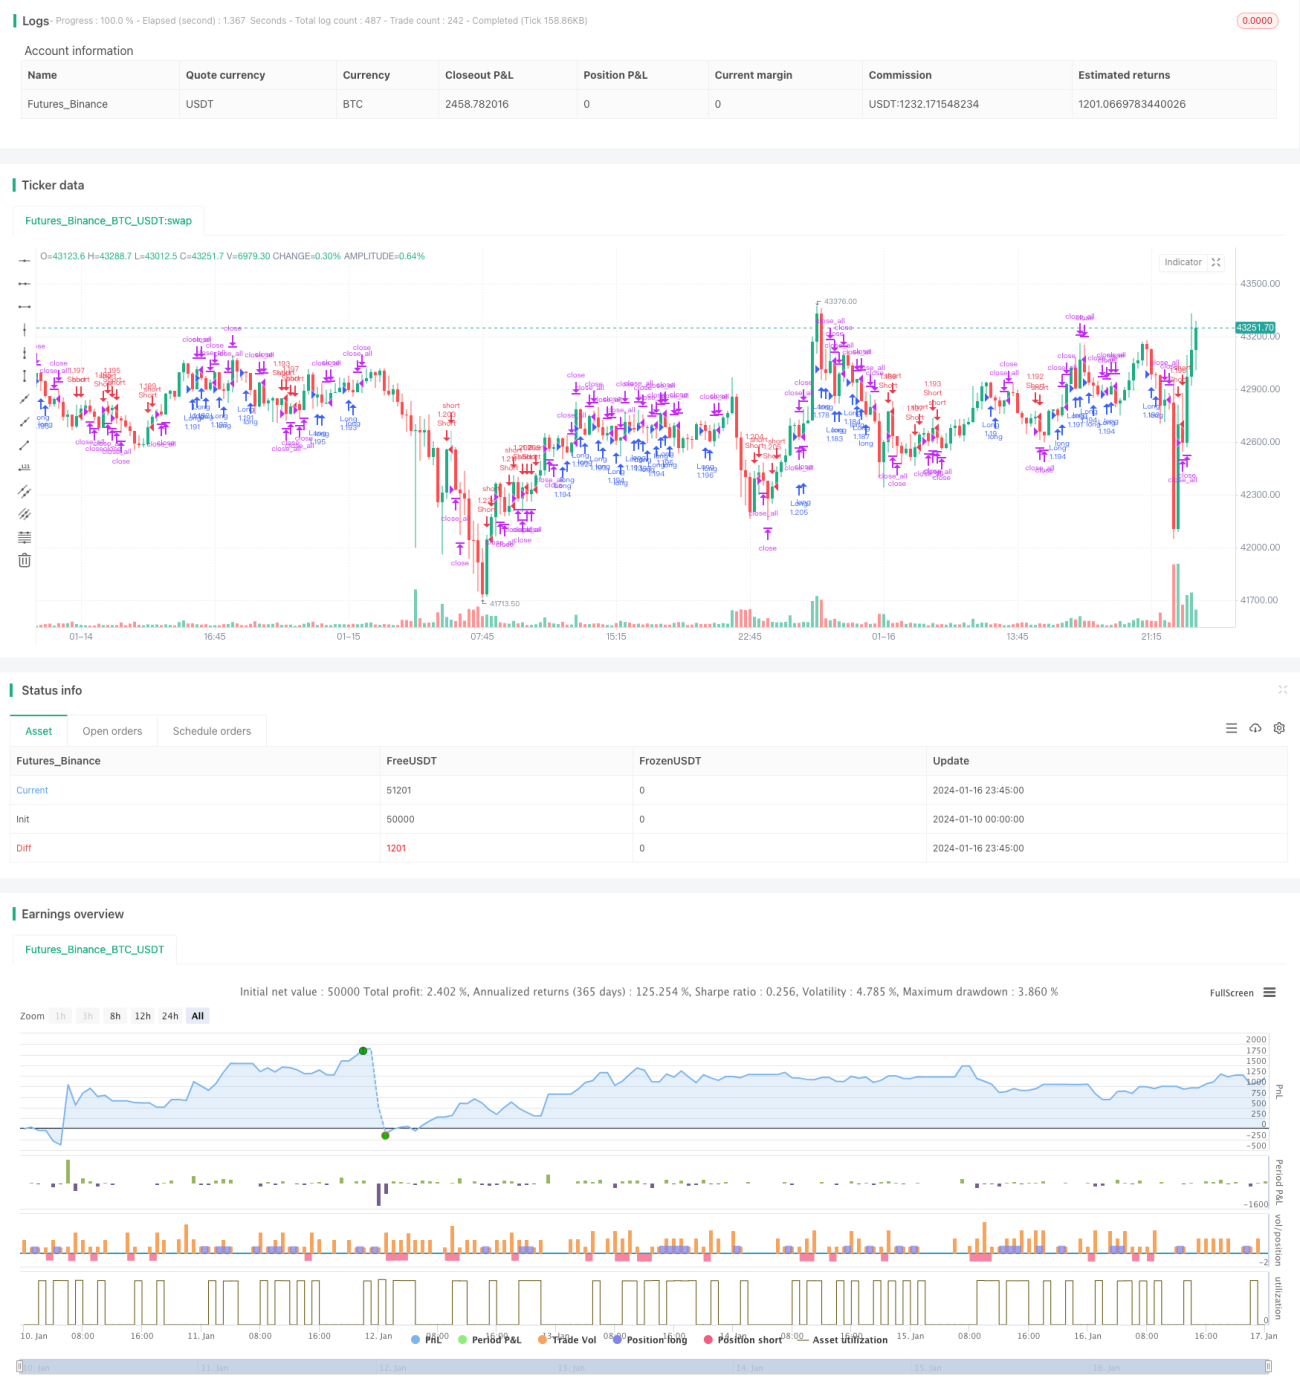
The Dual RSI Breakthrough Strategy is a quantitative trading strategy that generates trading signals by using both fast and slow RSI indicators. The strategy forms trading signals through the breakthrough between the fast and slow RSI indicators to track market trends.
Strategy Principle
The strategy uses two RSI indicators simultaneously, a fast RSI indicator with a period of 2 and a slow RSI indicator with a period of 14. The trading signals of the strategy come from the breakthrough between the two RSI indicators.
When the slow RSI is greater than 50 and the fast RSI is less than 50, a long signal is generated. When the slow RSI is less than 50 and the fast RSI is greater than 50, a short signal is generated. After going long or short, if a stop loss signal occurs (a red K-line column appears when the long position loses money, and a green K-line column appears when the short position loses money), the position will be closed.
Advantage Analysis
- Form trading signals by using the overbought and oversold features of RSI indicators to avoid chasing peaks and killing bottoms.
- The combination of fast and slow RSI can track trend changes to realize timely entries and exits.
- Track medium and long term trends and avoid being disturbed by short term market noise.
- Good risk control with stop loss mechanism.
Risks and Solutions
- Risk of false breakthrough. The solution is to reasonably set the parameters of fast and slow RSI to ensure true breakthrough.
- Risk from improper stop loss point setting. The solution is to reasonably set the stop loss distance based on market volatility.
- Risk of spiral losses. The solution is not to chase rises and beat declines, and make entries and exits according to the strategy rules.
Optimization Directions
The strategy can also be optimized in the following aspects:
- Optimize the parameters of fast and slow RSI to find the best parameter combination;
- Introduce other indicators to form more reliable trading signals;
- Set dynamic stop loss and adjust the stop loss point in real time according to market volatility.
Conclusion
The dual RSI breakthrough strategy uses fast and slow RSI indicators to track market trend changes and forms trading signals in overbought and oversold areas, which can effectively avoid chasing peaks and killing bottoms. At the same time, a stop loss mechanism is set up to control risks. The strategy is simple to operate and easy to implement, suitable for quantitative trading. The profit factor can be further improved through parameter optimization, combination indicators, etc.
- 1