Bollinger Bands Based Trend Following Strategy

Overview
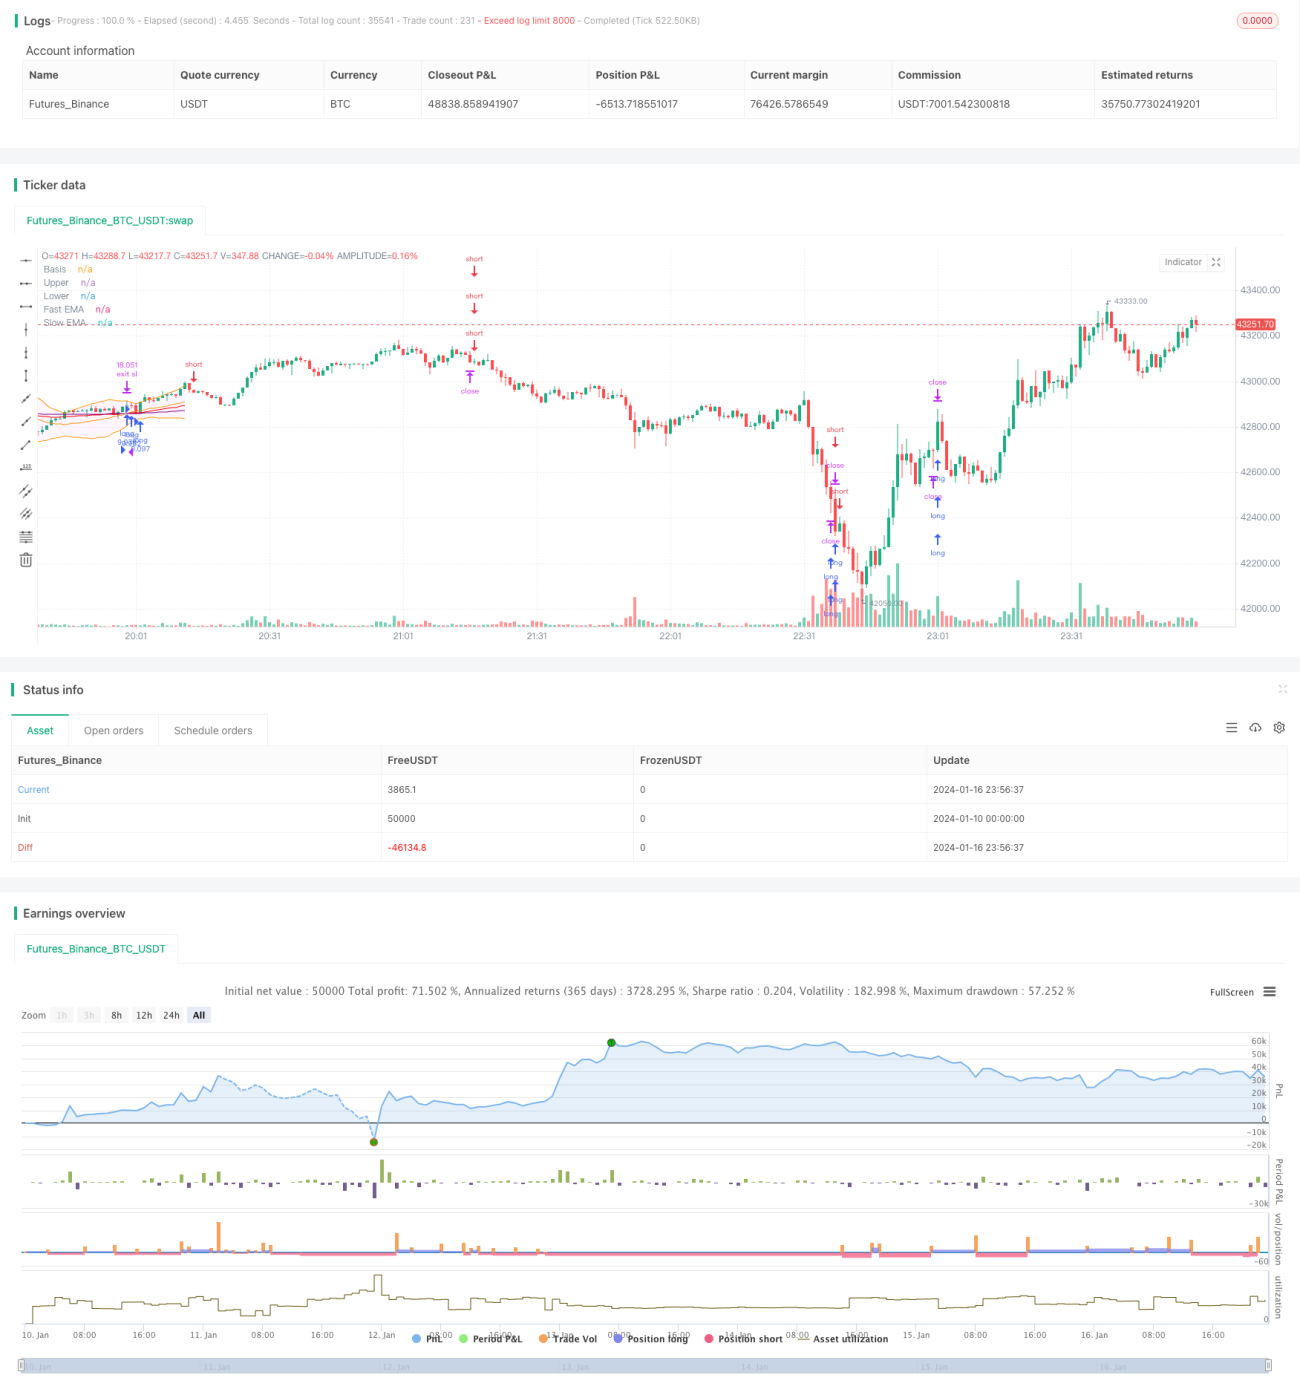
This strategy uses Bollinger Bands to determine the price trend direction combined with fast and slow moving averages to enter positions. The buy signal is triggered when the price breaks through the Bollinger middle band and the fast moving average crosses over the slow moving average. The sell signal is triggered when the price breaks below the Bollinger middle band and the fast moving average crosses below the slow moving average. The stop loss method is ATR trailing stop loss.
Strategy Logic
The strategy consists mainly of the Bollinger Bands indicator and Moving Averages.
The Bollinger Bands include the middle band, upper band and lower band. The middle band is the n-day simple moving average. The upper band and lower band are k standard deviations above and below the middle band. When price is close to the upper band, it indicates overbought conditions. When price is close to the lower band, it indicates oversold conditions. The middle band represents the price trend direction.
The Moving Averages adopt a fast moving average and a slow moving average. The fast moving average has a period of 40 and the slow moving average has a period of 120. When the fast MA crosses over the slow MA, it is a buy signal. When the fast MA crosses below the slow MA, it is a sell signal.
Based on the rules of the above indicators, the specific trading signals of this strategy are:
Buy Signal: Close price breaks through the middle band and fast MA crosses over slow MA
Sell Signal: Close price breaks below the middle band and fast MA crosses below slow MA
Stop Loss: ATR trailing stop loss, stop loss price is current price minus 4 times ATR
Advantage Analysis
This strategy combines the Bollinger Bands and Moving Averages, which can effectively determine the price trend direction and avoid excessive position opening during ranging periods.
The Bollinger middle band can clearly reflect the price trend. When price breaks through the middle band, it forms a strong trend signal. The upper and lower bands can effectively judge overbought and oversold conditions to avoid chasing new highs and killing lows during ranging periods.
The golden cross and dead cross of fast and slow MAs are also commonly used methods to determine trends. Combined with the Bollinger Bands, it can more accurately determine entry timing.
The ATR trailing stop loss adjusts the stop loss point to adapt to market fluctuations, effectively controlling single position loss.
Risk Analysis
The biggest risk of this strategy is that price may quickly pullback after breaching the middle band, unable to make profits effectively. This would result in losses. The solution is to appropriately adjust the MA parameters to make the indicators match better to market characteristics.
Another risk is that during ranging periods, the Bollinger Bands and Moving Averages may give out wrong signals. At this time, we should consider skipping trading signals and wait for clearer trends. Or reduce position sizing appropriately.
Optimization Directions
The strategy can be optimized in the following aspects:
-
Adjust Bollinger Bands parameters to adapt to market characteristics of different periods
-
Adjust fast and slow MA parameters to match the specific trading instruments better
-
Add other auxiliary indicators for combination to improve strategy stability
-
Optimize position sizing methods, increase positions during trending periods and decrease positions during ranging periods
-
Test different stop loss methods to find better solutions
Conclusion
In general, this is a typical trend following strategy. It combines Bollinger Bands and Moving Averages to determine price trends and trading opportunities. The strategy signal is relatively clear, suitable for automated trading. But it also has some risks, parameters and rules need to be optimized to adapt to more extensive market environments. Overall, the strategy framework is feasible and has large room for improvement.
- 1