Combined Moving Average and Infinite Impulse Response Line Strategy

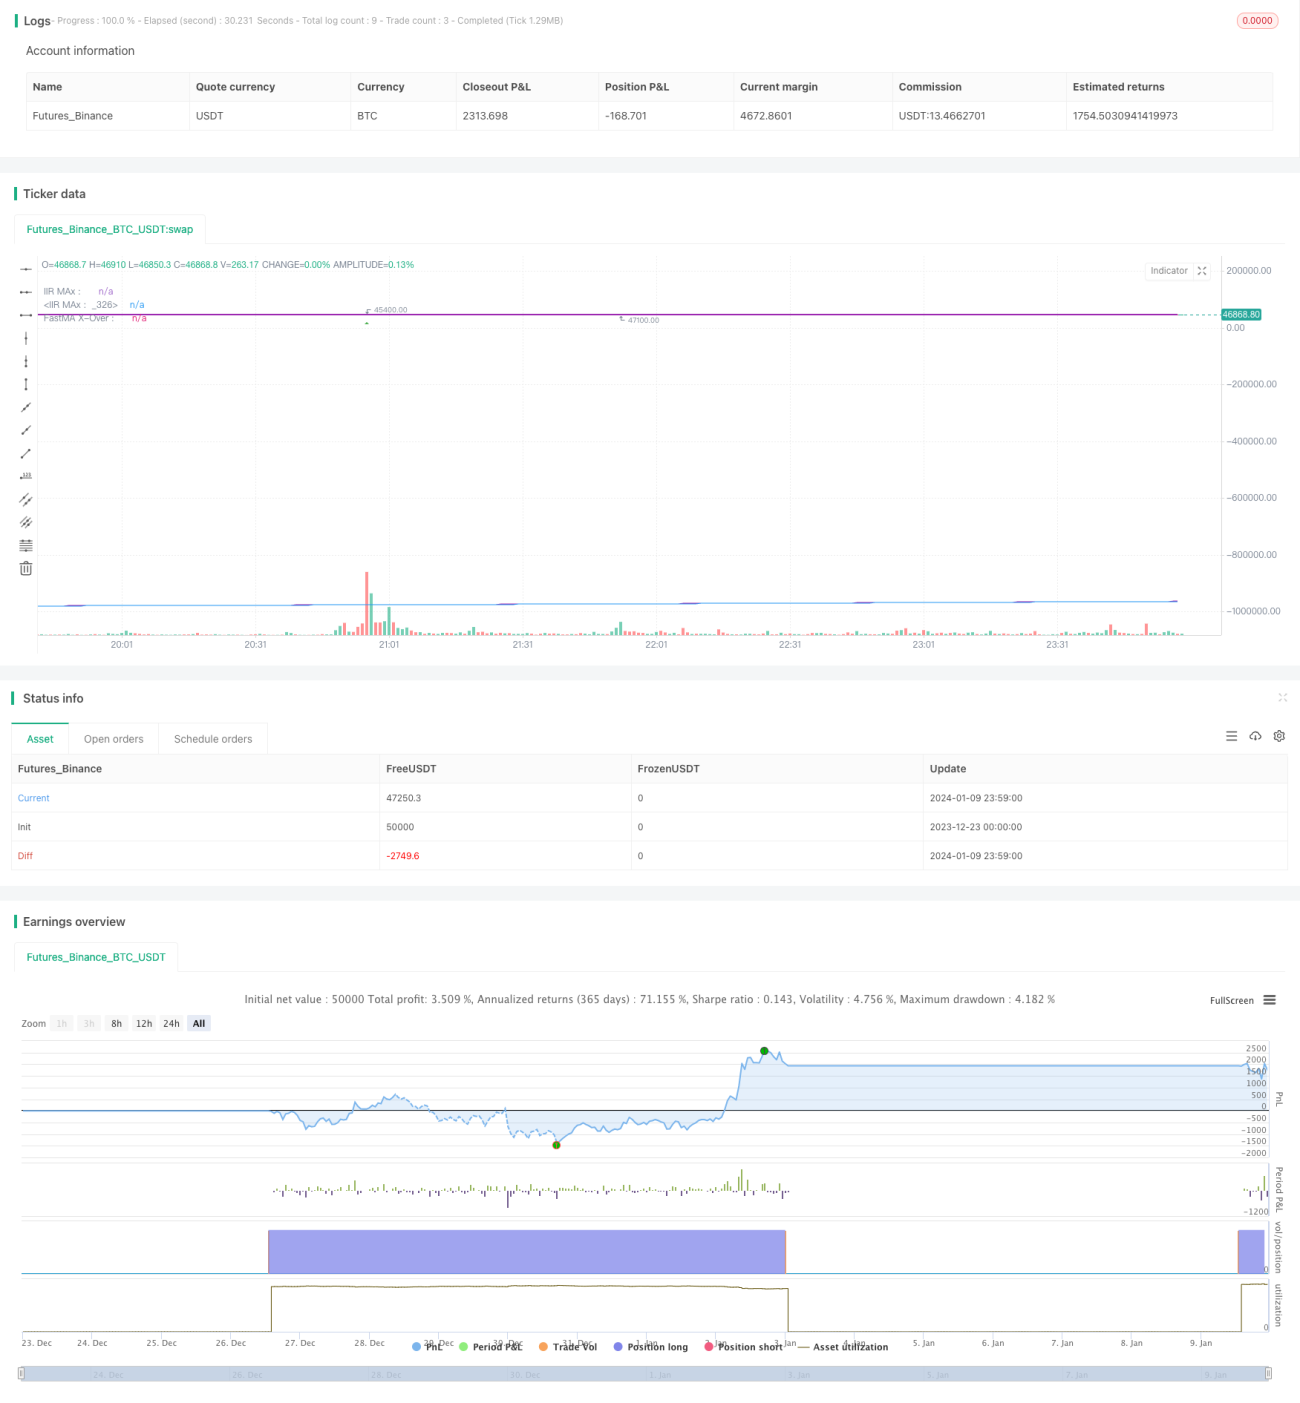
Overview
This is a quantitative strategy that combines the use of moving averages, infinite impulse response lines (IIR) and adaptive linear moving averages (ALMA). The strategy has a combination of multiple indicators to provide traders with rich trading signals.
Strategy Principle
The main components of the strategy include:
-
Use a combination of simple moving averages (SMA), ALMA and IIR to detect cross signals between them as timing for trade entry.
-
Use 3 IIRs with different periods and calculate the distance between them to determine if the price is in a squeeze state. The squeeze state represents decreasing volatility and often presages significant price changes.
-
Judging the slope of the IIR, when the slope rises it is green, and when it falls it is blue. It can visually determine the trend of IIR.
-
Calculate if the distance between SMAs is widening, if so, make a special mark, representing the "fan" expansion, usually meaning the price is entering a trend state.
-
Combine the overbought and oversold signals of the relative strength index (RSI) to supplement the trading signals.
By combining the use of the above sections, the strategy can provide relatively comprehensive and rich trading entry, judgment and exit signals.
Advantage Analysis
The biggest advantage of this strategy is that the combination of indicators is comprehensive and rich, taking into account both trend judgments and volatility ratios and overbought/oversold states, providing multidimensional references for trading decisions.
Another advantage is that the parameters and indicators are easy to adjust and optimize so users can enable relevant indicators and parameters according to their needs.
From the perspective of risk management, this strategy pays attention to both fast and slow moving averages, which reduces the probability of incorrect signals caused by price fluctuations.
Risk Analysis
The main risks of this strategy are:
-
Too complex to easily cause conflicts between indicators and improper parameter combinations can lead to overfitting.
-
Adopting multiple moving average systems still carries large losses in the event of severe market turmoil (such as major economic events).
-
Insufficient in-depth backtesting may pose some survival bias risk in real trading.
In practice, we need to pay attention to risk management and appropriately adjust the position size. We also need to conduct multiple backtests over longer time frames and larger datasets to ensure practical effectiveness of the strategy.
Strategy Optimization
Considering the complex combination of indicators and large number of parameters in this strategy, future optimizations can be made in the following aspects:
-
Simplify indicator selections, remove indicators with low correlations or conflicts.
-
Optimize the selection of IIR moving averages to better match market characteristics.
-
Optimize combinations of fast and slow moving averages to increase stability of crossover signals.
-
Increase machine learning models to assist in judgments and improve the adaptability of strategies.
-
Optimize correlation with global indexes to improve success rate of trend judgments.
Conclusion
Through flexible combinations and optimizations of indicators, this strategy can reflect market status relatively comprehensively and provide multi-dimensional support for trading decisions. But there are still risks of real trading and data overfitting. We still need to constantly optimize and adjust the strategy in practice to adapt to market changes.
/*backtest
start: 2023-12-23 00:00:00
end: 2024-01-10 00:00:00
period: 1m
basePeriod: 1m
exchanges: [{"eid":"Futures_Binance","currency":"BTC_USDT"}]
*/

//The plotchar UP/DOWN Arrows  is the crossover of the fastest MA and fastest IIR MAs
//
//The dots at the bottom are the two simple averages crossing over
//- 1