Quantitative Trading Strategy Based on Linear Regression RSI

Overview
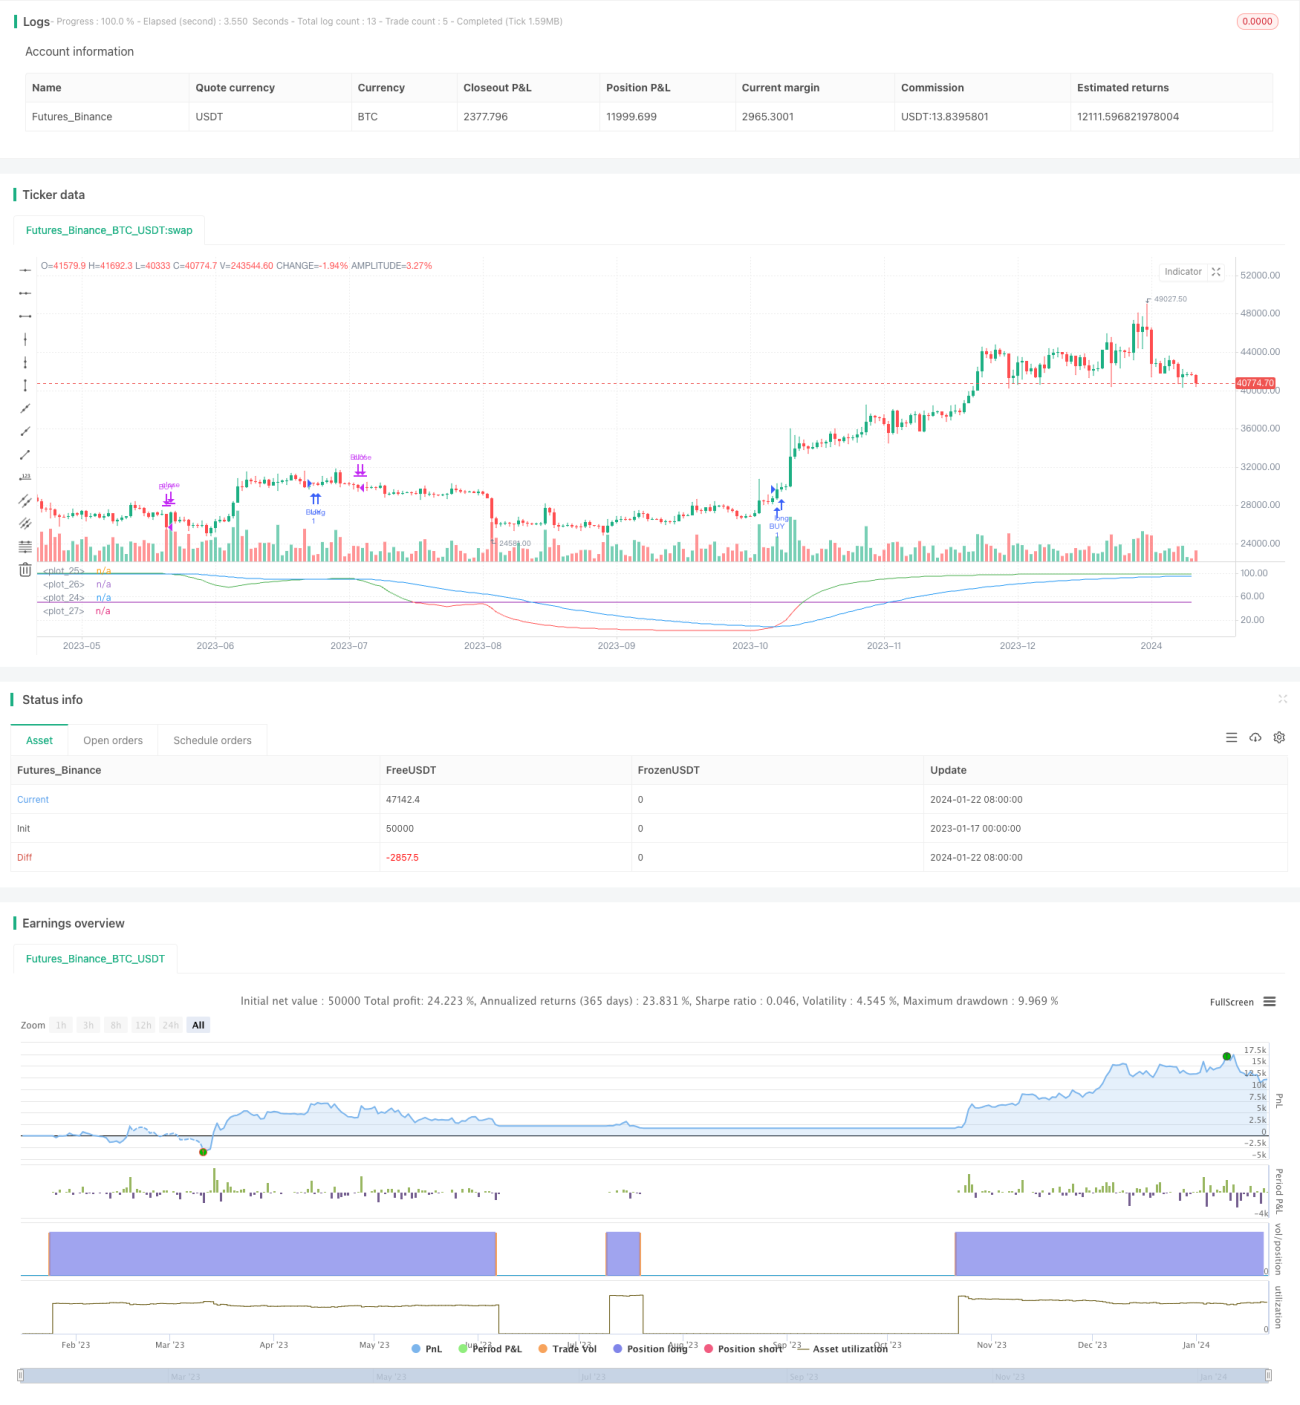
This strategy is designed based on the linear regression RSI indicator. It generates buy and sell signals by calculating the crossover between the linear regression RSI and EMA. The strategy also provides two options for the buy logic that can be selected as needed.
Strategy Logic
The strategy first calculates a 200-period linear regression, then computes a 21-period RSI based on the linear regression result. After that, a 50-period EMA is calculated. When the RSI crosses above the EMA, a buy signal is generated. When the RSI crosses below the EMA, a sell signal is triggered to close the position.
The strategy offers two types of buy logic:
- Buy when RSI crosses above EMA
- Buy when RSI is above EMA and also above the overbought line
The appropriate buy logic can be selected based on market conditions.
Advantage Analysis
This strategy combines the strengths of both linear regression RSI and EMA, which effectively filters out some price noise and generates more reliable trading signals.
The linear regression RSI better captures the trend, and the EMA helps identify turning points. The combination of the two can find mean reversion opportunities within trends.
The strategy provides two optional buy logics for more flexibility to adapt to different market stages. For example, the first logic can be used in strong trends, while the second logic fits better for ranging markets.
Risk Analysis
The main risk of this strategy lies in the potential change of relationship between the RSI and EMA, which may lead to incorrect trade signals.
In addition, the lagging nature of RSI and EMA as indicators can also cause certain delays in entries and exits, failing to perfectly capture turning points. This introduces some degree of practical risks.
To mitigate the risks, parameters like the lengths of RSI and EMA may be optimized for better coordination between the two. Also, proper position sizing is necessary to limit losses on single trades.
Improvement Directions
The strategy can be improved from the following aspects:
- Optimize lengths of linear regression RSI and EMA to find best parameter combinations
- Add other indicators like MACD, Bollinger Bands etc. for signal quality enhancement
- Incorporate volatility metrics to adjust position sizing
- Utilize machine learning techniques to automatically optimize parameters
Conclusion
This strategy designs a mean reversion strategy based on linear regression RSI and EMA, identifying reversal opportunities within ranges by looking at RSI-EMA crosses. It also provides two optional buy logics for flexibility to adapt to varying markets. Overall, by combining multiple indicators, the strategy can effectively discover reversal chances. With parameter tuning and additional filters, it has the potential for better performance.
- 1