Bi-directional Crossing Zero Axis Qstick Indicator Backtest Strategy

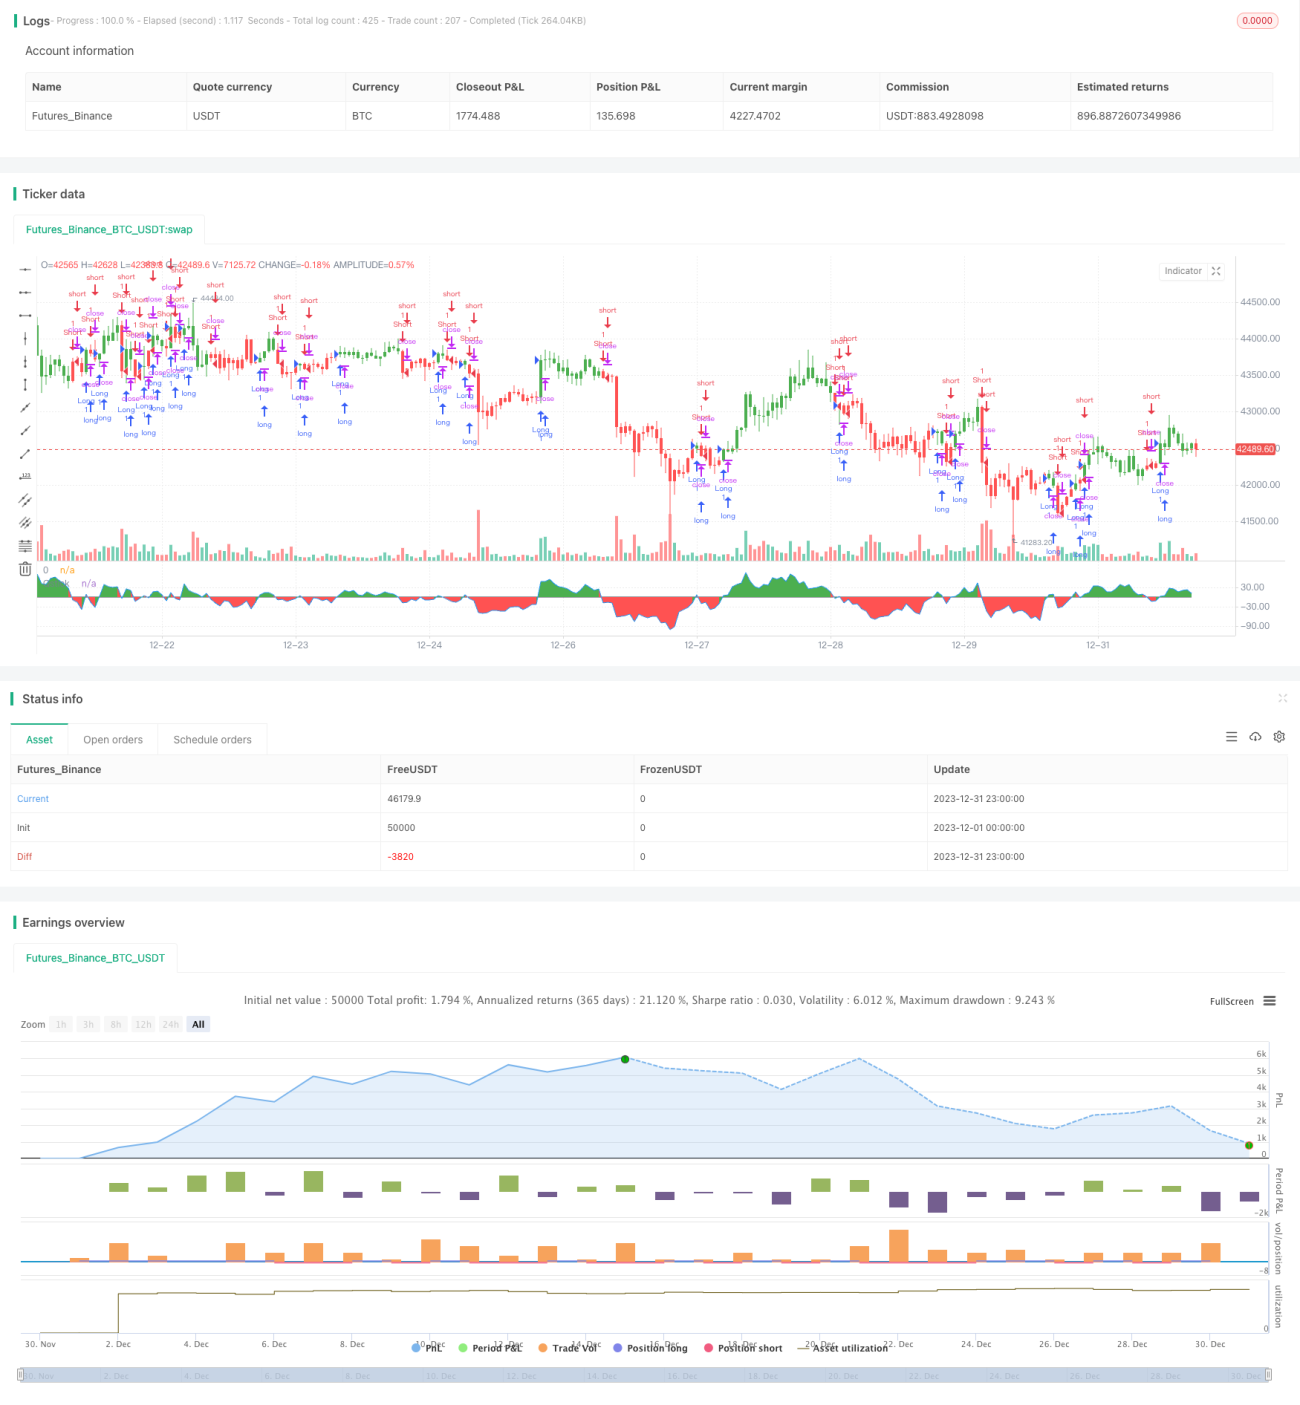
Overview
The bi-directional crossing zero axis Qstick indicator backtest strategy is a trend tracking and signal generation strategy based on the Qstick technical indicator developed by Tushar Chande. This strategy calculates the moving average difference between the open and close prices of a stock to judge the buying and selling pressure in the market, and generates trading signals when this difference indicator crosses the zero axis.
Strategy Principle
The core indicator of the bi-directional crossing zero axis Qstick strategy is Qstick. The Qstick indicator is obtained by calculating the moving average of the difference between closing price and opening price over a certain period. When Qstick is greater than 0, it means that the closing price was generally higher than the opening price during this period, and the bullish power prevailed; when Qstick is less than 0, it means that the opening price was generally higher than the closing price during this period, and the bearish power prevailed.
The trading signals of this strategy come from when the Qstick indicator crosses the zero axis. A buy signal is generated when Qstick crosses above zero from below, indicating that the buying pressure starts to exceed the selling pressure and a long position can be established; conversely, a sell signal is generated when Qstick crosses below zero from above, indicating that selling pressure starts to increase and existing positions should be closed out. In addition, a moving average of Qstick values can be plotted as a signal line, and trading signals can also be generated when the Qstick indicator crosses this signal line.
This strategy allows for reversal trading. That is, when a buy signal is originally supposed to be generated, an actual sell operation is taken; when a sell signal is originally supposed to be generated, an actual buy operation is taken. This can be used to reverse follow mainstream investors in the market.
Advantage Analysis
The bi-directional crossing zero axis Qstick strategy has the following advantages:
- Use simple and intuitive indicators to determine market buying and selling pressure, with clear signal generation
- Adopt moving average difference indicator, which can effectively filter out market noise
- Signal lines can be drawn to avoid wrong signals
- Support reversal trading, which can be used to track mainstream investors
- Customizable parameters suit different stocks and market environments
Risk Analysis
The bi-directional crossing zero axis Qstick strategy also has some risks:
- Qstick indicator has a lag in recognizing turning points, possibly missing the best entry point
- Frequent signals lead to relatively high transaction costs
- Reversal trading has higher risks and needs to be used cautiously
The following methods can be used to reduce risks:
- Optimize the Qstick cycle parameters to reduce indicator delay
- Increase signal line cycle parameters to reduce wrong signals
- Only adopt reversal trading during specific stages, and control position sizing
Optimization Directions
The bi-directional crossing zero axis Qstick strategy can be optimized in the following aspects:
- Incorporate other indicators to filter signals, such as volume indicators, volatility indicators, etc., to avoid generating wrong signals in non-trending environments
- Add stop loss strategies to stop loss when losses reach a certain percentage
- Further research to determine the optimal combination of Qstick and signal line cycle parameters
- Use machine learning methods to automatically determine optimal parameters
- Test the efficacy of this strategy in specific industries or individual stocks
Conclusion
The bi-directional crossing zero axis Qstick strategy utilizes simple indicators to determine changes in buying and selling pressure, and generates trading signals when the Qstick indicator crosses the zero axis, which can effectively capture price trends. This strategy is intuitive and easy to understand, suitable for beginners, and can also be optimized in many ways to meet the needs of advanced traders. However, this strategy also has certain flaws and needs to be used cautiously. In general, this is a very practical trend tracking and signal generation strategy.
/*backtest
start: 2023-12-01 00:00:00
end: 2023-12-31 23:59:59
period: 1h
basePeriod: 15m
exchanges: [{"eid":"Futures_Binance","currency":"BTC_USDT"}]
*/

//@version=2
////////////////////////////////////////////////////////////
//  Copyright by HPotter v1.0 16/04/2018
// A technical indicator developed by Tushar Chande to numerically identify - 1