RSI Bollinger Bands Trading Strategy

Overview
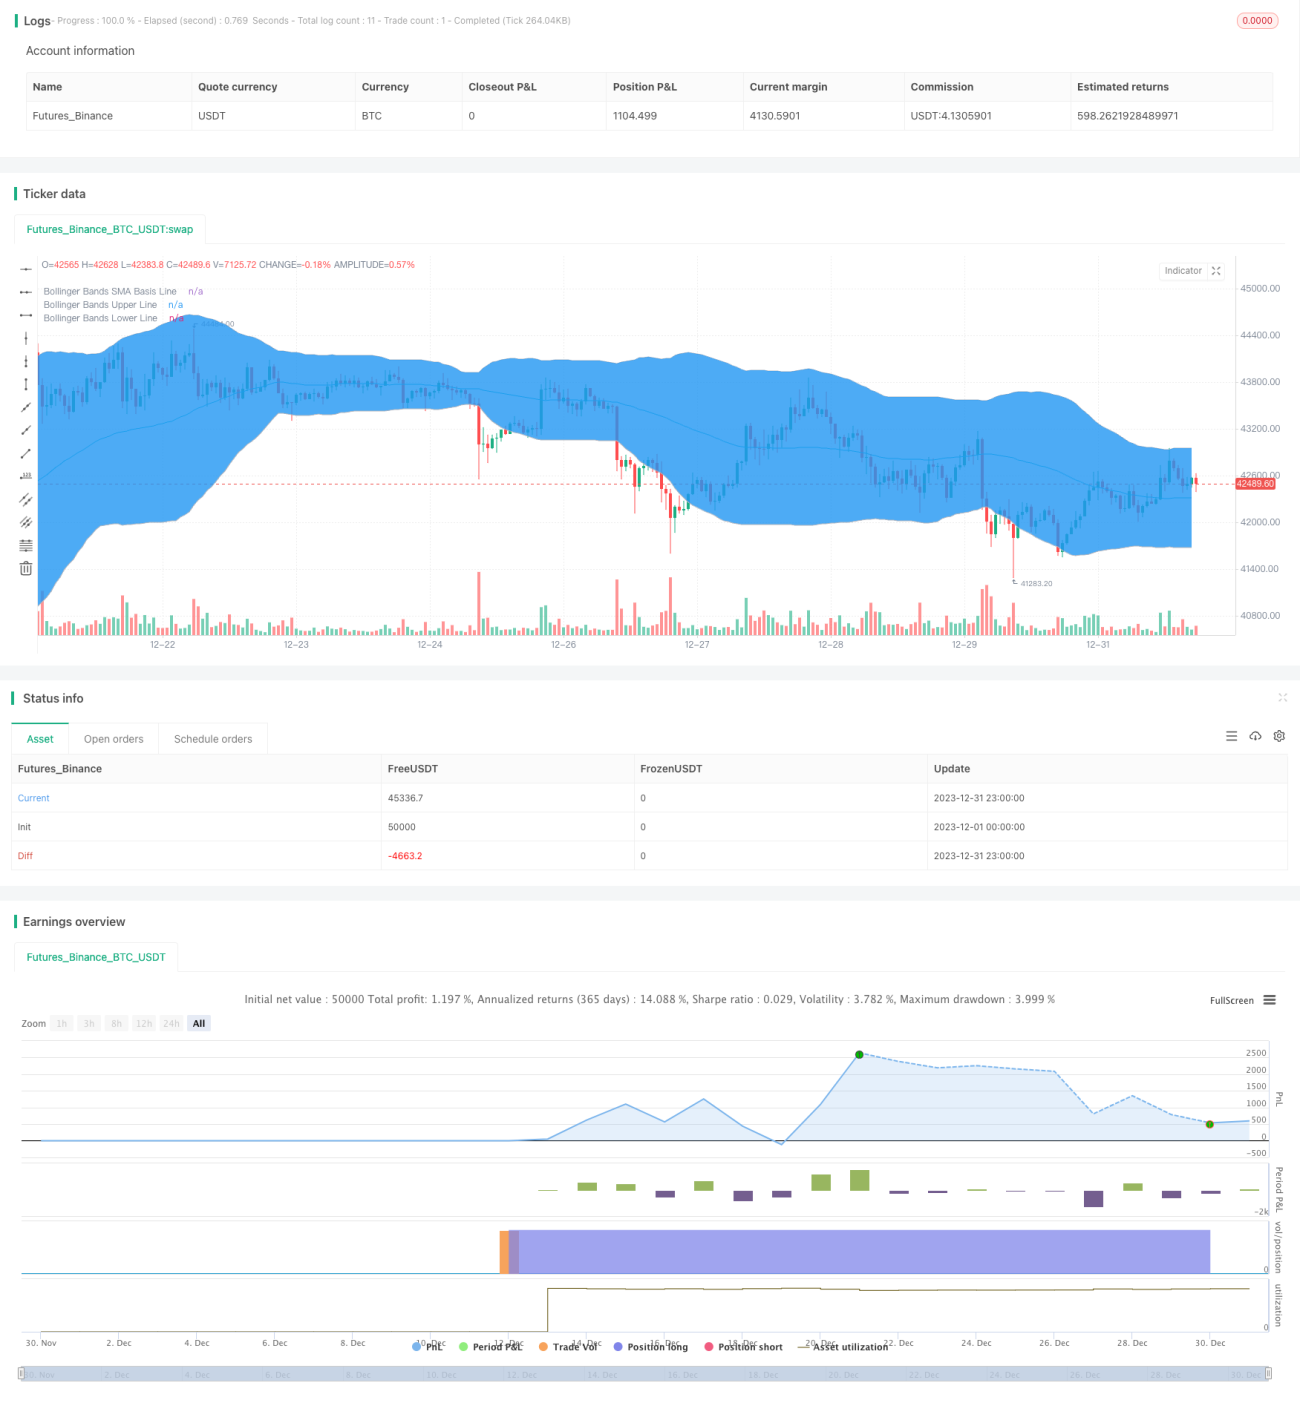
This strategy mainly uses the Relative Strength Index (RSI) combined with Bollinger Bands for trading signal judgment. Specifically, it goes long when the RSI crosses above the oversold level and below the lower Bollinger Band, and goes short when the RSI crosses below the overbought level and above the upper Bollinger Band.
Strategy Logic
The strategy first calculates the RSI indicator and Bollinger Bands. The RSI indicator reflects the relative strength of the trading instrument. When the RSI is below the oversold zone (default 30), it means the instrument is oversold and should buy. Bollinger Bands include upper band, middle band and lower band, which reflects well the fluctuation range of prices. Buying near the lower band and selling near the upper band can provide relatively reliable signals. This strategy combines the RSI indicator and Bollinger Bands for trading signal judgment. It generates buy signal when the RSI rises from the oversold zone to above it (default 30), and price rises from below the lower band to above it; it generates sell signal when the RSI falls from the overbought zone to below it (default 70), and price falls from above the upper band to below it.
Advantages
- Combining RSI and Bollinger Bands improves signal accuracy
- RSI filters out some noise
- Bollinger Bands reflect current market volatility range, reliable signals
- Strict trading rules, avoids invalid trades
Risks
- Improper Bollinger Bands parameters may cause inaccurate signals
- Inappropriate RSI overbought/oversold zone setup may impact judgements
- Strategy is strict, may miss some opportunities
Solutions:
- Optimize Bollinger Bands and RSI parameters to find best combination
- Relax conditions moderately, allow some invalid trades for more chances
Optimization Directions
- Test and optimize RSI and Bollinger parameters for optimum
- Add stop loss to control risks
- Consider adding other indicators like MACD for signal verification
- Test optimization results across different products and timeframes
Summary
The overall strategy is robust, effectively combines RSI and Bollinger Bands for stop loss. Further improvement can be achieved by testing and optimizing parameters. Also need to be aware of potential signal missing risks due to strict rules. In general, this is a reliable quantitative trading strategy.
- 1