RSI Combined with Bollinger Bands and Dynamic Support/Resistance Quantitative Strategy

Overview
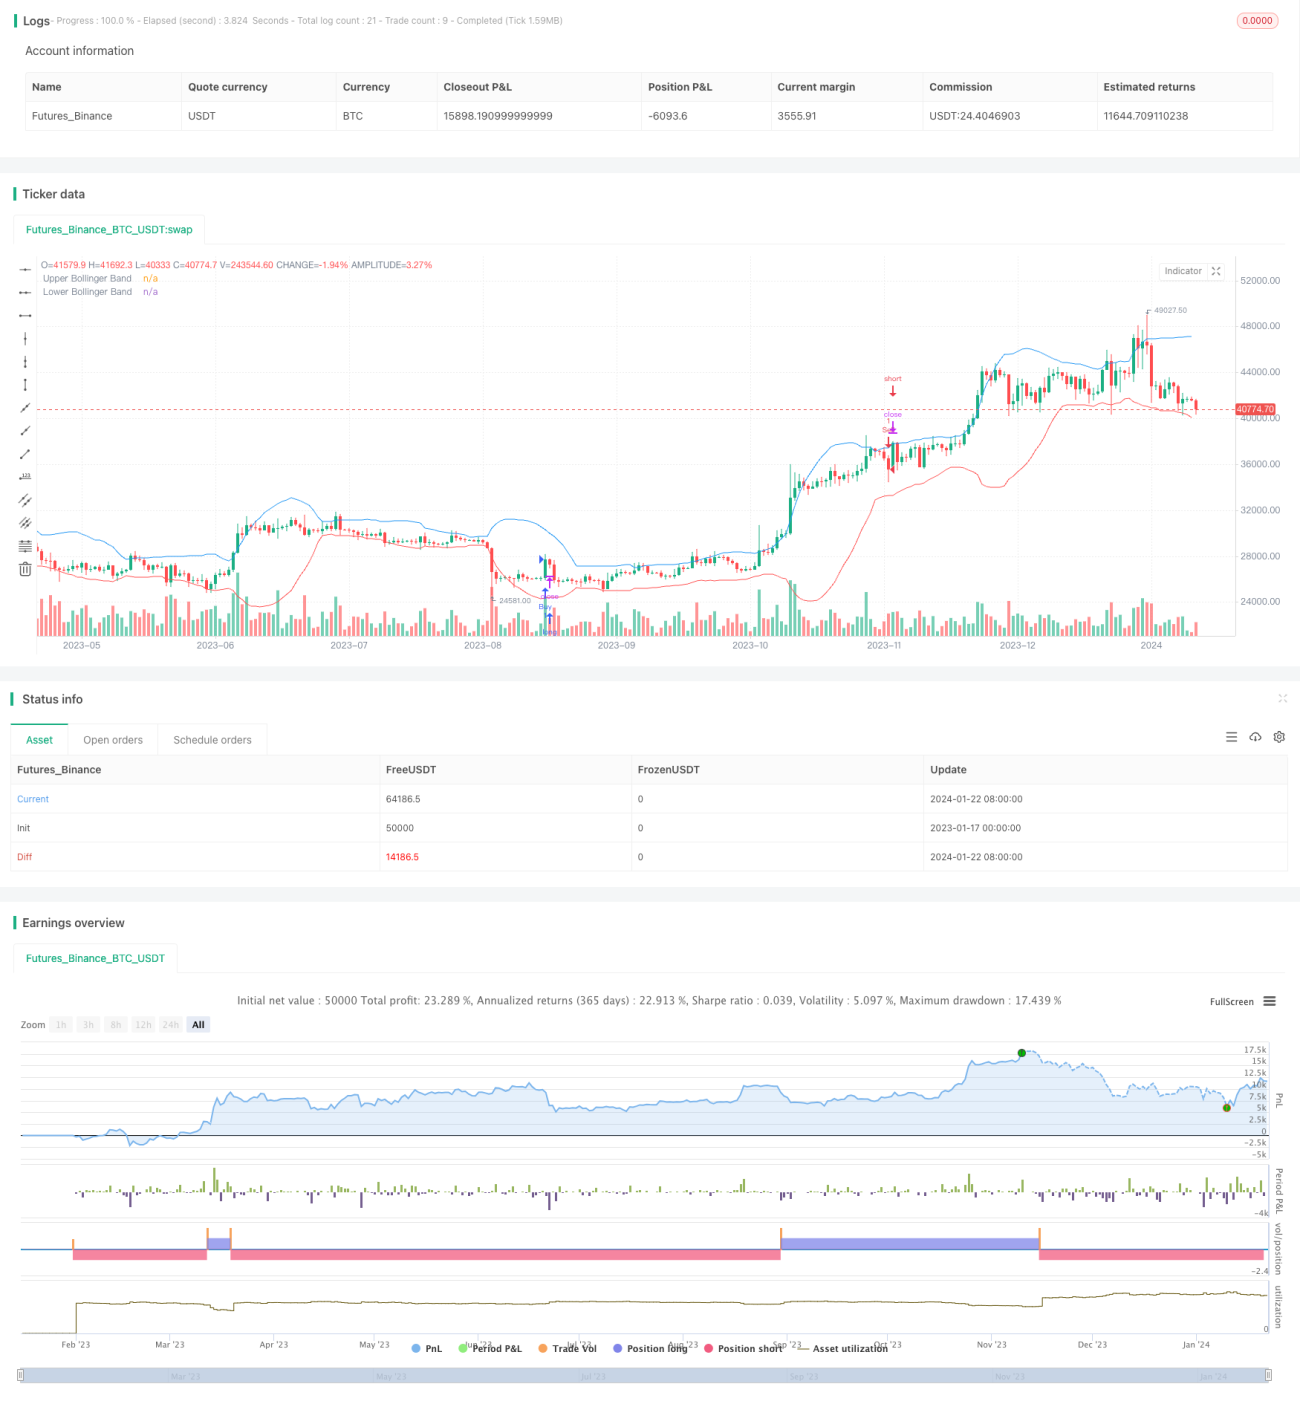
This strategy uses the RSI indicator to judge the overbought/oversold levels in the market, combined with Bollinger Bands to determine the price fluctuation range. In addition, dynamic support/resistance are generated based on high/low prices to trigger buy/sell orders only when the price is close to support/resistance levels. Users can set a trend filter condition, such as simple moving average, to ensure the price trend aligns with trade directions. This strategy integrates multiple technical indicators for robust signal accuracy and captures market opportunities effectively.
Strategy Logic
The strategy consists of 3 key components – RSI, Bollinger Bands and Dynamic S/R.
The RSI component judges overbought/oversold levels. RSI dropping below 30 suggests oversold condition and triggers buy signal. RSI rising above 70 suggests overbought condition and triggers sell signal.
Bollinger Bands are upper/lower bands calculated from price moving average and standard deviation, to determine if price has broken out of the normal fluctuation range. Price approaching upper band suggests a sell while lower band suggests a buy.
The S/R component uses a dynamic calculation method to generate key S/R levels based on historical high/low prices (or close/open prices) within certain lookback periods and percentage ranges, as well as historical price reversal points. It triggers sell signal when price rises to key resistance levels, and buy signal when price drops to support levels.
In summary, this strategy initiates buy/sell trades only when RSI overbought/oversold, price breaking out of Bollinger Bands, as well as proximity to dynamic S/R levels are met.
Advantages
-
Fundamental indicator RSI combined with technical analysis indicator Bollinger Bands. RSI judges overbought/oversold levels fundamentally while Bollinger Bands determines technical price patterns.
-
Dynamic S/R calculation adheres closer to actual S/R that governs price movement.
-
Adding a trend filter further improves signal accuracy by filtering out noise when combined with RSI and Bollinger Bands.
Risks
-
Improper RSI parameter settings may cause misjudgement. Too short RSI length increases noise. Incorrect overbought/oversold threshold setup also leads to errors.
-
Incorrect Bollinger Bands parameters such as length, StdDev multiplier affects judging accuracy.
-
Dynamic S/R relies on historical high/low prices thus tends to lag. Users should optimize S/R parameters for greater relevance to current price.
-
This strategy has relatively complex logic with multiple indicators potentially causing interference. Users should test parameters to reduce conflict. Simplifying entry criteria also helps minimize errors.
Optimization Directions
-
Test and optimize RSI parameters including length, overbought/oversold thresholds.
-
Test and optimize Bollinger Bands parameters including length and StdDev multiplier.
-
Optimize dynamic S/R parameters to align S/R levels closer to price, such as using shorter lookback periods or fewer historical high/low prices.
-
Test additional auxiliary indicators in combination with RSI, such as KDJ, MACD etc to improve accuracy.
-
Test and optimize trend filter parameters, filter length in particular, to extend holding period and reduce unnecessary reverse orders.
Conclusion
This strategy leverages the strengths of multiple indicators like RSI, Bollinger Bands and Dynamic S/R, with extensive cross verification for robust signal accuracy. Adding a trend filter further reduces noise. With flexible parameter tuning, users can optimize this strategy to best suit their needs. Proper parameter testing and optimization will lead to more pronounced performance. This is a highly promising quantitative strategy.
- 1