Golden Cross SMA Trading Strategy

Overview
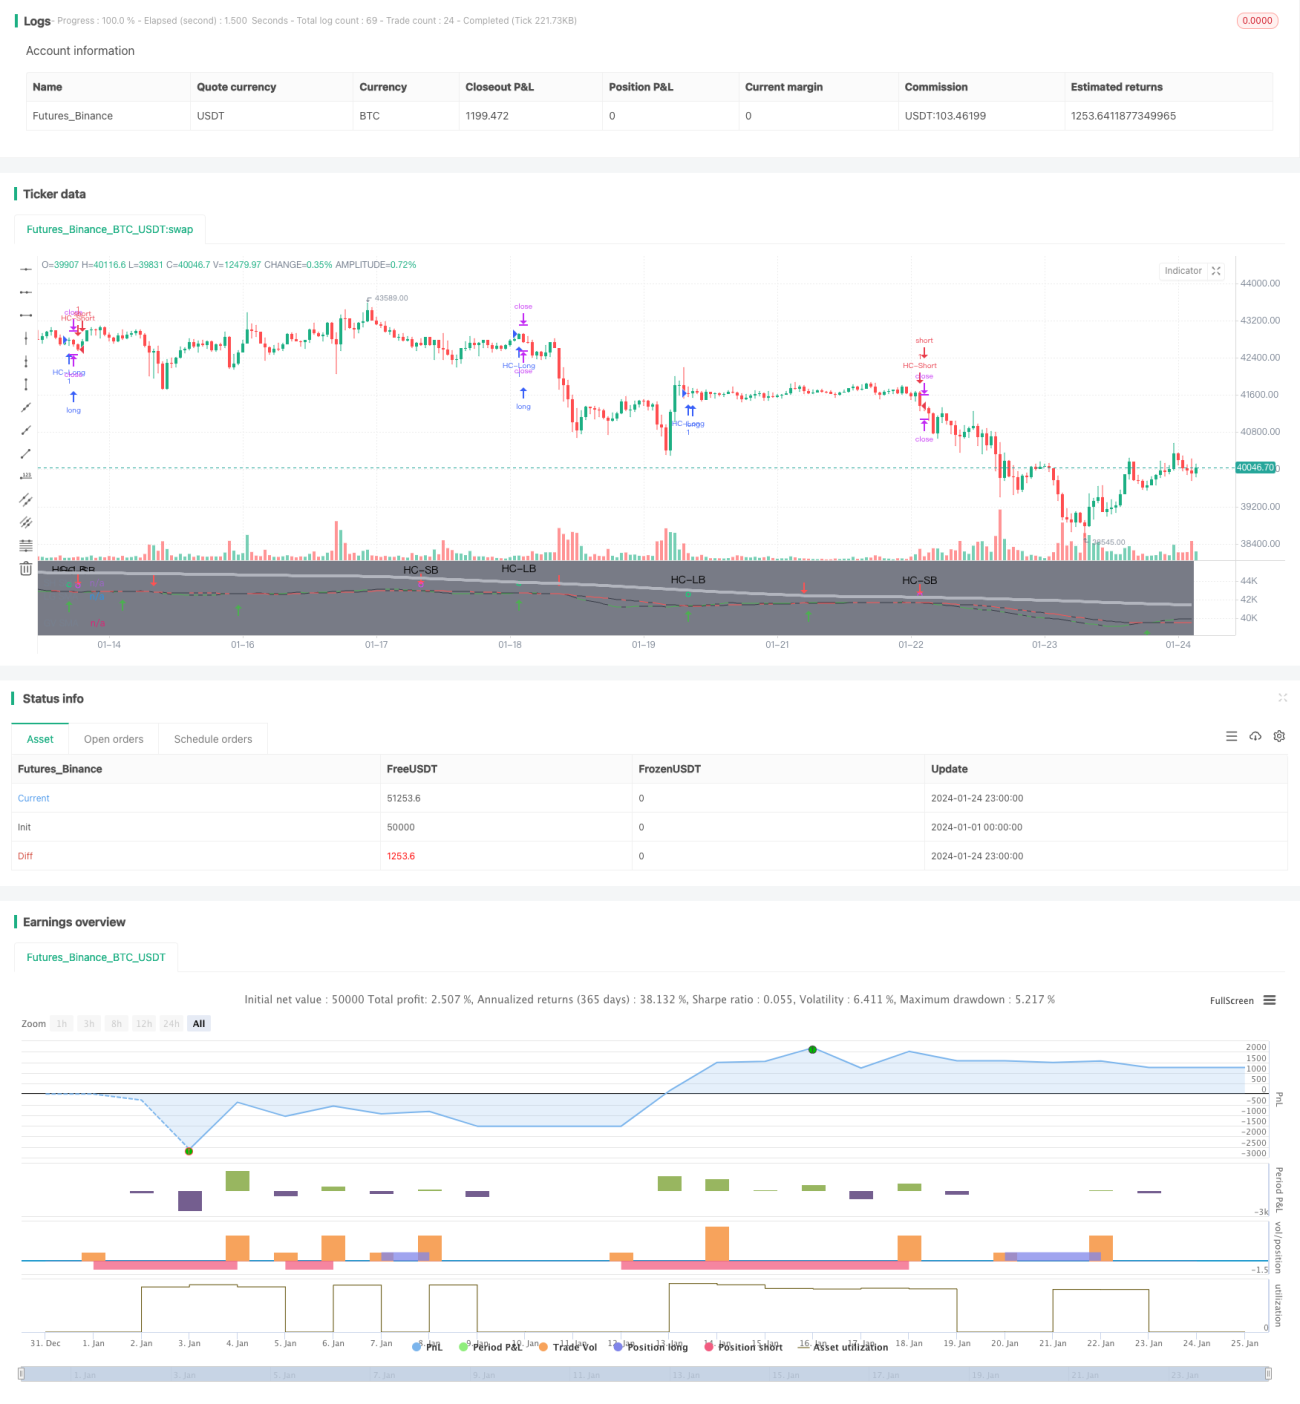
The golden cross SMA trading strategy generates buy and sell signals based on the crossover between two moving averages of different timeframes. Specifically, when the faster moving average crosses above the slower moving average from below, a golden cross is formed, indicating a bullish trend reversal. When the faster MA crosses below the slower MA from above, a death cross is formed, indicating a bearish trend reversal.
Principles
The strategy is based on two principles:
-
Moving averages can reflect market trend and momentum. The shorter-term MA captures recent price moves and reversals. The longer-term MA shows the prevailing trend.
-
When the faster MA forms a golden cross with the slower MA, it indicates the short-term momentum is gaining strength over the long-term trend, hence likely the start of an uptrend. The death cross indicates the long-term downtrend is dominating, thus likely a continued downtrend.
Specifically, this strategy uses 13 and 30-period simple moving averages and trades their crossover signals. The crossover logic is:
-
The golden cross between the MAs generates a long signal, indicating buying opportunity. The viability of the signal is evaluated by requiring an persisting uptrend over some minimum period to confirm bull trend.
-
The death cross between the MAs generates a short signal. Similarly, a persisting downtrend is required to confirm viability of the signal for shorting.
-
The slope difference between the MAs are used to gauge the strength of the crossover signals. Only when the difference exceeds a threshold would the signal be considered strong enough to trade on. This helps eliminate false signals.
-
Stop loss is set at 20% and take profit at 100%.
Advantages
The SMA crossover strategy has the following advantages:
-
The logic is simple and easy to understand, suitable for beginners.
-
Utilizes price averaging to filter out noise and avoid being misguided by short-term fluctuations.
-
Evaluates trend persistence instead of just blindly following crossover signals, ensuring greater confirmation with overall market conditions.
-
Introduces slope momentum factor on the MAs to make signals more reliable.
-
Easy backtesting and optimization with just a few key parameters like MA periods and trend duration.
Risks
The strategy also has the following risks:
-
Crossover signals are lagging by nature and cannot perfectly predict reversals. Delay risk exists. Should use shorter MAs or combine with predictive indicators.
-
Mechanical systems tends to trigger simultaneous trades, exacerbating momentum and invalidating stop loss / take profit. Should use staged exits or manual override.
-
Does not perform well in choppy sideways markets. Should avoid such instruments and focus on trending pairs.
-
Performance depends greatly on properly calibrated parameters like trend duration. Requires iterative testing to find optimum values.
Optimization Directions
The strategy can be further optimized by:
-
Adding higher timeframe trend evaluation to avoid counter-trend trades. For example using weekly or monthly prices.
-
Requiring trading volume confirmation to eliminate false signals. Only trade signals with expanding volume.
-
Optimizing MA parameters to find best periods combination. Consider adaptive moving averages.
-
Incorporate popular indicators like MACD, KD to assist signal confirmation and accuracy.
-
Adopt staged stop loss / take profit to better control risk.
Conclusion
The SMA crossover strategy is highly intuitive and easy to interpret. It combines the noise filtering property of moving averages with the simple trend identification capability of crossover signals. The additional signal confirmation provides greater practicality and stability. On top of the improvements covered, there remains ample room for further optimization, making this a worthwhile strategy to research on.
/*backtest
start: 2024-01-01 00:00:00
end: 2024-01-25 00:00:00
period: 1h
basePeriod: 15m
exchanges: [{"eid":"Futures_Binance","currency":"BTC_USDT"}]
*/

//@version=4

// This source code is subject to the terms of the Mozilla Public License 2.0 at https://mozilla.org/MPL/2.0/
// © MakeMoneyCoESTB2020- 1