Gradual BB KC Trend Strategy

Overview
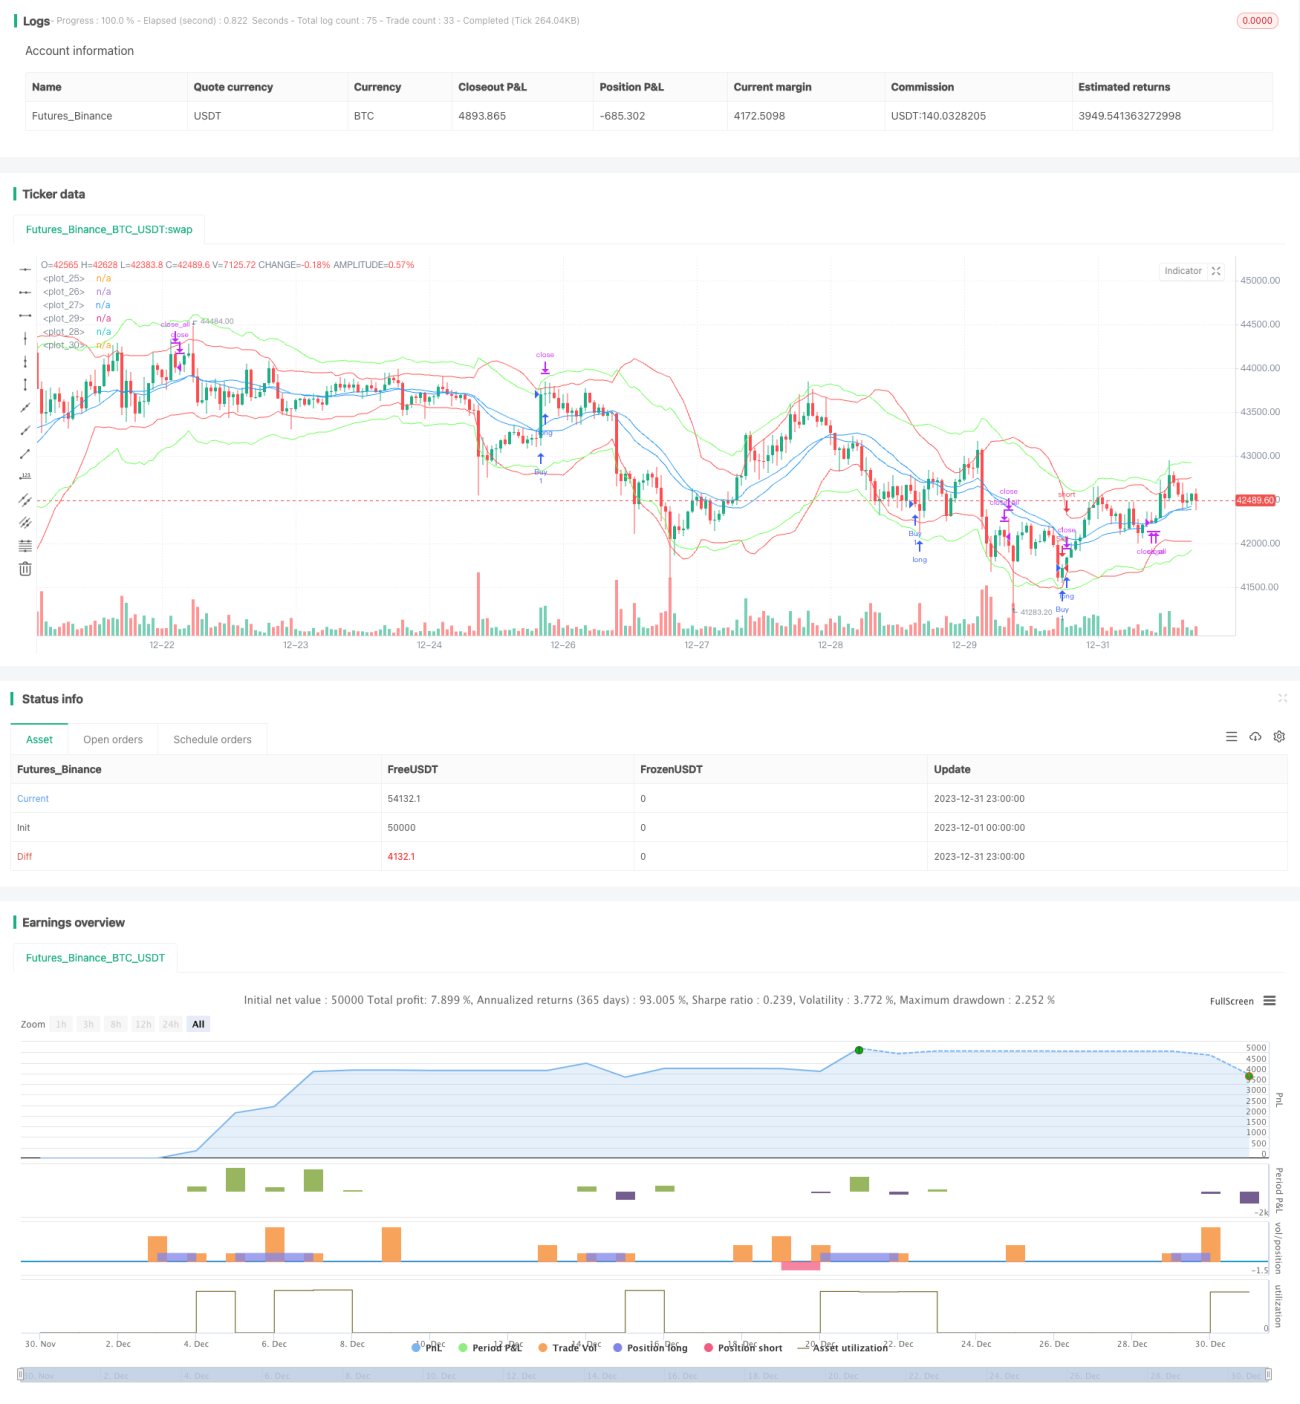
This strategy uses a combination of Bollinger Bands and Keltner Channel signals to identify market trends. Bollinger Bands are a technical analysis tool that defines channels based on price volatility ranges. The Keltner Channel signal combines price volatility and trending to determine support or resistance levels. This strategy utilizes the advantages of both indicators by judging if a golden cross occurs between the Bollinger Bands and Keltner Channels to find long and short opportunities. It also incorporates trading volume to verify the validity of signals, which can effectively identify the beginning of trends and maximize the filtering of invalid signals.
Strategy Principles
- Calculate the middle, upper, and lower Bollinger Bands over 20 periods. The band width is defined as 2 standard deviations.
- Calculate the middle, upper, and lower Keltner Channels over 20 periods. The channel width is defined as 2.2 times the true range.
- When the Keltner Channel upper line crosses above the Bollinger Band upper line and the volume is greater than its 10 period moving average, go long.
- When the Keltner Channel lower line crosses below the Bollinger Band lower line and the volume is greater than its 10 period moving average, go short.
- Close all positions if no exit signals trigger after 20 bars since entry.
- Set a 1.5% stop loss for long trades and -1.5% stop loss for short trades. Set a 2% trailing stop for long trades and -2% trailing stop for short trades.
This strategy mainly relies on the Bollinger Bands to judge volatility ranges and momentum. The Keltner Channel serves as a verification tool due to its similar characteristics but differing parameters. Using these two indicators together improves signal accuracy. Incorporating trading volume also helps filter out invalid signals.
Strength Analysis
- Utilizes the combined advantages of Bollinger Bands and Keltner Channels to improve signal accuracy.
- Filtering by trading volume reduces invalid signals from frequent line touches.
- Effective risk control from programmed stop loss and trailing stop mechanisms.
- Quick exits and loss limiting from forced profit taking after invalid signals.
Risk Analysis
- Both Bollinger Bands and Keltner Channels are based on moving averages and volatility. They can produce false signals in ranging markets.
- No compounding mechanism means multiple stop outs may lead to oversized losses.
- Reversal signals occur frequently. Parameter tweaks may cause trend opportunities to be missed.
Widening stop loss ranges or adding confirming indicators like MACD can reduce risks from false signals.
Optimization Directions
- Test parameter impacts on strategy return, like lengths, standard deviation multiples etc.
- Add other indicators for signal confirmation, e.g. KDJ, MACD.
- Use machine learning for automated parameter optimization.
Summary
This strategy combines Bollinger Bands and Keltner Channels to identify trends, verified by trading volume. Further enhancements like parameter optimization and adding indicators will strengthen it for more market regimes. It has strong feasibility as an easy to grasp and customizable trading strategy.
- 1