Market Cypher Wave B Automated Trading Strategy

Overview
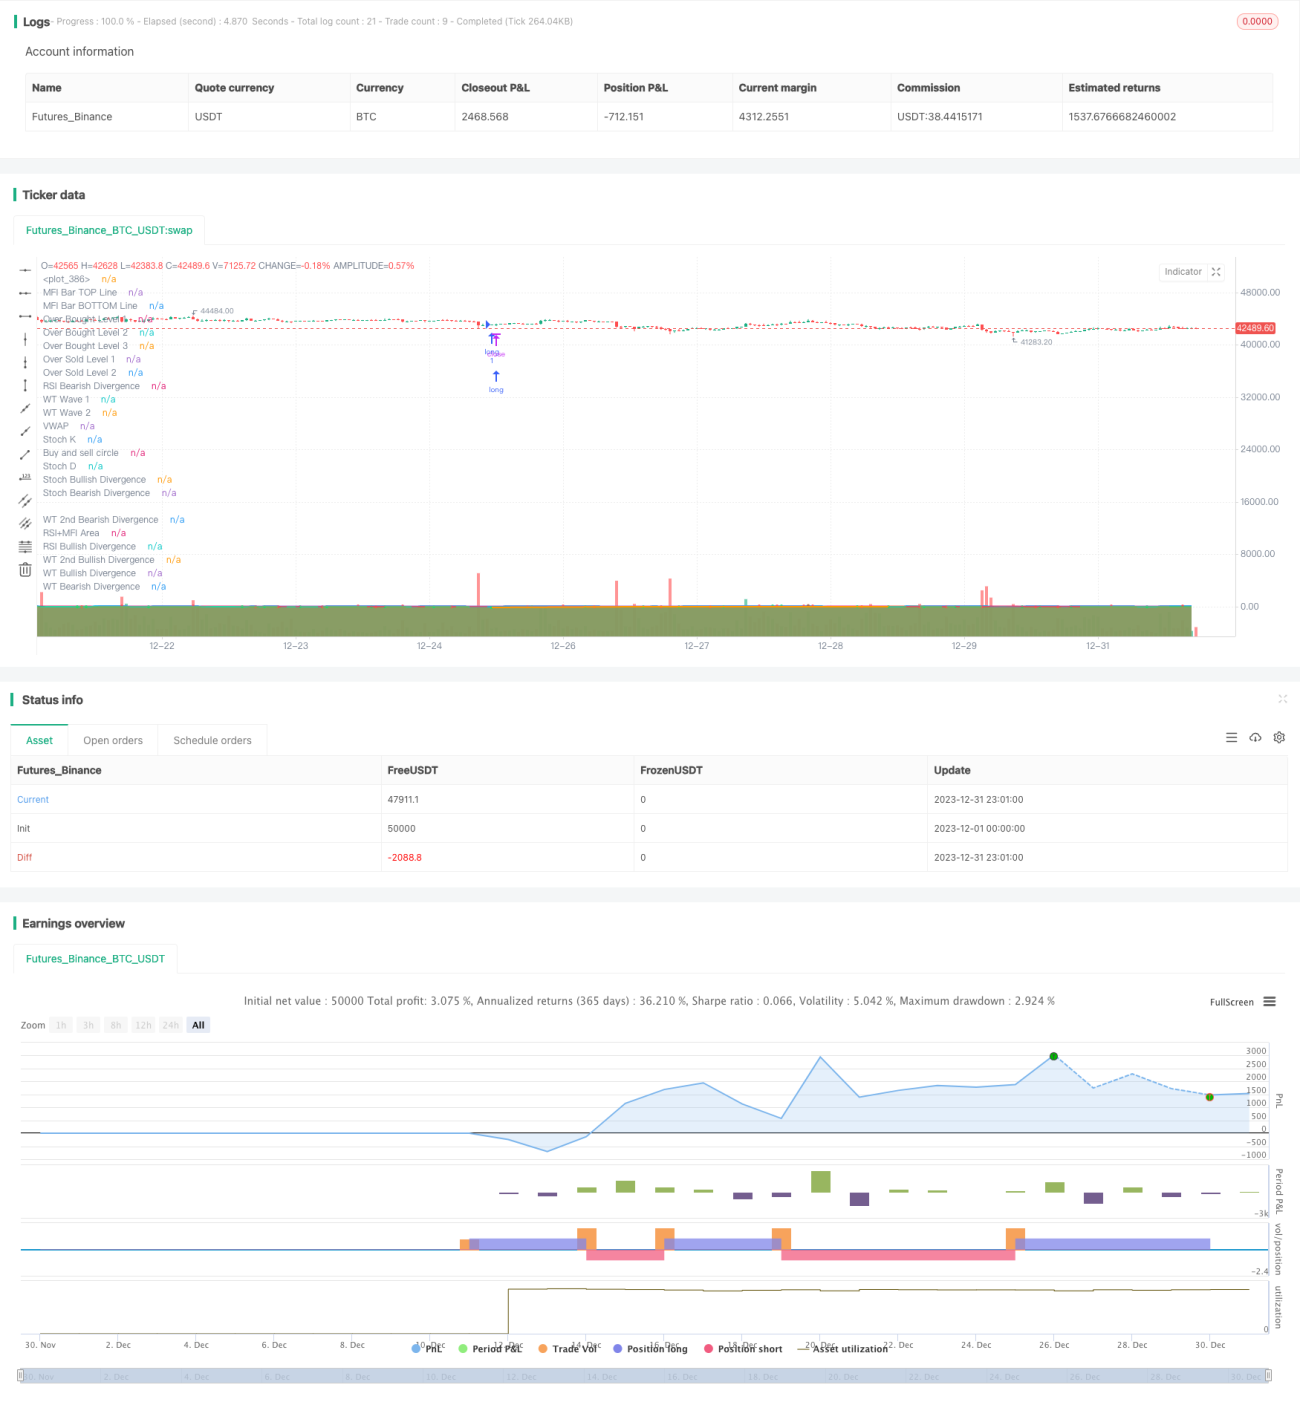
This strategy utilizes the wave theory from Market Cypher indicator and combines multiple technical indicators to implement automated trading. It can identify opportunities when trend starts and track the trend.
Strategy Principles
The strategy is mainly based on Market Cypher Wave B indicator. The indicator divides price action into two layers, Wave 1 and Wave 2. Wave 1 is more sensitive while Wave 2 is more smooth. Their crossover works as trading signals. When Wave 1 crosses above Wave 2, it's buying opportunity. When crosses below, it's selling opportunity.
The code calculates Wave 1 and Wave 2 using the Wavetrend function. Then it determines wave direction together with overbought/oversold area. For example, when Wave 1 crosses below Wave 2 while Wave 2 is in overbought area, it triggers a sell signal.
In addition, the code also incorporates multiple auxiliary indicators to improve decision accuracy, including:
-
Extreme area: Identify price fluctuation levels combining RSI and Money Flow Index
-
KD: Judge bullish/bearish momentum
-
Divergence: Locate buying/selling turning points
-
Flags: Judge trend persistency
Finally, it makes trading decisions based on Waves and auxiliary indicators.
Strategy Advantages
The biggest strength of this strategy is the ability to adapt to different market environments. Specifically:
-
Multiple indicators combined improve decision accuracy
The strategy uses not only Wave crossover itself, but also RSI, KD, divergence etc. By combining signals, it improves accuracy.
-
Flags catch trends
With flags, the strategy can effectively determine trend persistency and avoid false signals. This allows it to identify trend opportunities early on and excell at trend following.
-
Highly customizable
The strategy has many adjustable parameters. Users can optimize based on their own market views and adapt to more complex environments. This makes the strategy widely applicable.
Risks
There are also some potential risks:
-
Conflicting signals between indicators
With many indicators, there could be conflicting signals in extreme market conditions. This introduces uncertainty in final decisions.
-
Difficult to optimize parameters
Too many parameters makes optimization challenging. It requires lots of backtesting to find optimal parameter sets and risks overfitting.
-
Potentially too frequent trading
In ranging markets, Wave crossover may happen frequently and incur excessive trading costs.
Corresponding improvements include:
-
Introduce more filters to ensure decision robustness
-
Prioritize parameters with higher strategy impact
-
Expand stop loss to lower trading frequency
Summary
In summary, this strategy combines Market Cypher wave theory and various indicators to achieve automated identification of trading signals and trend tracking. With high customizability, it adapts well and excels at catching trends. Meanwhile, potential risks call for continuous improvements like more robust rules and better parameter tuning to make the strategy more robust.
- 1