Bollinger Bands and RSI Combination Strategy

Overview
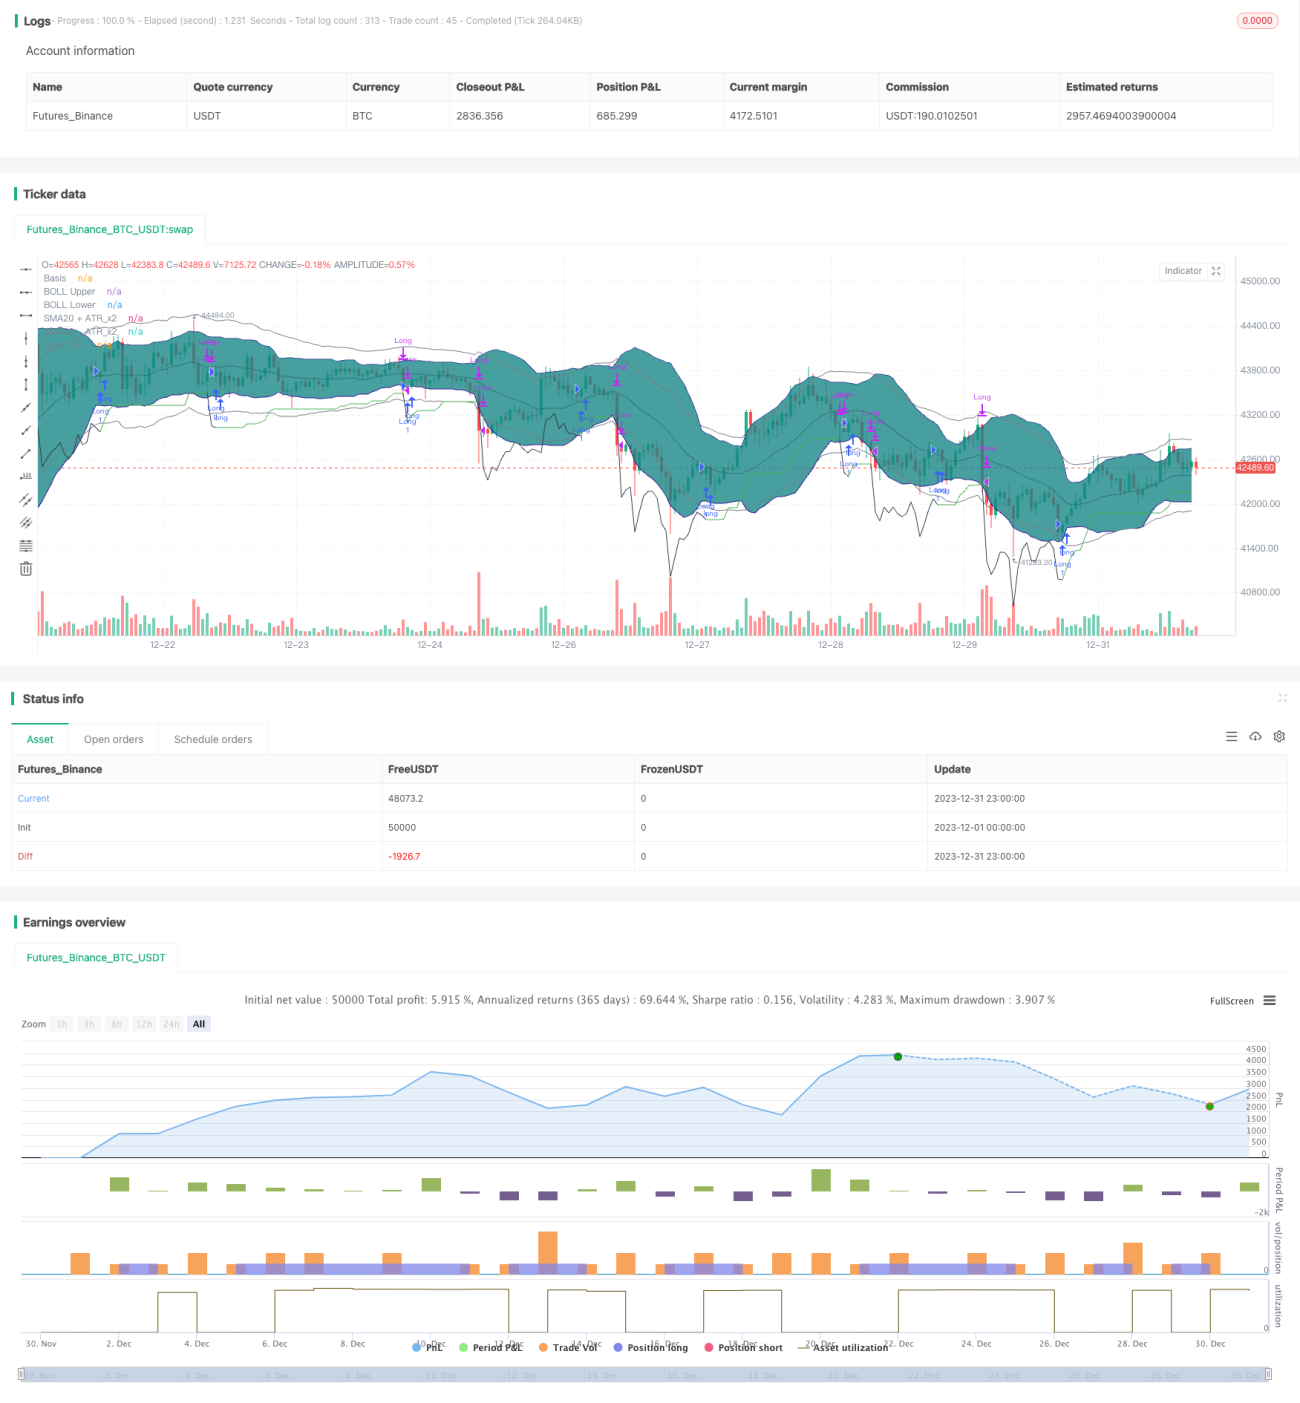
This strategy combines Bollinger Bands and Relative Strength Index (RSI) to identify opportunities when Bollinger Bands are squeezing and RSI is rising, with trailing stop loss to control risks.
Strategy Logic
The core logic of this strategy is to identify Bollinger Bands squeeze and predict price breakout when RSI is in uptrend. Specifically, when 20-period BB middle band standard deviation is less than ATR*2, we determine BB squeeze happening; meanwhile, if both 10 and 14 period RSI are rising, we predict prices may break above BB upper band soon and go long.
After entering the market, we use ATR safety distance + adaptive stop loss to lock profit and manage risks. Positions will be closed when price hits stop loss or RSI becomes overbought (14-period RSI above 70 and 10-period RSI exceeds 14).
Advantage Analysis
The biggest advantage of this strategy is to identify consolidation period with BB squeeze and predict breakout direction with RSI. Also, using adaptive stop loss based on market volatility rather than fixed stop loss can better lock profit while controlling risk.
Risk Analysis
The major risk of this strategy is misidentification of BB squeeze and RSI uptrend, which may lead to false breakout. Besides, adaptive stop loss may fail to close positions timely during high volatility. Improving stop loss methods like curve stop loss can mitigate this risk.
Optimization Guidelines
This strategy can be further optimized in the following aspects:
-
Improve BB parameters to identify squeeze more accurately
-
Test different values for RSI periods
-
Examine other stop loss techniques like curve SL or back-looking SL
-
Adjust parameters based on symbol characteristics
Conclusion
This strategy leverages the complementarity of BB and RSI to achieve good risk-adjusted returns. Further optimizations on aspects like stop loss and parameter tuning can make it fit better for different trading instruments.
- 1