True Relative Movement Moving Average Strategy

Overview
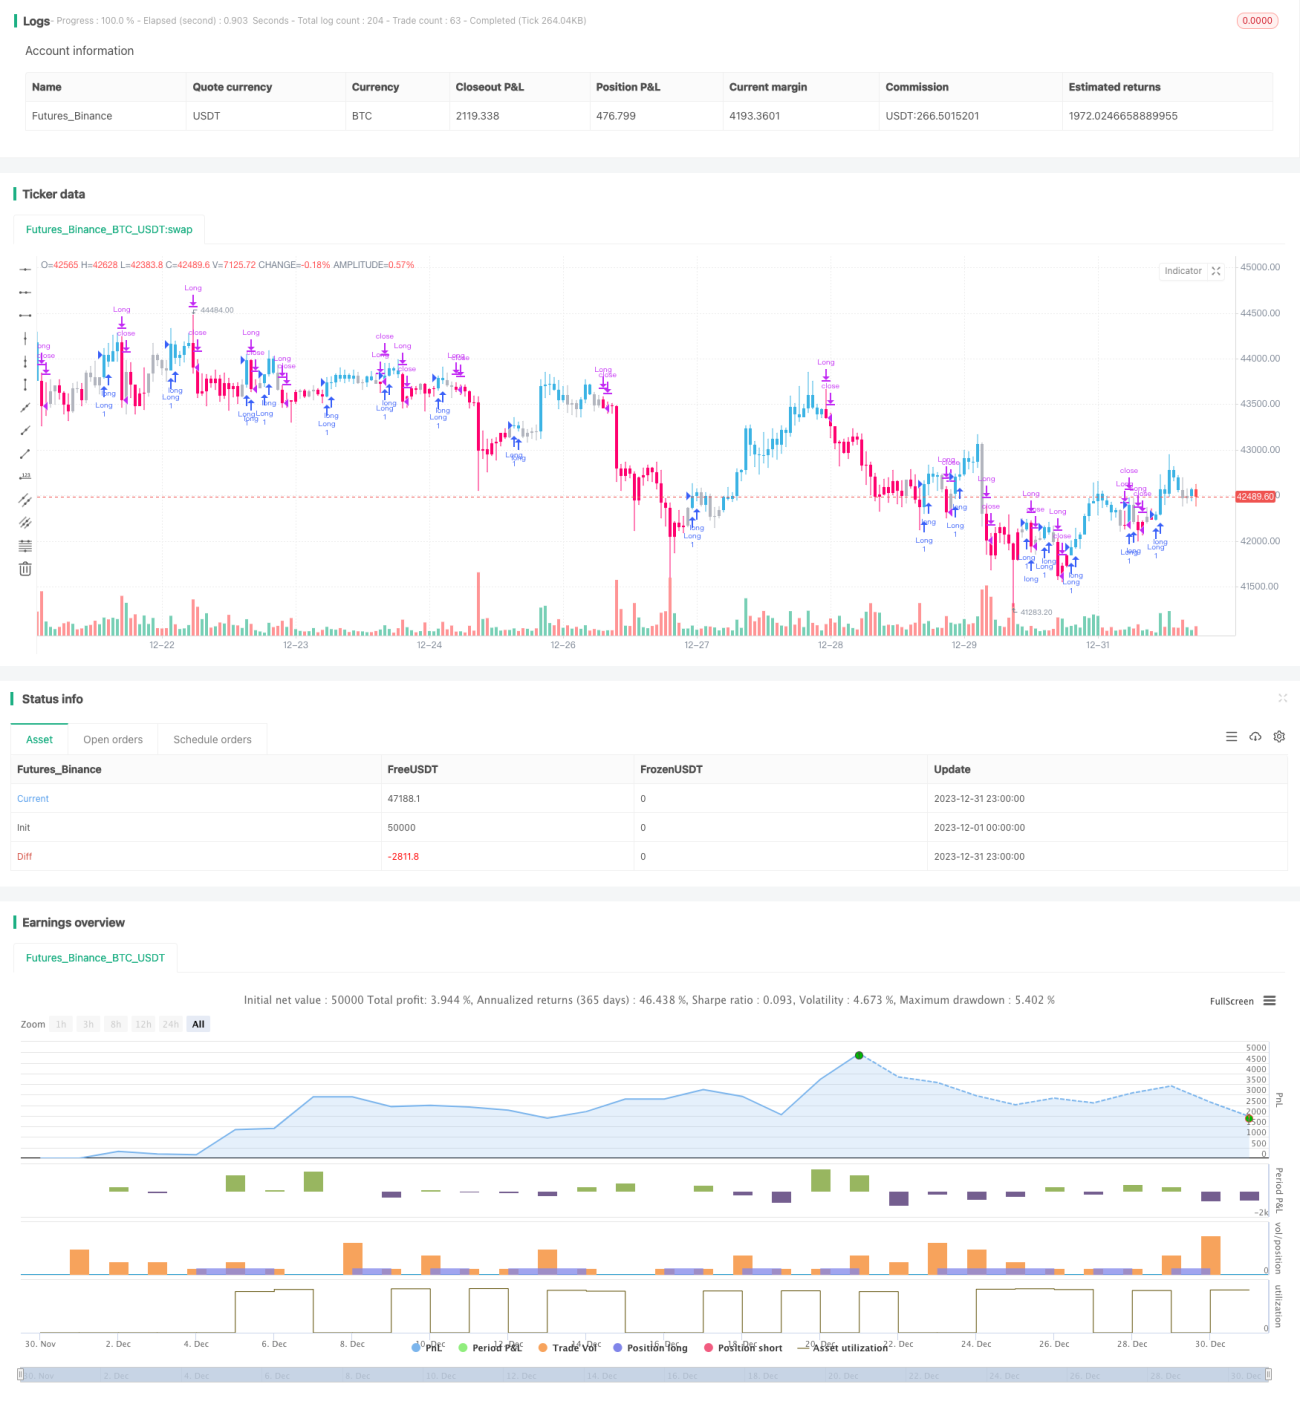
The True Relative Movement Moving Average (TRMMA) strategy is a trend-following strategy that combines the Relative Strength Index (RSI) and True Strength Index (TSI). It uses the indicators of RSI and TSI to generate buy and sell signals, with moving averages for strategy optimization.
Principles
The strategy consists of the following main parts:
-
TSI Calculation
Calculate the exponential smoothed value of the rate of price changes through double exponential smoothing, then divide it by the exponential smoothed value of the absolute rate of price changes to obtain the TSI indicator. The long term is 25 days, the short term is 5 days, and the signal line is 14 days. -
RSI Calculation
RSI indicator with close price as input and length of 5 days. -
Signal Judgment
A buy signal is generated when TSI crosses above its signal line and RSI crosses above 50. A sell signal is generated when TSI crosses below its signal line and RSI crosses below 50. -
Candlestick Coloring
Color the candlesticks based on signals to assist judgment. -
Strategy Parameters
Set parameters like position ratio and capital.
Advantage Analysis
The strategy combines the TSI and RSI indicators to effectively judge market trends and overbought/oversold situations, thus generating trading signals. Compared with using TSI or RSI alone, it can filter out more false signals. In addition, compared with the default parameters, this strategy adopts a more aggressive setting of TSI and RSI parameters to obtain earlier and higher quality trading signals.
Risk Analysis
The main risks of this strategy include:
-
Parameter optimization risk. The optimal parameters of TSI and RSI may differ across markets, products, and timeframes. Parameters need to be optimized for specific situations.
-
Trend reversal risk. The strategy itself focuses on trends. Sudden events that cause short-term adjustments or medium-to-long term trend reversals will result in greater losses for the strategy.
-
Frequent signal risk. Compared with default parameters, this strategy uses a more aggressive parameter setting, which may generate more frequent trading signals, bringing higher trading costs and implementation difficulties.
Optimization Directions
The strategy can be optimized in the following aspects:
-
Further filter signals by combining with moving averages and other indicators to reduce frequent trading.
-
Test the optimal combination of TSI and RSI parameters in different markets and products to find the best parameter settings.
-
Increase stop loss strategies to control the risk of single loss.
-
Optimize position management, increase positions when the trend is stronger, and reduce positions when the trend turns weak.
Conclusion
The TRMMA strategy combines the TSI and RSI indicators to determine entry and exit timing, with strong trend capturing capability. Compared with using TSI or RSI alone, it can effectively filter out false signals. The stability of the strategy can be further enhanced through parameter optimization, stop loss strategies, position management, etc. The strategy is suitable for investors with some quantitative basis who pursue high returns.
/*backtest
start: 2023-12-01 00:00:00
end: 2023-12-31 23:59:59
period: 1h
basePeriod: 15m
exchanges: [{"eid":"Futures_Binance","currency":"BTC_USDT"}]
*/

// "True relative Movement" or "TRM" for short is a system that combines my two favorite indicators: RSI and TSI. I strived to put together an indicator that combined the best of both
// in order to help discretionary traders predict market direction, weakness and strength. As with most technical indicators there are "Buy and sell" signals. Similiar to Elder Impulse system,
///TRM paints bars 3 different colors to display 3 different conditions: Blue for "Buy", Pink for "Sell", and gray for "Take profit/Hold". When the bars turn blue, that means all conditions
/// have been met. When they turn pink, no conditions have been met. When they are gray, only one condition has been met. The system is simple, yet effective. A buy signal is prodcued when - 1