Trend Trading Strategy Based on Price Channel of Double Moving Averages

Overview
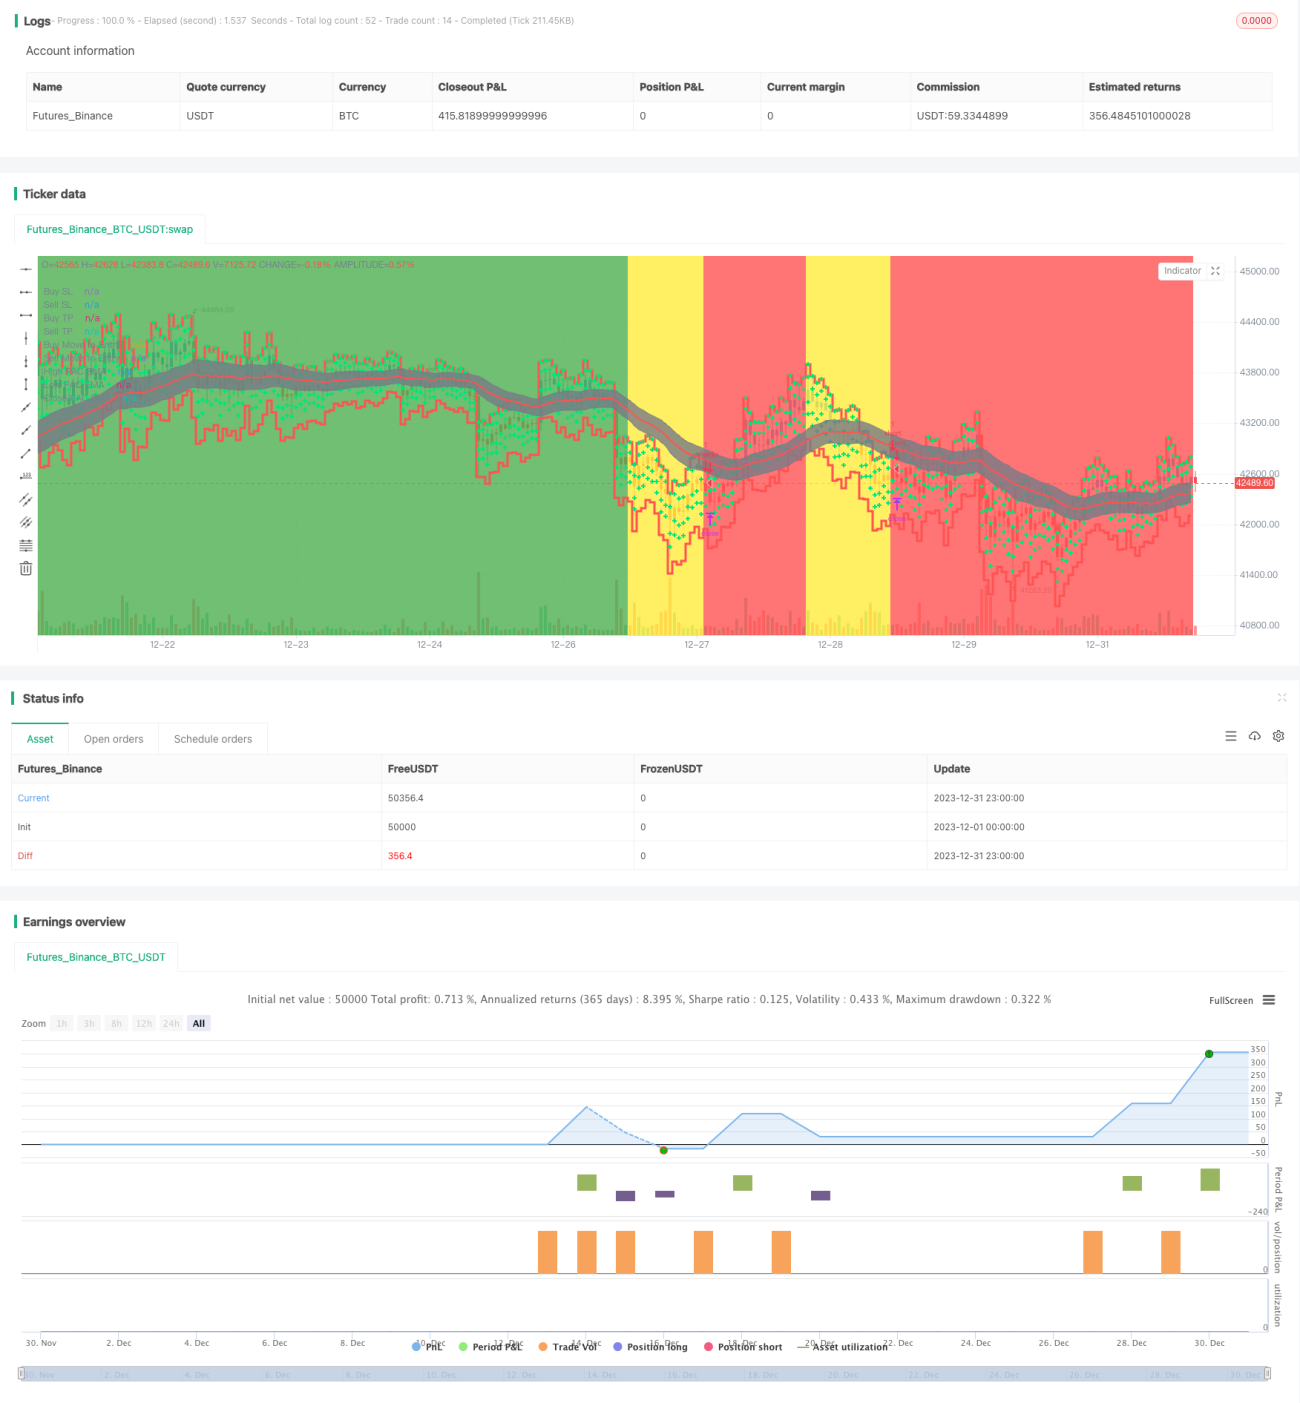
This is a trend following strategy based on the price channel built with double moving averages. It uses the channel range to determine the price trend direction and sets a trailing stop loss to lock in profits.
Strategy Logic
The double moving average price channel strategy uses fast EMA and slow EMA to build the price channel. The fast EMA has a parameter of 89 periods and the slow EMA has a parameter of 200 periods. At the same time, three EMAs based on high price, low price and close price are used to build the channel range. The upper rail and lower rail of the channel are 34-period high price EMA and low price EMA respectively.
When the fast EMA is above the slow EMA and the price is below the lower rail, it is determined as an upward trend. When the fast EMA is below the slow EMA and the price is above the upper rail, it is determined as a downward trend.
During an upward trend, the strategy will open short positions when the trend reversal is identified. During a downward trend, the strategy will open long positions when the trend reversal is identified.
In addition, the strategy has a trailing stop loss function. After opening positions, the trailing stop loss price will be updated in real time to lock in profits.
Advantage Analysis
The biggest advantage of this strategy is that it uses the double moving average price channel to determine the price trend, combined with reversal trading to avoid chasing highs and selling lows. At the same time, it has a trailing stop loss function to lock in profits and reduce the risk of losses.
Other advantages include: large parameter optimization space that can be adjusted for different products and cycles; real-time update of stop loss price with low operating risk.
Risk Analysis
The main risk of this strategy is that the effectiveness of identifying reversal signals may not be ideal and misjudgments may occur. In this case, parameters need to be optimized to ensure the effectiveness of determining trend reversals.
In addition, the setting of stop loss points is also very critical. If the stop loss point is too high, the stop loss may not be decisive enough. If the stop loss point is too low, there may be excessive stop loss situations. This needs to be adjusted according to specific products.
Finally, data problems can also lead to strategy failure. It is necessary to ensure that credible, continuous and sufficient historical data is used for backtesting and live trading verification of the strategy.
Optimization Directions
The main areas for optimizing this strategy include:
-
The periods of the fast EMA and slow EMA can be optimized by testing different parameter combinations to determine the effect
-
The parameters of the upper and lower rails of the price channel can also be adjusted to find more suitable cycle parameters
-
The setting of stop loss points is critical and can be optimized by testing different parameters
-
Test whether introducing other indicators to determine trend reversal can improve trading performance
Conclusion
The overall operation process of this strategy is reasonable and smooth. It uses the double moving average channel to determine the trend direction for trading, and has a trailing stop loss to lock in profits. Through parameter optimization and risk management optimization, this strategy can become an efficient quantitative trading strategy.
- 1