Improved Wave Trend Tracking Strategy

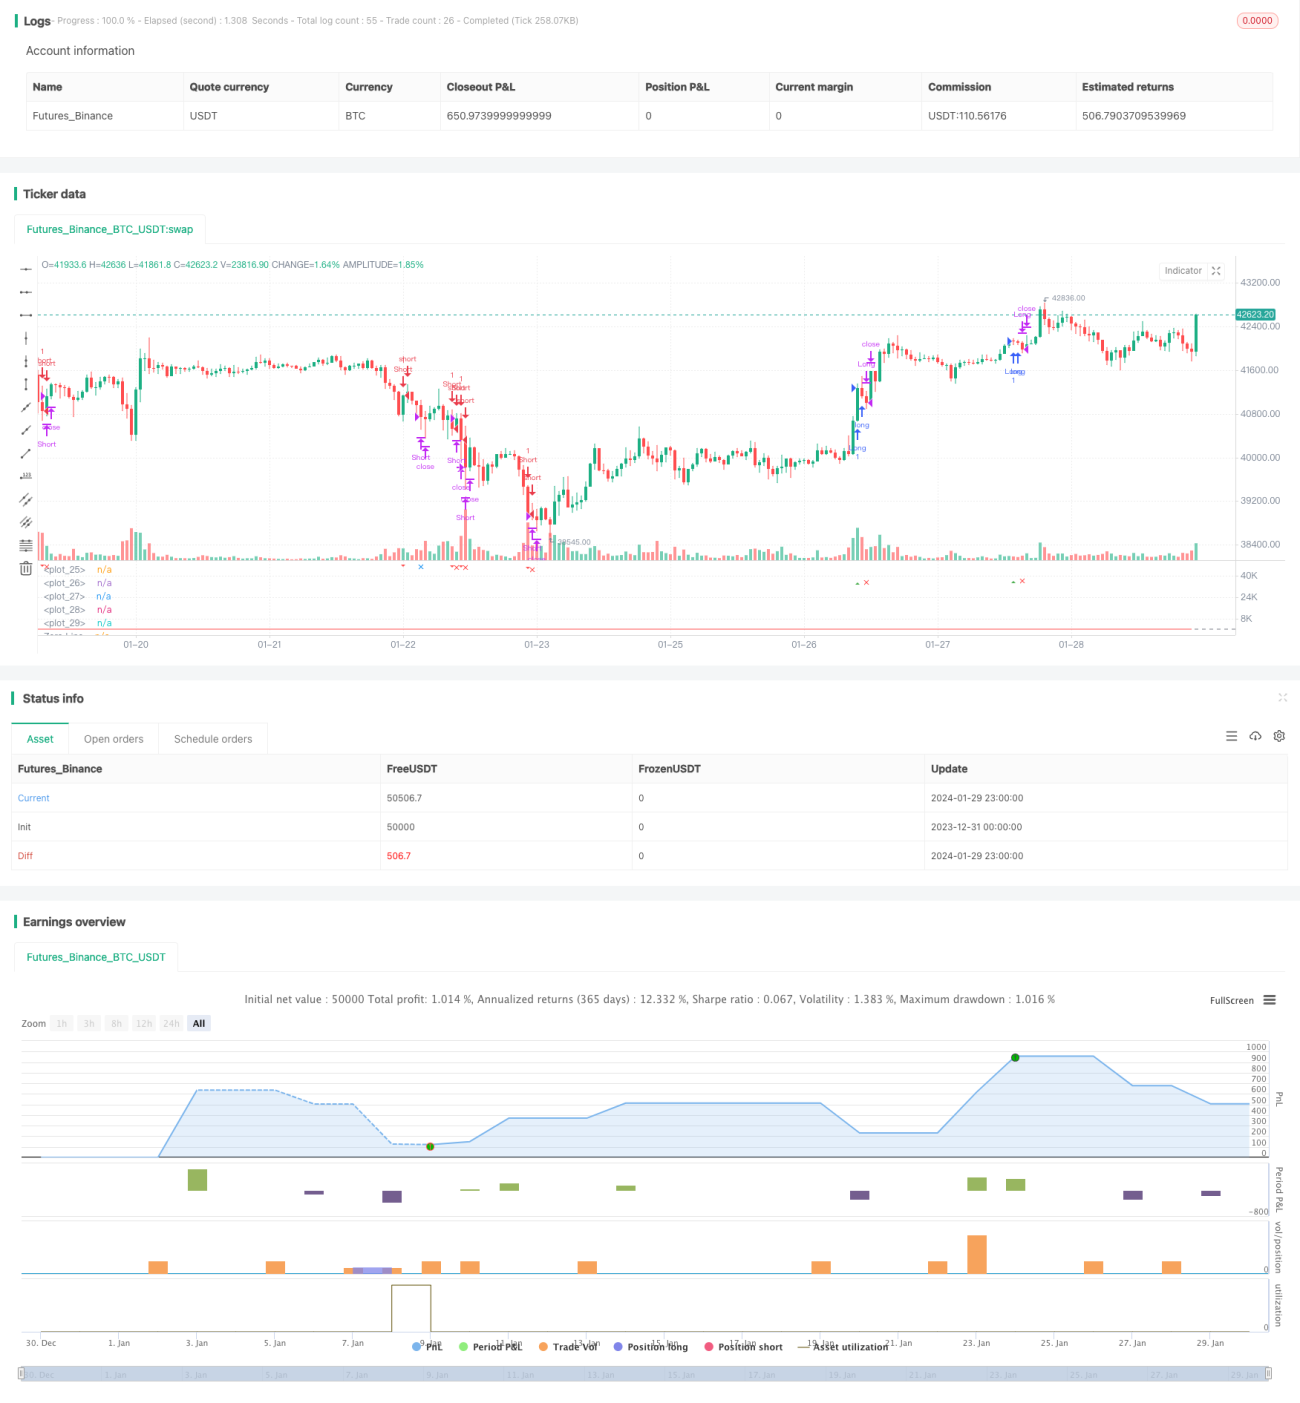
Overview: This is a trend following strategy that utilizes the Wave Trend oscillator to identify trends. It calculates exponential moving averages of the average price and absolute price difference to plot a Wave Trend line. Trading signals are generated when the Wave Trend line crosses overbought/oversold zones. Additional filters on moving average and volume avoid false signals.
Strategy Logic:
-
Calculate average price ap = (high + low + close)/3
-
Compute n1-period EMA of ap to get esa
-
Compute n1-period EMA of absolute difference between ap and esa to get d
-
Compute Wave Trend line: ci = (ap - esa)/(0.015*d)
-
Compute n2-period EMA of ci to get final wave trend line tci, i.e. wt1
-
Compute 4-period SMA of wt1 to get wt2
-
Plot overbought/oversold level lines obLevel1/2 and osLevel1/2
-
Generate buy signal when wt1 crosses over obLevel2; generate sell signal when wt1 crosses below osLevel2
-
Add moving average emaFilter and volume filter volumeFilter as filters to avoid false signals
-
Set take profit/stop loss after entry to exit positions
Advantages:
-
Wave Trend line handles trend/counter-trend transitions well
-
Reliability improved through dual filters of moving average and volume
-
Multiple parameters avoid limitations of single indicator
-
Take profit/stop loss locks in profits and controls risk
Risks and Limitations:
-
Choice of parameters can lead to poor performance or overfitting
-
No definitive guidance on optimal parameters
-
Ignores broader market conditions
-
Risk of whip-saws in range-bound/choppy markets
-
Lack of exit rules besides take profit/stop loss
Enhancement Opportunities:
-
Test parameters across timeframes/assets to find optimal values
-
Incorporate volatility metrics to avoid low volatility regimes
-
Add indicators like RSI to improve signal accuracy
-
Build machine learning model to find optimal tailored parameters
-
Enhance exits with trailing stops or volatility event based exits
Conclusion:
This is a trend following strategy incorporating the Wave Trend indicator with additional filters. It capitalizes on the Wave Trend line's ability to identify trend transitions, uses moving average and volume filters to avoid false signals, and aims to capture most medium/long term trends. Take profit/stop loss is used to control risk. Significant opportunity exists to improve performance across more instruments and timeframes by optimizing parameters, adding more indicators, and techniques like machine learning.
- 1