Renko ATR Trend Reversal Strategy

Overview
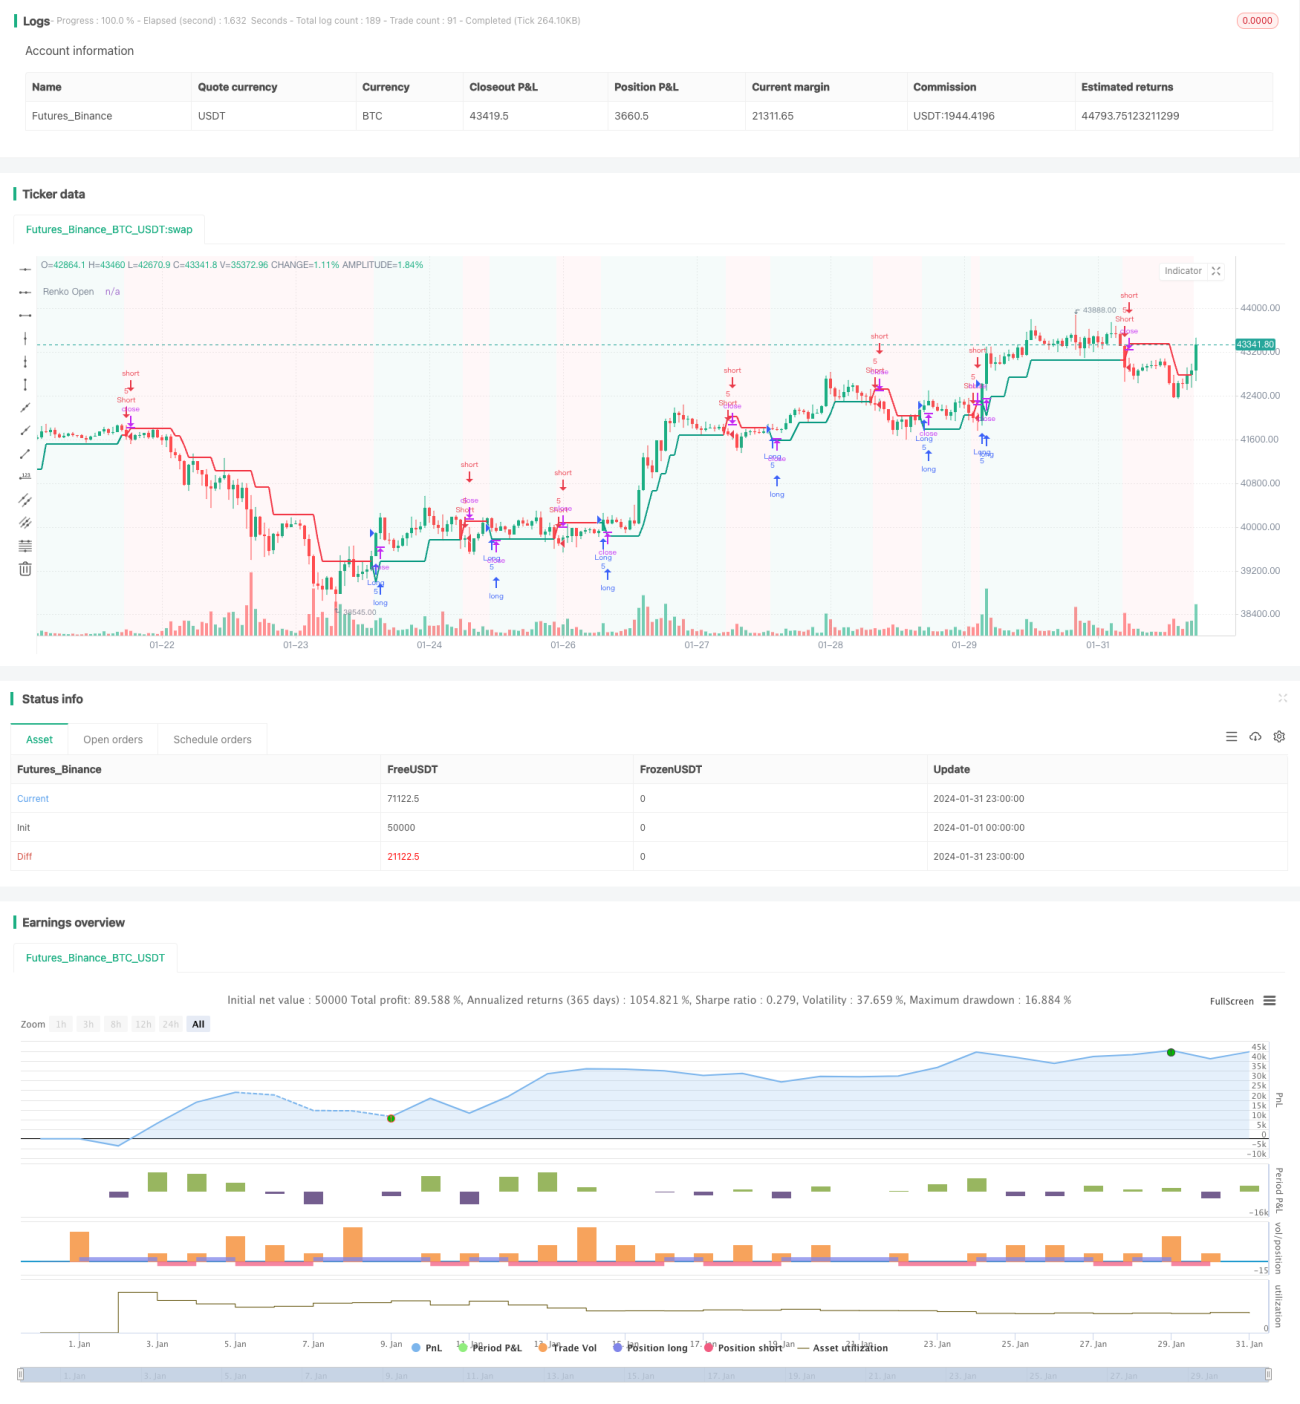
The Renko ATR Trend Reversal Strategy is a unique trading approach that utilizes Renko charts in conjunction with Average True Range (ATR) indicator to identify trend reversal points in financial markets. By eliminating the repainting issue of Renko charts, this strategy is able to accurately capture turning points and provide clear signals for trading decisions.
Strategy Logic
Renko Brick Generation
The strategy first calculates the ATR value over a defined period and uses this ATR as the brick size for the Renko chart. New Renko bricks are drawn when price movements exceed one ATR. In this way, the Renko chart can automatically adapt to the volatility of the market, with larger brick sizes for higher volatility and smaller brick sizes for lower volatility periods.
Buy and Sell Signal Generation
A buy signal is generated when the open price of the Renko chart crosses below the close price. Conversely, a sell signal is generated when the open price crosses above the close price. These signals mark potential trend reversal points.
Stop Loss and Take Profit Setting
The strategy dynamically sets stop-loss and take-profit levels for each trade as a percentage of the Renko open price, based on user-defined input parameters. This controls the risk and reward for every trade.
Advantage Analysis
Eliminates Repainting
By manually calculating the open and close prices, repainting is eliminated, making the signals more accurate and timely.
Auto-Adaptivity to Volatility
The ATR-based brick size allows the strategy to automatically adapt to different market volatility conditions.
Dynamic Stop Loss and Take Profit
The dynamic mechanism for setting stop loss and take profit levels allows better risk control based on market volatility.
Clean Chart View
The Renko chart filters out market noise and provides a clean visual for spotting trend reversals.
Risk Analysis
Parameter Optimization Risks
Users need to optimize parameters like ATR period, stop loss % and take profit % for different market environments. Poor parameter settings can degrade strategy performance.
Event Risks
Major news events or policy releases may cause rapid slippage beyond stop loss or take profit levels, leading to large losses.
Failed Reversal Risks
In some cases, the signaled reversal pattern may fail to materialize, leading to losing trades.
Enhancement Opportunities
Using Multiple Timeframes
Higher timeframes can be used to gauge the direction of the overall trend. Lower timeframes may filter out false signals.
Combining Other Indicators
Using momentum, volatility or other indicators in combination can enhance signal quality and avoid false signals.
Dynamic Take Profit Adjustment
Take profit ratios can be dynamically adjusted based on market volatility and the distance between entry price and current price.
Conclusion
The Renko ATR Trend Reversal Strategy successfully utilizes Renko charts with ATR indicator to automatically spot trend reversal points in financial markets. Key advantages include repainting elimination, auto-adaptivity to changing volatility, and dynamic stop loss/take profit. However, users need to be wary of parameter optimization risks, event risks and failed reversal risks. Further enhancements may include using multiple timeframes, combining other indicators, and dynamic take profit adjustment.
/*backtest
start: 2024-01-01 00:00:00
end: 2024-01-31 23:59:59
period: 1h
basePeriod: 15m
exchanges: [{"eid":"Futures_Binance","currency":"BTC_USDT"}]
*/

//@version=5
strategy(title='[tradinghook] - Renko Trend Reversal Strategy', shorttitle='[tradinghook] - Renko TRS', overlay=true ,initial_capital = 100, commission_value = 0.05, default_qty_value = 5)

// INPUTS- 1