The Efficient Quant Trading Strategy Combining

Overview
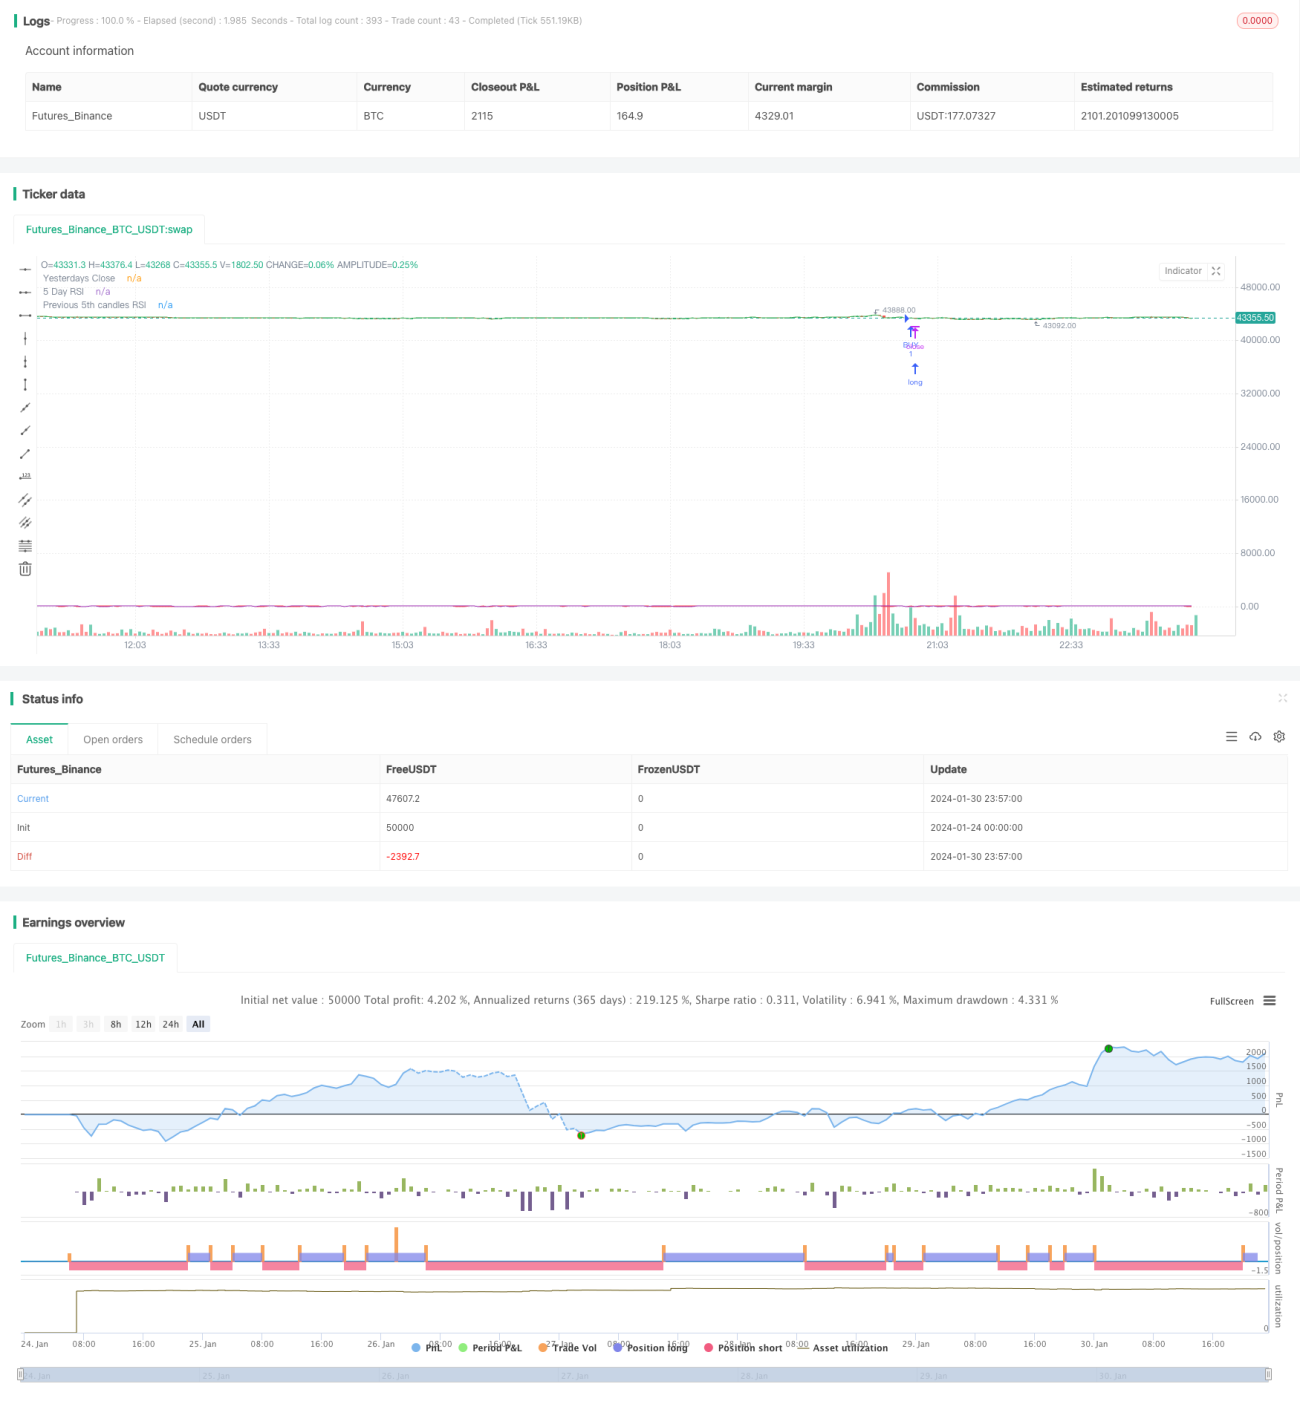
This strategy mainly combines the 5-day RSI indicator and the 200-day moving average to form trading decision signals, which belongs to the technical indicator combination strategy. Its main trading principle is: when the price runs to the overbought/oversold area, it signals to sell; when the price falls to the oversold area, it signals to buy. The biggest advantage of this strategy is that the strategy signal is relatively clear and the retracement risk is relatively small. But there are also limitations in forming trading decisions based solely on a single technical indicator combination, which can be optimized through multi-factor models and machine learning algorithms.
Strategy Principle
This strategy mainly combines the 5-day RSI indicator and the 200-day moving average to judge the overbought/oversold area where prices are running, and forms trading decisions:
-
The 5-day RSI indicator judges the overbought/oversold area where prices are running. The overbought line is set at 72 and the oversold area is 30. When the RSI indicator breaks through 30 from bottom to top, a buy signal is generated; when the RSI indicator falls from top to bottom below 72, a sell signal is generated.
-
The 200-day moving average determines the direction of the medium-to-long-term trend. When the price is below the 200-day moving average, it is a downward phase of the price; when the price is above the 200-day moving average, it is an upward phase of the price.
-
Combining 1 and 2 judgment, this strategy sells out when the 5-day RSI indicator is overbought and breaks down below 72, and buys in when the 5-day RSI breaks below 30 and the price is below the 200-day moving average.
Advantages of the Strategy
-
The strategy signal is relatively clear, using the RSI indicator to determine the overbought/oversold signal by the judgment area.
-
The 200-day moving average determines the direction of the major trend to avoid contrarian operations.
-
The maximum number of positions can be set to help control risks.
-
The strategy has large space for parameter optimization, adjustable RSI parameters and moving average parameters.
-
Relatively small retracement risk can effectively control the maximum retracement of the strategy.
Risks of the Strategy
-
Using only RSI and moving average indicators, the strategy signal may be unstable, with the risk of long and short shaken losses in volatile markets.
-
Need to optimize and test RSI parameters and moving average parameters for better strategy results.
-
Other indicators or models can be introduced to optimize the strategy signal. Such as introducing volatility indicators, machine learning judgements, etc.
Directions for Strategy Optimization
-
Use more indicator combinations to judge. Such as MACD, KD, volatility indicators, etc.
-
Increase machine learning model judgments. Such as LSTM to judge the stability of trading signals.
-
Increase quantitative factors. Such as changes in trading volume, capital flow direction and other judgments of capital factors.
-
Optimize strategy parameters. Such as RSI parameters, moving average parameters, etc.
-
Optimize stop loss mechanisms. Such as moving stop loss, time stop loss, etc.
Summary
This strategy mainly uses the combination of the 5-day RSI indicator and the 200-day moving average indicator to judge the overbought/oversold area of prices and form trading signals. It belongs to the technical indicator combination strategy. The strategy signal is relatively clear and the maximum retracement risk is relatively small. But it can be further optimized through multi-indicator combinations and machine learning judgments to improve strategy results.
- 1