Quantitative Trading Strategy Based on Ichimoku Cloud Breakout and ADX Index

Overview
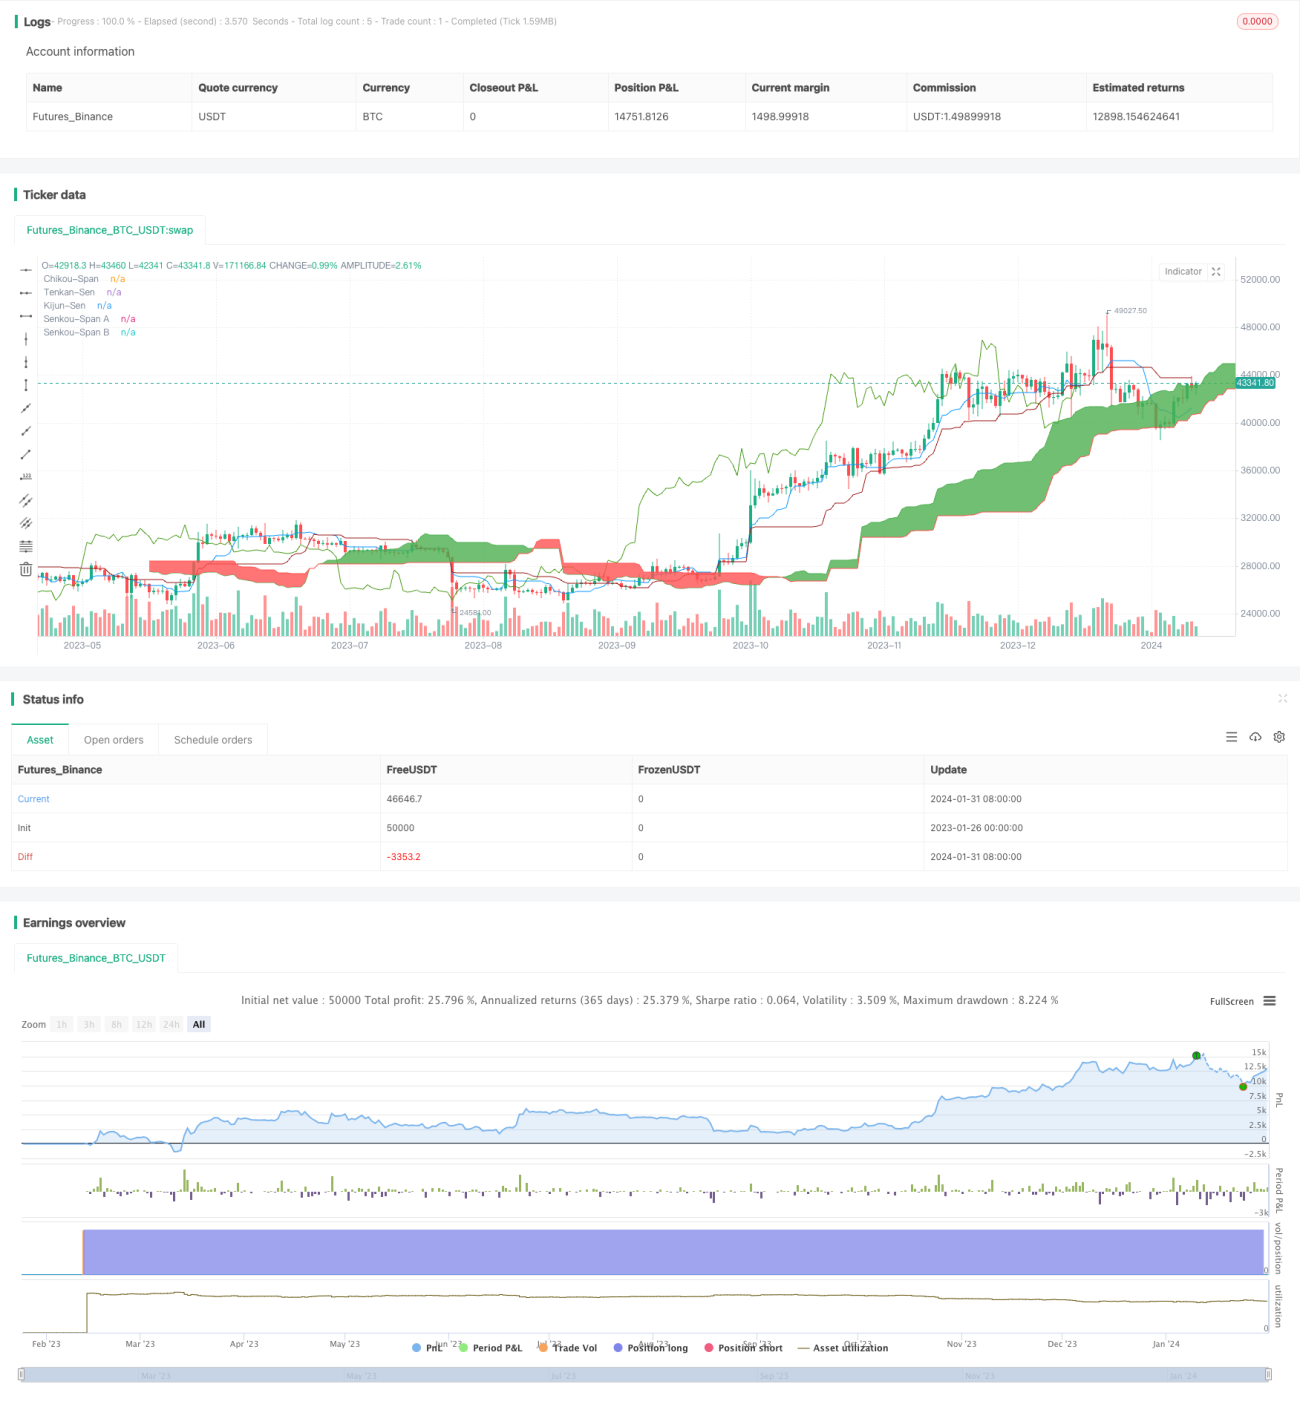
The name of this strategy is “Quantitative Trading Strategy Based on Ichimoku Cloud Breakout and ADX Index”. It combines Ichimoku cloud charting with Average Directional Movement Index (ADX) to determine when to take long or short positions. Specifically, it enters positions when price breaks through key areas of the cloud chart and ADX shows strong trend.
Strategy Logic
The strategy uses “Ichimoku Cloud” from Ichimoku Kinko Hyo indicators to identify key support and resistance areas. It also incorporates ADX index to judge trend strength. The specific trading rules are:
Long entry signals:
- Conversion line crosses above base line
- Lagging line crosses above 0 axis
- Price above cloud top
- ADX below 45 (indicating trend not overextended)
- +DI above -DI (indicating uptrend)
Short entry signals:
- Conversion line crosses below base line
- Lagging line crosses below 0 axis
- Price below cloud bottom
- ADX above 45 (indicating possible trend reversal)
- +DI below -DI (indicating downtrend)
Advantage Analysis
The strategy combines chart pattern analysis and trend analysis indicators, which can effectively determine market trends and strong areas. The main advantages are:
- Using Ichimoku cloud to determine key support/resistance levels to catch strong trends
- Incorporating ADX index to gauge true trend strength, avoiding false trades
- Clear rules easy to follow for live trading
Risks and Solutions
There are some risks with this strategy, mainly around instability in ADX trend determination. The risks and solutions are:
- ADX has lagging effect, may miss fast reversals. Can lower ADX parameters to make it more sensitive
- ADX does not work well in ranging markets. Can add filters like BOLL channel
- Ichimoku cloud can also fail. Can adjust parameters or add auxiliary indicators
Optimization Suggestions
The strategy can be further optimized in the following ways:
- Adjust Ichimoku parameters to suit more instruments
- Add stop loss to control single trade loss
- Incorporate more indicators to filter signals
- Add machine learning prediction to further determine trend signals
Conclusion
This strategy combines Ichimoku cloud charting and ADX trend index to form a complete quantitative trading system. It identifies key support/resistance levels while also judging trend. It can effectively capture market opportunities. The strategy is easy to implement in live trading and also has room for optimization. Overall it is a quality quantitative strategy.
- 1