Dynamic Multi-indicator Quantitative Trading Strategy

Overview
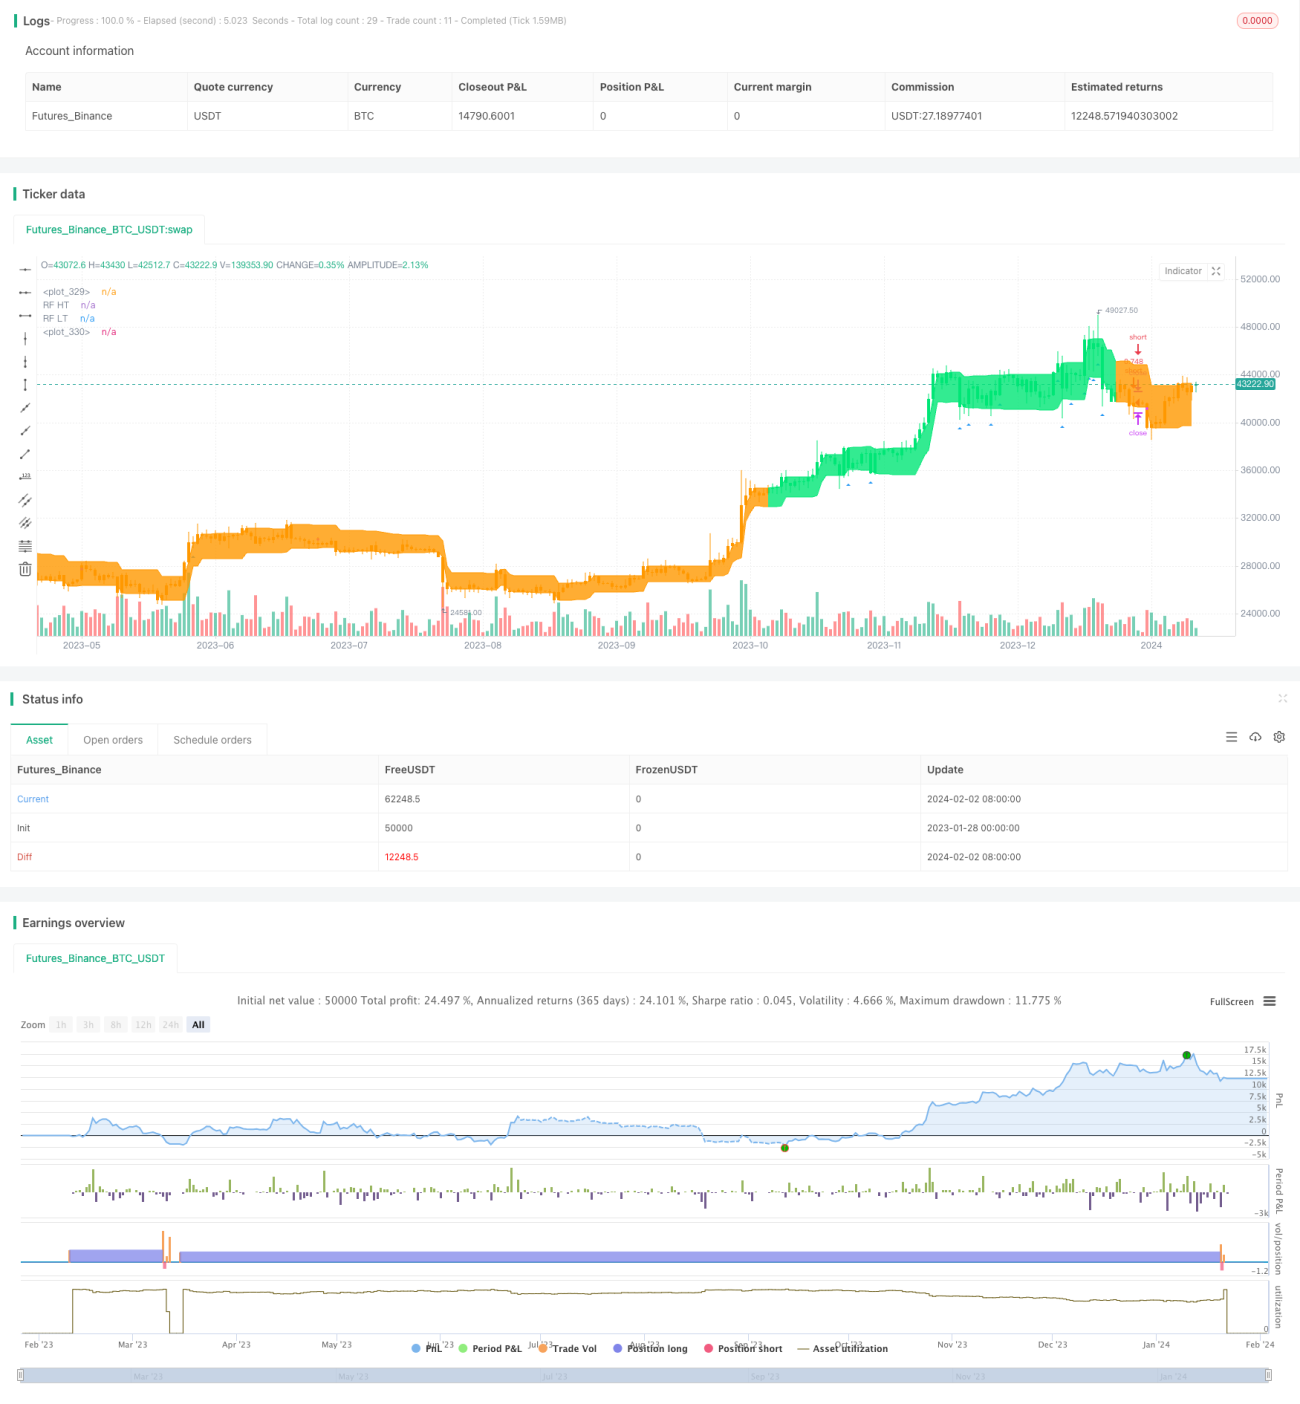
This strategy utilizes the combination signals of multiple technical indicators to dynamically trade the underlying assets like stocks and cryptocurrencies. The strategy can automatically identify market trends and track them. Also, stop loss mechanism is incorporated to control risks.
Principles
This strategy mainly leverages moving averages, relative strength index (RSI), average true range (ATR) and directional movement index (ADX) to generate trading signals.
Specifically, it first adopts double moving average crossovers to form signals. The fast line has a length of 10 days and the slow line has a length of 50 days. Golden crossovers (fast line breaking above slow line from below) generate buy signals while dead crossovers generate sell signals. This system can effectively identify reversals in long-term trends.
On top of double MAs, RSI is introduced to confirm the trend signals and avoid false breakouts. RSI judges the market strength by the divergence between the fast and slow line. When RSI breaks above 30, buy signal is generated. When breaking below 70, sell signal is generated.
In addition, ATR is used to automatically adjust the stop loss level. ATR can effectively reflect the volatility of markets. When volatility rises, wider stop loss will be set to reduce the probability of being stopped out.
Finally, ADX gauges the strength of the trend. ADX uses the divergence between the positive indicator DI+ and negative indicator DI- to measure trend strength. Only when ADX breaks above 20, the trend is considered to be established and actual trading signals are generated.
By combining signals from multiple indicators, the strategy can be more prudent in sending trading signals, avoiding the interference from false signals and hence achieving higher win rate.
Advantages
The advantages of this strategy include:
- Combination of multiple indicators improves decision accuracy
The combination of MA, RSI, ATR, ADX and more can improve the accuracy and avoid faulty judgements due to single indicator.
- Automatic stop loss adjustment controls risks
Adjusting stop loss based on market volatility can reduce the probability of being stopped out and effectively manage risks.
- Judging trend strength avoids trading against trends
By judging trend strength with ADX before actual trading, losses from trading against trends can be reduced.
- Large parameter tuning space
Parameters like MA lengths, RSI length, ATR period and ADX period can all be adjusted and optimized for different markets. Hence the strategy has strong adaptability.
- Protecting long-term profits
Identifying long-term trends using the fast and slow MA system and reducing short-term noises with indicators like RSI, long-term holding in trends becomes possible for higher profits.
Risks & Solutions
There are also a few risks associated with this strategy:
- Parameter optimization difficulty
More parameters means greater difficulty in optimization. Unsuitable parameter sets may deteriorate strategy performance. More adequate backtesting and parameter tuning can alleviate this risk.
- Indicator failure risk
All technical indicators have applicable market states. When markets enter peculiar states, indicators used may fail simultaneously. Risks from such BLACK SWAN events need attention.
- Unlimited loss risk from shorting
The strategy allows short trading. Short positions inherently have the risk of unlimited losses. This can be reduced by setting proper stop loss.
- Trend reversal risk
Indicators cannot promptly respond to reversals. Wrong directional positions often incur losses during reversals. Shortening parameters of some indicators may improve sensitivities.
Optimization
There is room for further optimization:
- Adaptive indicator weighting
Analyze correlations between indicators/market states and design mechanisms to dynamically adjust indicator weights based on changing market conditions to improve decisions.
- Augmentation by deep learning
Use deep learning models to forecast price movement directions and augment the rules-based system to improve accuracy.
- Adaptive parameter tuning
Design adaptive tuning modules for indicator parameters based on sliding window historical data so that the strategy can better adapt.
- Incorporate variable-period analysis
Integrate variable-period analysis like Elliott Waves Theory to assist judging mid-long term trends and improve profitability.
Conclusion
In summary, this strategy integrates MA, RSI, ATR, ADX and more into a relatively comprehensive system, which can identify longer-term trends via the MA system and reduce noise interference with short-term indicators like RSI. Also, large optimization space exists for performance improvement. The strategy improves decisions by combining indicators and controls risks. It deserves further research and application.
- 1