Bollinger Bands Breakout Quantitative Trading Strategy

Overview
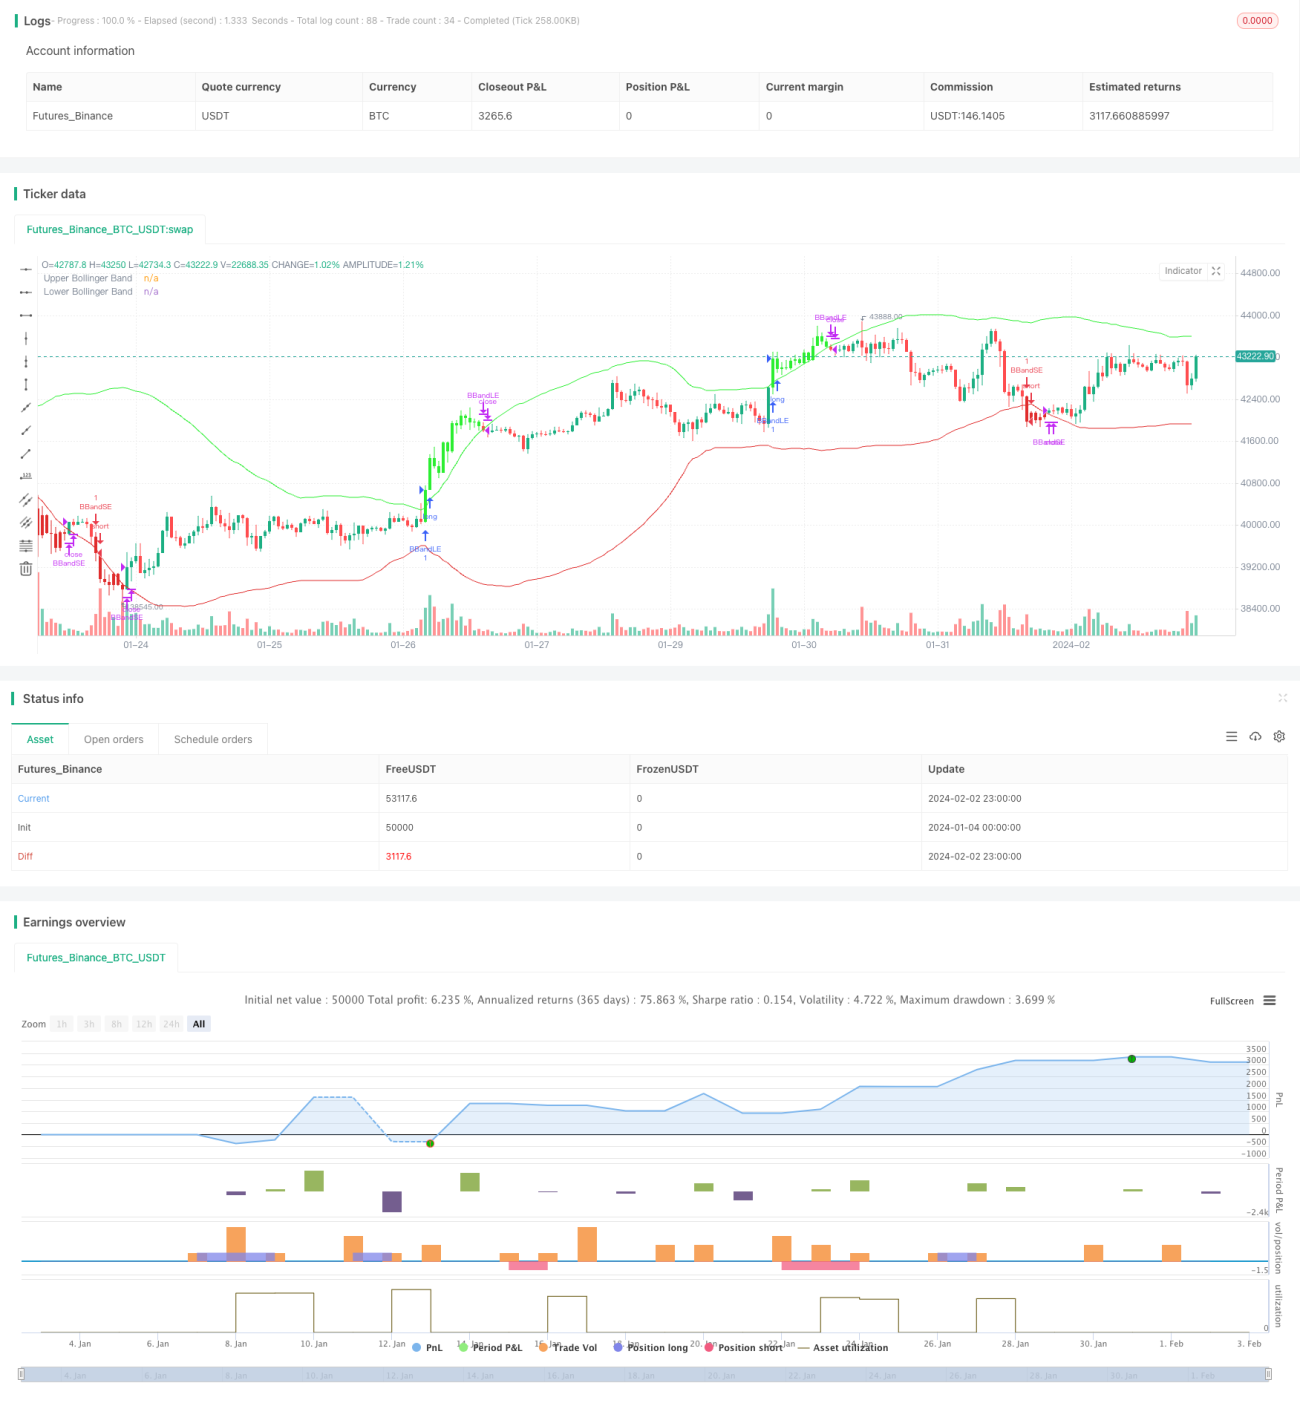
This strategy calculates the upper band, middle band and lower band of Bollinger Bands and combines the closing price of K-line to implement Bollinger Bands breakout trading strategy. It goes long when price breaks through the upper band and goes short when price breaks through the lower band. Stop loss and take profit prices are also set.
Strategy Principle
-
Calculate the middle band SMA of Bollinger Bands with period 60, representing the middle band of price trend.
-
Calculate the upper band and lower band of Bollinger Bands. The upper band is middle band + 2 times standard deviation and the lower band is middle band - 2 times standard deviation. The band width is controlled by multiplier.
-
When closing price is greater than the upper band, go long. When closing price is less than the lower band, go short.
-
Set stop loss and take profit mechanism. The stop loss percentage is 1.5% and take profit percentage is 6%.
-
When price re-enters the Bollinger Bands or reaches stop loss/take profit price, close position.
Advantage Analysis
-
Bollinger Bands indicator has strong ability of trend judgment by breakout.
-
Simple strategy logic and easy to understand and implement.
-
Stop loss and take profit control risks.
Risk Analysis
-
Bollinger Bands breakout cannot accurately determine price trend reversal points, with the risk of false breakout.
-
Unreasonable stop loss and take profit settings may bring greater risks.
-
High trading frequency may be affected by transaction costs.
Optimization Directions
-
Combine with other indicators to filter out false signals, e.g. KDJ for trend and MACD for divergence.
-
Dynamically adjust Bollinger Bands parameters based on market volatility to calculate reasonable band width.
-
Optimize stop loss and take profit strategy, e.g. trailing stop or partial closing.
-
Consider transaction costs' impact and adjust holding period.
Conclusion
This strategy follows trend by Bollinger Bands breakout and has some positive effects. But false breakout may bring greater risks. Combining with other indicators and keep optimizing parameters can control risks and improve profitability.
- 1